Pet Hypothyroidism Therapy Market Size and Share Forecast Outlook 2025 to 2035

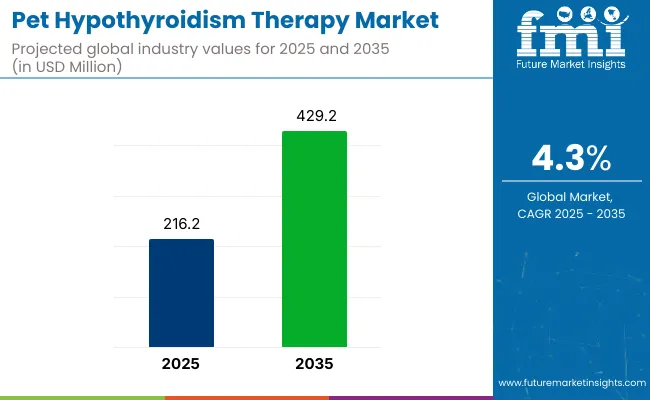
The global pet hypothyroidism therapy market is expected to reach USD 216.2 million in 2025 and is projected to grow to USD 429.2 million by 2035, with a CAGR of 4.3%. This growth is driven by the increasing prevalence of hypothyroidism in pets, particularly dogs, and the rising awareness of pet health. The demand for specialized medical treatments, such as hormone replacement therapies, is being fueled by the growing humanization of pets, particularly among Gen Z pet owners.
Pet Hypothyroidism Therapy Market Quick Stats

  • Market Value (2025): USD 216.2 million
  • Forecast Value (2035): USD 429.2 million
  • Forecast CAGR: 4.3%
  • Leading Segment in 2025: Tablets (~61.7% share)
  • Key Growth Region: Asia (India)
  • Top Key Players: Dechra Pharmaceuticals PLC, LLOYD, Inc., Merck & Co., Inc., Virbac, Zoetis

Pet Hypothyroidism Therapy Market

Attribute Value
Market Size in 2025 USD 216.2 million
Market Size in 2035 USD 429.2 million
CAGR (2025 to 2035) 4.3%

The primary treatment for hypothyroidism in pets, levothyroxine sodium, is expected to be widely used for managing the condition in dogs. Tablet-based treatments are preferred due to their convenience and effectiveness, making them the most commonly prescribed form of therapy. Other treatment forms, such as injections and supplements, are being developed, but tablets are still considered the most common method.

The continued focus on improving treatments for pet hypothyroidism is expected to drive innovation in the market, with more efficient and targeted solutions being introduced. Other forms of treatment, such as injections and supplements, are being developed but tablets remain the most common form of therapy.

Innovation in hormone replacement therapies will continue to be driven by leading players such as Dechra Pharmaceuticals PLC, LLOYD, Inc., Merck & Co., Inc., Virbac, and Zoetis. According to Jeff Simmons, President & CEO of Elanco Animal Health, "Pet owners today, particularly Gen Zers, are more likely to see their pets as best friends, which drives an increased willingness to spend. At the same time, there’s increasing demand for animal protein." This shift in perception is expected to contribute to the growth of the pet healthcare market, including the pet hypothyroidism therapy segment.

Analysing Pet Hypothyroidism Therapy Market by Top Investment Segments

The pet hypothyroidism therapy market is categorized into several segments, including therapy type, dosage form, species, sales channels, and regions. The therapy segment includes levothyroxine sodium replacement therapy, methimazole, and carbimazole. In terms of dosage form, the market covers tablets and oral solutions.

The species segment is divided into canine and feline species. Sales channels encompass veterinary hospitals, veterinary clinics, retail pharmacy chains, and online sales platforms. Geographically, the market spans across North America, Western Europe, East Asia, and South Asia, reflecting its broad global reach.

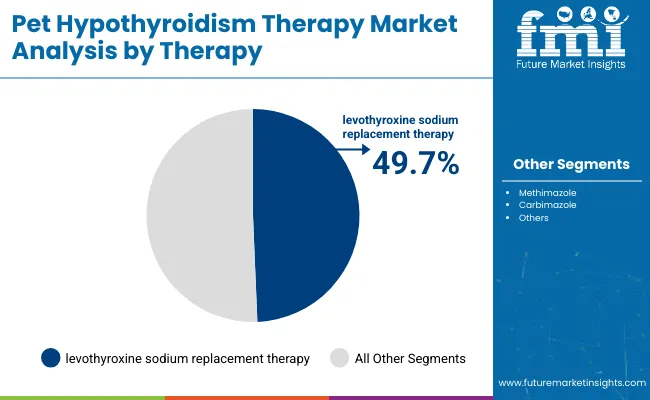
Levothyroxine Sodium Replacement to Lead Therapy Segment with 49.7% Market Share

Levothyroxine sodium replacement is projected to dominate the pet hypothyroidism therapy market, accounting for 49.7% of the market share in 2025. This synthetic thyroid hormone is recognized for its effectiveness in managing hypothyroidism in pets, particularly dogs.
  • Known for restoring thyroid function and enhancing overall health, levothyroxine sodium has become the go-to therapy for treating hypothyroid pets.
  • Leading companies such as Eli Lilly, Zoetis, and Merck have been at the forefront of producing this therapy. It is widely prescribed by veterinarians due to its proven efficacy in controlling symptoms and maintaining a balanced thyroid function, making it a preferred treatment option in the market.

Pet Hypothyroidism Therapy Market Analysis By Therapy

Tablets Expected to Dominate Dosage Form Segment with 61.7% Market Share

Tablets are projected to dominate the pet hypothyroidism therapy market, holding a 61.7% share by 2025. Their widespread use is attributed to their ease of administration, precise dosing, and convenience, making them the preferred choice for long-term management of hypothyroidism in pets.

  • Pet owners and veterinarians value the reliability of tablet forms for consistent medication delivery over extended periods. Major pharmaceutical companies, including Zoetis, Elanco, and Bayer, are continuously improving tablet formulations to enhance absorption and effectiveness.
  • Tablets' proven benefits and simple administration methods make them the primary choice for pet hypothyroidism treatment, ensuring long-term success in managing the condition.

Canine Species to Lead Pet Hypothyroidism Therapy Market with 55.9% Share

Canines are expected to capture 55.9% of the market share for pet hypothyroidism therapies by 2025. Hypothyroidism is a prevalent endocrine disorder, especially in older dog breeds.

  • The increasing number of dogs diagnosed with this condition is driving the demand for effective treatments, particularly levothyroxine sodium. The growth in pet ownership and the aging canine population has contributed significantly to the demand for treatment options.
  • Veterinary research continues to focus on improving treatments specific to canines, ensuring more effective management of hypothyroidism. As the largest group affected, canines are expected to remain the primary beneficiaries of thyroid hormone therapies, fueling continued market growth.

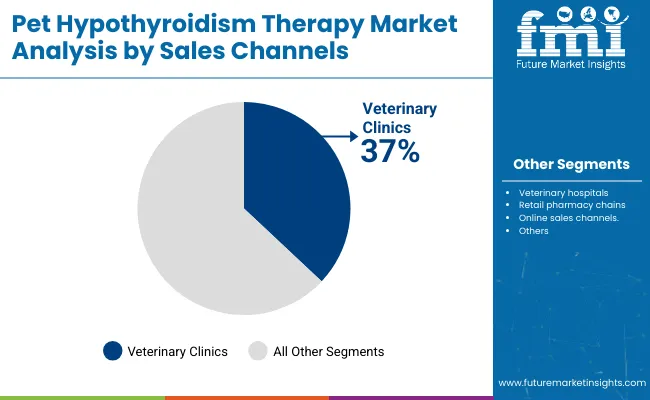
Veterinary Clinics to Lead Sales Channels with 37% Market Share

Veterinary clinics are anticipated to capture 37% of the pet hypothyroidism therapy market share by 2025. Clinics play a crucial role in diagnosing and treating hypothyroidism in pets, offering diagnostic tests and personalized treatment plans.
  • Veterinarians prescribe levothyroxine sodium and other therapies after conducting detailed assessments, making clinics the primary point of care for pet hypothyroidism management.
  • Leading veterinary chains, including VCA Animal Hospitals and Banfield Pet Hospital, provide comprehensive care and regularly monitor treatment progress. As the number of pets receiving medical care increases globally, veterinary clinics are projected to remain the dominant sales channel, ensuring broad access to hypothyroidism treatments.

Pet Hypothyroidism Therapy Market Analysis By Sales Channel

Top Pet Hypothyroidism Therapy Market Dynamics

The pet hypothyroidism therapy market is being driven by the increasing prevalence of hypothyroidism in dogs and advancements in diagnostic and treatment options.However, challenges such as high treatment costs and the need for lifelong medication are limiting market growth.

Increasing prevalence of hypothyroidism in dogs is driving market growth

The increasing prevalence of hypothyroidism in dogs is significantly driving the pet hypothyroidism therapy market. This disorder, which leads to a decrease in the production of thyroxine hormones, is being recognized as one of the most common endocrine conditions in dogs. The condition causes various clinical signs, including metabolic and dermatological alterations.

The rising number of diagnosed cases is boosting the demand for effective therapeutic solutions. Advances in diagnostic techniques, enabling earlier and more accurate detection, are contributing to more timely interventions, thereby expanding the market for hypothyroidism therapies in pets.

High treatment costs and need for lifelong medication are limiting market growth

Despite the growing demand for hypothyroidism therapies, the market is being hindered by high treatment costs and the need for lifelong medication. The standard treatment for hypothyroidism in dogs, levothyroxine, requires ongoing administration and regular monitoring to adjust dosages appropriately. These long-term treatment requirements are creating significant financial commitments for pet owners.

Additionally, the need for continuous veterinary care and regular adjustments in medication dosages is increasing the overall cost. These factors are making it difficult for some pet owners to access and sustain treatment, which is limiting the growth of the pet hypothyroidism therapy market.

Analyzing Top Countries Manufacturing, Distributing, and Supplying Pet Hypothyroidism Therapy Solutions

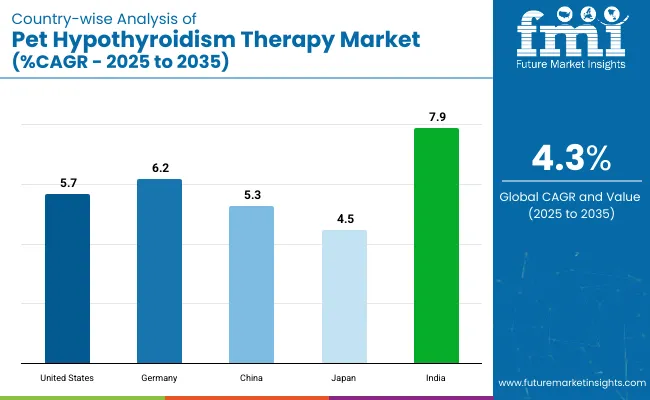
The pet hypothyroidism therapy market is expected to grow through 2035, driven by increasing awareness of pet health and the rising demand for effective thyroid treatments. Rapid growth is observed in emerging economies like China and India, while established markets like the USA and Germany are focusing on advancements in pet care and treatment options.
Country Wise Anlaysis Of Pet Hypothyroidism Therapy Market

Countries CAGR (%)
United States 5.7%
Germany 6.2%
China 5.3%
Japan 4.5%
India 7.9%

In-depth Analysis of the United States Pet Hypothyroidism Therapy Market

The United States pet hypothyroidism therapy market is expected to grow at a CAGR of 5.7% through 2035. Growth is driven by increased awareness of hypothyroidism in pets and the availability of advanced thyroid replacement therapies.

  • Leading companies like Hill’s Pet Nutrition, Mars Petcare, and VCA Animal Hospitals are investing in developing effective therapies and improving treatment options for pets with hypothyroidism.
  • Regulatory frameworks and consumer awareness campaigns are contributing to market growth. Advances in diagnostic tests and treatments are being continuously made, supporting the adoption of thyroid therapies for pets.

Forecast Outlook for Germany Pet Hypothyroidism Therapy Market

The pet hypothyroidism therapy market is projected to grow at a CAGR of 6.2% through 2035. Growth is being supported by high standards of veterinary care and continued research into pet healthcare.

  • Companies such as Bayer, Boehringer Ingelheim, and Zoetis are advancing the development of new therapies for managing hypothyroidism in pets.
  • Government policies supporting veterinary research and healthcare advancements are contributing to market growth. The increasing prevalence of hypothyroidism in pets is further fueling the demand for therapies.
  • Germany is expected to continue to see steady growth in the market, driven by product innovation and improved treatment options.

Detailed Analysis of China Pet Hypothyroidism Therapy Market

The pet hypothyroidism therapy market is expected to grow at a CAGR of 5.3% through 2035. The market is driven by rising health awareness among pet owners and the growing availability of veterinary care.

  • Domestic companies and international players like Zoetis and Boehringer Ingelheim are investing in the development of pet-specific therapies.
  • Government policies supporting the improvement of veterinary healthcare infrastructure and services are contributing to market growth. The increasing number of pet owners, alongside greater awareness of pet thyroid health, is accelerating the adoption of treatments.
  • Technological advancements in diagnostics and therapy delivery are further fueling market expansion in China.

Japan Pet Hypothyroidism Therapy Market Outlook

Thepet hypothyroidism therapy market is projected to grow at a CAGR of 4.5% through 2035. Growth is being supported by the country’s aging pet population and increasing demand for effective thyroid treatment solutions.

  • Leading pharmaceutical companies such as MSD Animal Health and Zoetis are developing and providing specialized therapies for pets with hypothyroidism.
  • The highly developed veterinary healthcare system ensures treatments adhere to stringent safety and efficacy standards. The rise in pet ownership and the growing focus on preventive care are contributing to the market’s expansion.
  • Research and development in the field are expected to continue driving the adoption of therapies for pet hypothyroidism.

Growth Outlook for India Pet Hypothyroidism Therapy Market

The pet hypothyroidism therapy market is expected to grow at a CAGR of 7.9% through 2035. Growth is being driven by rising pet ownership, increasing awareness of pet health, and improving healthcare infrastructure.

  • Local and global companies such as Virbac, Zoetis, and Elanco are expanding their presence in India with effective therapies for pet hypothyroidism.
  • Government initiatives and the rising number of veterinary clinics are supporting market growth.
  • The increased prevalence of thyroid disorders in pets, coupled with a growing middle class and increased pet spending, is accelerating the adoption of therapeutic treatments. India is set to be a key market for pet hypothyroidism therapy.

Leading Suppliers in the Pet Hypothyroidism Therapy Market

The pet hypothyroidism therapy market is segmented into key players and emerging players. Key players like Dechra Pharmaceuticals PLC, Merck & Co., Inc., Zoetis, Elanco Animal Health, Boehringer Ingelheim Animal Health, and Virbac dominate the market with their extensive product portfolios, technological advancements, and strong global presence.

FDA-approved levothyroxine sodium tablets, including Thyro-Tabs Canine and ThyroKare™, are offered for the treatment of hypothyroidism in dogs. Other significant players such as LLOYD, Inc., Ceva Animal Health, and Vetoquinol focus on hormone replacement therapies for hypothyroidism in pets. Emerging players like Norbrook Laboratories offer alternative therapies targeting regional markets.

Recent Pet Hypothyroidism Therapy Industry News

  • In May 2024, Royal Canin USA expanded its Veterinary Gastrointestinal portfolio with five new diets tailored to support digestive health in cats and dogs. These diets, including options with hydrolyzed proteins, low fat, and high fiber formulations, were designed to manage food sensitivities, promote microbiome balance, and address gastrointestinal issues.
  • In August 2024, Rossari Biotech's Pet Care division launched Vetsense, a new line of prescription diets aimed at enhancing pet health. The initial range, introduced at IVACON 2024, includes formulas for gastrointestinal support, weight management, dermatological care, and a weaning supplement, all developed with natural ingredients. These innovations highlight advancements in therapeutic diets for pets.

Key Players in the Pet Hypothyroidism Therapy Market

  • Dechra Pharmaceuticals PLC
  • LLOYD, Inc.
  • Merck & Co., Inc.
  • Virbac
  • Zoetis
  • Elanco Animal Health
  • BoehringerIngelheim Animal Health
  • Bayer Animal Health
  • Ceva Animal Health
  • Vetoquinol
  • Norbrook Laboratories

Research Coverage and Scope Summary

Report Attributes Details
Current Total Market Size (2025) USD 216.2 million
Projected Market Size (2035) USD 429.2 million
CAGR (2025 to 2035) 4.3%
Base Year for Estimation 2024
Historical Period 2020 to 2024
Projections Period 2025 to 2035
Quantitative Units USD million for value and million doses for units
Therapies Covered (Segment 1) Levothyroxine sodium replacement therapy; Methimazole;Carbimazole
Dosage Forms Covered (Segment 2) Tablets; Oral solutions
Species Covered (Segment 3) Canine; Feline
Sales Channels Covered (Segment 4) Veterinary hospitals; Veterinary clinics; Retail pharmacy chains; Online sales channels
Regions Covered North America; Western Europe; East Asia; South Asia
Countries Covered United States; Canada; United Kingdom; Germany; France; Italy; Spain; Netherlands; China; Japan; South Korea; India; Pakistan; Bangladesh
Key Players Influencing the Market Dechra Pharmaceuticals PLC; VetOne; Merck & Co., Inc.; Virbac ; LLOYD, Inc.; Grey Wolf Animal Health; Norbrook
Additional Attributes Dollar sales by therapy type (levothyroxine sodium, methimazole, carbimazole); Market adoption in canine vs feline species; Growth of online sales channels vs veterinary clinics; Trends in tablet vs oral solution forms of therapy

Key Segments

By Therapy:

The market is segmented into levothyroxine sodium replacement therapy, methimazole, and carbimazole.

By Dosage Form:

The market includes tablets and oral solutions.

By Species:

The market is categorized into canine and feline species.

By Sales Channel:

The market covers veterinary hospitals, veterinary clinics, retail pharmacy chains, and online sales channels.

By Region:

The market spans North America, Western Europe, East Asia, and South Asia.

Table of Content

  1. Executive Summary
  2. Market Overview
  3. Market Background
  4. Global Market Analysis 2020 to 2024 and Forecast, 2025 to 2035
  5. Global Market Pricing Analysis 2020 to 2024 and Forecast 2025 to 2035
  6. Global Market Analysis 2020 to 2024 and Forecast 2025 to 2035, By Therapy
    • Levothyroxine sodium Replacement Therapy
    • Methimazole
    • Carbimazole
  7. Global Market Analysis 2020 to 2024 and Forecast 2025 to 2035, By Dosage Form
    • Tablets
    • Oral Solutions
  8. Global Market Analysis 2020 to 2024 and Forecast 2025 to 2035, By Species
    • Canine
    • Feline
  9. Global Market Analysis 2020 to 2024 and Forecast 2025 to 2035, By Sales Channel
    • Veterinary Hospitals
    • Veterinary Clinics
    • Retail Pharmacy Chains
    • Online Sales Channel
  10. Global Market Analysis 2020 to 2024 and Forecast 2025 to 2035, By Region
    • North America
    • Latin America
    • Western Europe
    • Eastern Europe
    • East Asia
    • South Asia & Pacific
    • Middle East and Africa
  11. North America Market Analysis 2020 to 2024 and Forecast 2025 to 2035, By Country
  12. Latin America Market Analysis 2020 to 2024 and Forecast 2025 to 2035, By Country
  13. Western Europe Market Analysis 2020 to 2024 and Forecast 2025 to 2035, By Country
  14. Eastern Europe Market Analysis 2020 to 2024 and Forecast 2025 to 2035, By Country
  15. East Asia Market Analysis 2020 to 2024 and Forecast 2025 to 2035, By Country
  16. South Asia & Pacific Market Analysis 2020 to 2024 and Forecast 2025 to 2035, By Country
  17. Middle East and Africa Market Analysis 2020 to 2024 and Forecast 2025 to 2035, By Country
  18. Key Countries Market Analysis
  19. Market Structure Analysis
  20. Competition Analysis
    • Dechra Pharmaceuticals PLC
    • LLOYD, Inc.
    • Merck & Co., Inc.
    • Virbac
    • Zoetis
    • Elanco Animal Health
    • Boehringer Ingelheim Animal Health
    • Bayer Animal Health
    • Ceva Animal Health
    • Vetoquinol
    • Norbrook Laboratories
  21. Assumptions & Acronyms Used
  22. Research Methodology

List of Tables

  • Table 1: Global Market Value (USD Million) Forecast by Region, 2020 to 2035
  • Table 2: Global Market Volume (Million Dose) Forecast by Region, 2020 to 2035
  • Table 3: Global Market Value (USD Million) Forecast by Therapy, 2020 to 2035
  • Table 4: Global Market Volume (Million Dose) Forecast by Therapy, 2020 to 2035
  • Table 5: Global Market Value (USD Million) Forecast by Dosage Form, 2020 to 2035
  • Table 6: Global Market Volume (Million Dose) Forecast by Dosage Form, 2020 to 2035
  • Table 7: Global Market Value (USD Million) Forecast by Species, 2020 to 2035
  • Table 8: Global Market Volume (Million Dose) Forecast by Species, 2020 to 2035
  • Table 9: Global Market Value (USD Million) Forecast by Sales Channel, 2020 to 2035
  • Table 10: Global Market Volume (Million Dose) Forecast by Sales Channel, 2020 to 2035
  • Table 11: North America Market Value (USD Million) Forecast by Country, 2020 to 2035
  • Table 12: North America Market Volume (Million Dose) Forecast by Country, 2020 to 2035
  • Table 13: North America Market Value (USD Million) Forecast by Therapy, 2020 to 2035
  • Table 14: North America Market Volume (Million Dose) Forecast by Therapy, 2020 to 2035
  • Table 15: North America Market Value (USD Million) Forecast by Dosage Form, 2020 to 2035
  • Table 16: North America Market Volume (Million Dose) Forecast by Dosage Form, 2020 to 2035
  • Table 17: North America Market Value (USD Million) Forecast by Species, 2020 to 2035
  • Table 18: North America Market Volume (Million Dose) Forecast by Species, 2020 to 2035
  • Table 19: North America Market Value (USD Million) Forecast by Sales Channel, 2020 to 2035
  • Table 20: North America Market Volume (Million Dose) Forecast by Sales Channel, 2020 to 2035
  • Table 21: Latin America Market Value (USD Million) Forecast by Country, 2020 to 2035
  • Table 22: Latin America Market Volume (Million Dose) Forecast by Country, 2020 to 2035
  • Table 23: Latin America Market Value (USD Million) Forecast by Therapy, 2020 to 2035
  • Table 24: Latin America Market Volume (Million Dose) Forecast by Therapy, 2020 to 2035
  • Table 25: Latin America Market Value (USD Million) Forecast by Dosage Form, 2020 to 2035
  • Table 26: Latin America Market Volume (Million Dose) Forecast by Dosage Form, 2020 to 2035
  • Table 27: Latin America Market Value (USD Million) Forecast by Species, 2020 to 2035
  • Table 28: Latin America Market Volume (Million Dose) Forecast by Species, 2020 to 2035
  • Table 29: Latin America Market Value (USD Million) Forecast by Sales Channel, 2020 to 2035
  • Table 30: Latin America Market Volume (Million Dose) Forecast by Sales Channel, 2020 to 2035
  • Table 31: Western Europe Market Value (USD Million) Forecast by Country, 2020 to 2035
  • Table 32: Western Europe Market Volume (Million Dose) Forecast by Country, 2020 to 2035
  • Table 33: Western Europe Market Value (USD Million) Forecast by Therapy, 2020 to 2035
  • Table 34: Western Europe Market Volume (Million Dose) Forecast by Therapy, 2020 to 2035
  • Table 35: Western Europe Market Value (USD Million) Forecast by Dosage Form, 2020 to 2035
  • Table 36: Western Europe Market Volume (Million Dose) Forecast by Dosage Form, 2020 to 2035
  • Table 37: Western Europe Market Value (USD Million) Forecast by Species, 2020 to 2035
  • Table 38: Western Europe Market Volume (Million Dose) Forecast by Species, 2020 to 2035
  • Table 39: Western Europe Market Value (USD Million) Forecast by Sales Channel, 2020 to 2035
  • Table 40: Western Europe Market Volume (Million Dose) Forecast by Sales Channel, 2020 to 2035
  • Table 41: Eastern Europe Market Value (USD Million) Forecast by Country, 2020 to 2035
  • Table 42: Eastern Europe Market Volume (Million Dose) Forecast by Country, 2020 to 2035
  • Table 43: Eastern Europe Market Value (USD Million) Forecast by Therapy, 2020 to 2035
  • Table 44: Eastern Europe Market Volume (Million Dose) Forecast by Therapy, 2020 to 2035
  • Table 45: Eastern Europe Market Value (USD Million) Forecast by Dosage Form, 2020 to 2035
  • Table 46: Eastern Europe Market Volume (Million Dose) Forecast by Dosage Form, 2020 to 2035
  • Table 47: Eastern Europe Market Value (USD Million) Forecast by Species, 2020 to 2035
  • Table 48: Eastern Europe Market Volume (Million Dose) Forecast by Species, 2020 to 2035
  • Table 49: Eastern Europe Market Value (USD Million) Forecast by Sales Channel, 2020 to 2035
  • Table 50: Eastern Europe Market Volume (Million Dose) Forecast by Sales Channel, 2020 to 2035
  • Table 51: East Asia Market Value (USD Million) Forecast by Country, 2020 to 2035
  • Table 52: East Asia Market Volume (Million Dose) Forecast by Country, 2020 to 2035
  • Table 53: East Asia Market Value (USD Million) Forecast by Therapy, 2020 to 2035
  • Table 54: East Asia Market Volume (Million Dose) Forecast by Therapy, 2020 to 2035
  • Table 55: East Asia Market Value (USD Million) Forecast by Dosage Form, 2020 to 2035
  • Table 56: East Asia Market Volume (Million Dose) Forecast by Dosage Form, 2020 to 2035
  • Table 57: East Asia Market Value (USD Million) Forecast by Species, 2020 to 2035
  • Table 58: East Asia Market Volume (Million Dose) Forecast by Species, 2020 to 2035
  • Table 59: East Asia Market Value (USD Million) Forecast by Sales Channel, 2020 to 2035
  • Table 60: East Asia Market Volume (Million Dose) Forecast by Sales Channel, 2020 to 2035
  • Table 61: South Asia & Pacific Market Value (USD Million) Forecast by Country, 2020 to 2035
  • Table 62: South Asia & Pacific Market Volume (Million Dose) Forecast by Country, 2020 to 2035
  • Table 63: South Asia & Pacific Market Value (USD Million) Forecast by Therapy, 2020 to 2035
  • Table 64: South Asia & Pacific Market Volume (Million Dose) Forecast by Therapy, 2020 to 2035
  • Table 65: South Asia & Pacific Market Value (USD Million) Forecast by Dosage Form, 2020 to 2035
  • Table 66: South Asia & Pacific Market Volume (Million Dose) Forecast by Dosage Form, 2020 to 2035
  • Table 67: South Asia & Pacific Market Value (USD Million) Forecast by Species, 2020 to 2035
  • Table 68: South Asia & Pacific Market Volume (Million Dose) Forecast by Species, 2020 to 2035
  • Table 69: South Asia & Pacific Market Value (USD Million) Forecast by Sales Channel, 2020 to 2035
  • Table 70: South Asia & Pacific Market Volume (Million Dose) Forecast by Sales Channel, 2020 to 2035
  • Table 71: Middle East and Africa Market Value (USD Million) Forecast by Country, 2020 to 2035
  • Table 72: Middle East and Africa Market Volume (Million Dose) Forecast by Country, 2020 to 2035
  • Table 73: Middle East and Africa Market Value (USD Million) Forecast by Therapy, 2020 to 2035
  • Table 74: Middle East and Africa Market Volume (Million Dose) Forecast by Therapy, 2020 to 2035
  • Table 75: Middle East and Africa Market Value (USD Million) Forecast by Dosage Form, 2020 to 2035
  • Table 76: Middle East and Africa Market Volume (Million Dose) Forecast by Dosage Form, 2020 to 2035
  • Table 77: Middle East and Africa Market Value (USD Million) Forecast by Species, 2020 to 2035
  • Table 78: Middle East and Africa Market Volume (Million Dose) Forecast by Species, 2020 to 2035
  • Table 79: Middle East and Africa Market Value (USD Million) Forecast by Sales Channel, 2020 to 2035
  • Table 80: Middle East and Africa Market Volume (Million Dose) Forecast by Sales Channel, 2020 to 2035

List of Figures

  • Figure 1: Global Market Volume (Million Dose) Forecast 2020 to 2035
  • Figure 2: Global Market Pricing Analysis
  • Figure 3: Global Market Value (USD Million) Forecast 2020 to 2035
  • Figure 4: Global Market Value Share and BPS Analysis by Therapy, 2025 and 2035
  • Figure 5: Global Market Y-o-Y Growth Comparison by Therapy, 2025 to 2035
  • Figure 6: Global Market Attractiveness Analysis by Therapy
  • Figure 7: Global Market Value Share and BPS Analysis by Dosage Form, 2025 and 2035
  • Figure 8: Global Market Y-o-Y Growth Comparison by Dosage Form, 2025 to 2035
  • Figure 9: Global Market Attractiveness Analysis by Dosage Form
  • Figure 10: Global Market Value Share and BPS Analysis by Species, 2025 and 2035
  • Figure 11: Global Market Y-o-Y Growth Comparison by Species, 2025 to 2035
  • Figure 12: Global Market Attractiveness Analysis by Species
  • Figure 13: Global Market Value Share and BPS Analysis by Sales Channel, 2025 and 2035
  • Figure 14: Global Market Y-o-Y Growth Comparison by Sales Channel, 2025 to 2035
  • Figure 15: Global Market Attractiveness Analysis by Sales Channel
  • Figure 16: Global Market Value (USD Million) Share and BPS Analysis by Region, 2025 and 2035
  • Figure 17: Global Market Y-o-Y Growth Comparison by Region, 2025 to 2035
  • Figure 18: Global Market Attractiveness Analysis by Region
  • Figure 19: North America Market Incremental $ Opportunity, 2025 to 2035
  • Figure 20: Latin America Market Incremental $ Opportunity, 2025 to 2035
  • Figure 21: Western Europe Market Incremental $ Opportunity, 2025 to 2035
  • Figure 22: Eastern Europe Market Incremental $ Opportunity, 2025 to 2035
  • Figure 23: East Asia Market Incremental $ Opportunity, 2025 to 2035
  • Figure 24: South Asia & Pacific Market Incremental $ Opportunity, 2025 to 2035
  • Figure 25: Middle East and Africa Market Incremental $ Opportunity, 2025 to 2035
  • Figure 26: North America Market Value Share and BPS Analysis by Country, 2025 and 2035
  • Figure 27: North America Market Value Share and BPS Analysis by Therapy, 2025 and 2035
  • Figure 28: North America Market Y-o-Y Growth Comparison by Therapy, 2025 to 2035
  • Figure 29: North America Market Attractiveness Analysis by Therapy
  • Figure 30: North America Market Value Share and BPS Analysis by Dosage Form, 2025 and 2035
  • Figure 31: North America Market Y-o-Y Growth Comparison by Dosage Form, 2025 to 2035
  • Figure 32: North America Market Attractiveness Analysis by Dosage Form
  • Figure 33: North America Market Value Share and BPS Analysis by Species, 2025 and 2035
  • Figure 34: North America Market Y-o-Y Growth Comparison by Species, 2025 to 2035
  • Figure 35: North America Market Attractiveness Analysis by Species
  • Figure 36: North America Market Value Share and BPS Analysis by Sales Channel, 2025 and 2035
  • Figure 37: North America Market Y-o-Y Growth Comparison by Sales Channel, 2025 to 2035
  • Figure 38: North America Market Attractiveness Analysis by Sales Channel
  • Figure 39: Latin America Market Value Share and BPS Analysis by Country, 2025 and 2035
  • Figure 40: Latin America Market Value Share and BPS Analysis by Therapy, 2025 and 2035
  • Figure 41: Latin America Market Y-o-Y Growth Comparison by Therapy, 2025 to 2035
  • Figure 42: Latin America Market Attractiveness Analysis by Therapy
  • Figure 43: Latin America Market Value Share and BPS Analysis by Dosage Form, 2025 and 2035
  • Figure 44: Latin America Market Y-o-Y Growth Comparison by Dosage Form, 2025 to 2035
  • Figure 45: Latin America Market Attractiveness Analysis by Dosage Form
  • Figure 46: Latin America Market Value Share and BPS Analysis by Species, 2025 and 2035
  • Figure 47: Latin America Market Y-o-Y Growth Comparison by Species, 2025 to 2035
  • Figure 48: Latin America Market Attractiveness Analysis by Species
  • Figure 49: Latin America Market Value Share and BPS Analysis by Sales Channel, 2025 and 2035
  • Figure 50: Latin America Market Y-o-Y Growth Comparison by Sales Channel, 2025 to 2035
  • Figure 51: Latin America Market Attractiveness Analysis by Sales Channel
  • Figure 52: Western Europe Market Value Share and BPS Analysis by Country, 2025 and 2035
  • Figure 53: Western Europe Market Value Share and BPS Analysis by Therapy, 2025 and 2035
  • Figure 54: Western Europe Market Y-o-Y Growth Comparison by Therapy, 2025 to 2035
  • Figure 55: Western Europe Market Attractiveness Analysis by Therapy
  • Figure 56: Western Europe Market Value Share and BPS Analysis by Dosage Form, 2025 and 2035
  • Figure 57: Western Europe Market Y-o-Y Growth Comparison by Dosage Form, 2025 to 2035
  • Figure 58: Western Europe Market Attractiveness Analysis by Dosage Form
  • Figure 59: Western Europe Market Value Share and BPS Analysis by Species, 2025 and 2035
  • Figure 60: Western Europe Market Y-o-Y Growth Comparison by Species, 2025 to 2035
  • Figure 61: Western Europe Market Attractiveness Analysis by Species
  • Figure 62: Western Europe Market Value Share and BPS Analysis by Sales Channel, 2025 and 2035
  • Figure 63: Western Europe Market Y-o-Y Growth Comparison by Sales Channel, 2025 to 2035
  • Figure 64: Western Europe Market Attractiveness Analysis by Sales Channel
  • Figure 65: Eastern Europe Market Value Share and BPS Analysis by Country, 2025 and 2035
  • Figure 66: Eastern Europe Market Value Share and BPS Analysis by Therapy, 2025 and 2035
  • Figure 67: Eastern Europe Market Y-o-Y Growth Comparison by Therapy, 2025 to 2035
  • Figure 68: Eastern Europe Market Attractiveness Analysis by Therapy
  • Figure 69: Eastern Europe Market Value Share and BPS Analysis by Dosage Form, 2025 and 2035
  • Figure 70: Eastern Europe Market Y-o-Y Growth Comparison by Dosage Form, 2025 to 2035
  • Figure 71: Eastern Europe Market Attractiveness Analysis by Dosage Form
  • Figure 72: Eastern Europe Market Value Share and BPS Analysis by Species, 2025 and 2035
  • Figure 73: Eastern Europe Market Y-o-Y Growth Comparison by Species, 2025 to 2035
  • Figure 74: Eastern Europe Market Attractiveness Analysis by Species
  • Figure 75: Eastern Europe Market Value Share and BPS Analysis by Sales Channel, 2025 and 2035
  • Figure 76: Eastern Europe Market Y-o-Y Growth Comparison by Sales Channel, 2025 to 2035
  • Figure 77: Eastern Europe Market Attractiveness Analysis by Sales Channel
  • Figure 78: East Asia Market Value Share and BPS Analysis by Country, 2025 and 2035
  • Figure 79: East Asia Market Value Share and BPS Analysis by Therapy, 2025 and 2035
  • Figure 80: East Asia Market Y-o-Y Growth Comparison by Therapy, 2025 to 2035
  • Figure 81: East Asia Market Attractiveness Analysis by Therapy
  • Figure 82: East Asia Market Value Share and BPS Analysis by Dosage Form, 2025 and 2035
  • Figure 83: East Asia Market Y-o-Y Growth Comparison by Dosage Form, 2025 to 2035
  • Figure 84: East Asia Market Attractiveness Analysis by Dosage Form
  • Figure 85: East Asia Market Value Share and BPS Analysis by Species, 2025 and 2035
  • Figure 86: East Asia Market Y-o-Y Growth Comparison by Species, 2025 to 2035
  • Figure 87: East Asia Market Attractiveness Analysis by Species
  • Figure 88: East Asia Market Value Share and BPS Analysis by Sales Channel, 2025 and 2035
  • Figure 89: East Asia Market Y-o-Y Growth Comparison by Sales Channel, 2025 to 2035
  • Figure 90: East Asia Market Attractiveness Analysis by Sales Channel
  • Figure 91: South Asia & Pacific Market Value Share and BPS Analysis by Country, 2025 and 2035
  • Figure 92: South Asia & Pacific Market Value Share and BPS Analysis by Therapy, 2025 and 2035
  • Figure 93: South Asia & Pacific Market Y-o-Y Growth Comparison by Therapy, 2025 to 2035
  • Figure 94: South Asia & Pacific Market Attractiveness Analysis by Therapy
  • Figure 95: South Asia & Pacific Market Value Share and BPS Analysis by Dosage Form, 2025 and 2035
  • Figure 96: South Asia & Pacific Market Y-o-Y Growth Comparison by Dosage Form, 2025 to 2035
  • Figure 97: South Asia & Pacific Market Attractiveness Analysis by Dosage Form
  • Figure 98: South Asia & Pacific Market Value Share and BPS Analysis by Species, 2025 and 2035
  • Figure 99: South Asia & Pacific Market Y-o-Y Growth Comparison by Species, 2025 to 2035
  • Figure 100: South Asia & Pacific Market Attractiveness Analysis by Species
  • Figure 101: South Asia & Pacific Market Value Share and BPS Analysis by Sales Channel, 2025 and 2035
  • Figure 102: South Asia & Pacific Market Y-o-Y Growth Comparison by Sales Channel, 2025 to 2035
  • Figure 103: South Asia & Pacific Market Attractiveness Analysis by Sales Channel
  • Figure 104: Middle East and Africa Market Value Share and BPS Analysis by Country, 2025 and 2035
  • Figure 105: Middle East and Africa Market Value Share and BPS Analysis by Therapy, 2025 and 2035
  • Figure 106: Middle East and Africa Market Y-o-Y Growth Comparison by Therapy, 2025 to 2035
  • Figure 107: Middle East and Africa Market Attractiveness Analysis by Therapy
  • Figure 108: Middle East and Africa Market Value Share and BPS Analysis by Dosage Form, 2025 and 2035
  • Figure 109: Middle East and Africa Market Y-o-Y Growth Comparison by Dosage Form, 2025 to 2035
  • Figure 110: Middle East and Africa Market Attractiveness Analysis by Dosage Form
  • Figure 111: Middle East and Africa Market Value Share and BPS Analysis by Species, 2025 and 2035
  • Figure 112: Middle East and Africa Market Y-o-Y Growth Comparison by Species, 2025 to 2035
  • Figure 113: Middle East and Africa Market Attractiveness Analysis by Species
  • Figure 114: Middle East and Africa Market Value Share and BPS Analysis by Sales Channel, 2025 and 2035
  • Figure 115: Middle East and Africa Market Y-o-Y Growth Comparison by Sales Channel, 2025 to 2035
  • Figure 116: Middle East and Africa Market Attractiveness Analysis by Sales Channel
  • Figure 117: Global Market - Tier Structure Analysis
  • Figure 118: Global Market - Company Share Analysis

Frequently Asked Questions

What is the projected size of the pet hypothyroidism therapy market by 2035?

The market is expected to reach USD 429.2 million by 2035.

What is the estimated market size of the pet hypothyroidism therapy market in 2025?

The market size is projected to be USD 216.2 million in 2025.

What is the CAGR of the pet hypothyroidism therapy market from 2025 to 2035?

The market is expected to grow at a CAGR of 4.3%.

What is the leading therapy segment in the pet hypothyroidism therapy market?

Levothyroxine sodium replacement therapy is expected to lead with a 49.7% market share in 2025.

Which country is expected to be the fastest growing in the pet hypothyroidism therapy market?

India is expected to be the fastest growing with a CAGR of 7.9%.

Explore Animal Health Therapeutics Insights

Future Market Insights

Pet Hypothyroidism Therapy Market