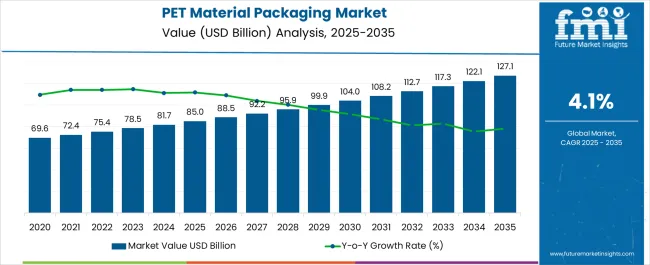
The PET Material Packaging Market is estimated to be valued at USD 85.0 billion in 2025 and is projected to reach USD 127.1 billion by 2035, registering a compound annual growth rate (CAGR) of 4.1% over the forecast period.

| Metric | Value |
|---|---|
| PET Material Packaging Market Estimated Value in (2025 E) | USD 85.0 billion |
| PET Material Packaging Market Forecast Value in (2035 F) | USD 127.1 billion |
| Forecast CAGR (2025 to 2035) | 4.1% |
The PET material packaging market is expanding steadily due to strong demand across food, beverage, personal care, and pharmaceutical industries. Growth is being driven by the material’s lightweight properties, recyclability, and ability to preserve product integrity. Current market conditions reflect heightened consumer preference for sustainable and safe packaging solutions, with PET positioned as a cost-effective alternative to glass and metal.
Regulatory emphasis on circular economy models and recycling targets is influencing industry practices, encouraging investments in advanced collection and reprocessing systems. The future outlook is supported by technological improvements in barrier coatings and lightweighting techniques, which enhance product performance while reducing material use.
Growth rationale is further strengthened by the global shift toward packaged and ready-to-consume goods, supported by expanding urbanization and retail penetration. Market participants are focusing on enhancing supply chain efficiency, introducing eco-friendly PET variants, and developing closed-loop systems to meet sustainability goals, ensuring consistent adoption and long-term market stability.

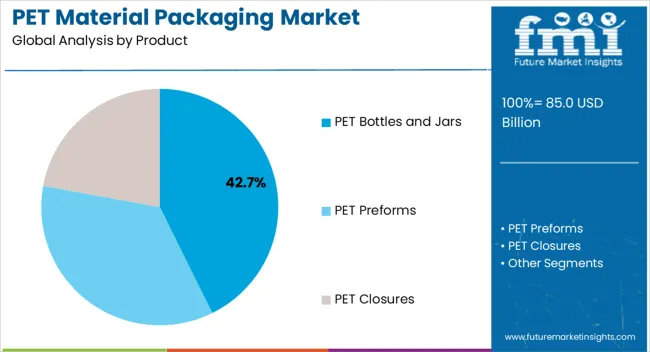
The PET bottles and jars segment, accounting for 42.7% of the product category, has established dominance owing to its widespread application in both carbonated and non-carbonated beverages, packaged food, and personal care items. Strong adoption has been reinforced by the material’s clarity, durability, and cost-effectiveness in mass production.
Recycling infrastructure advancements and improved collection rates have further enhanced the appeal of PET bottles and jars, aligning with global sustainability commitments. Manufacturing efficiency and the ability to produce lightweight yet durable packaging have provided additional advantages.
Continuous innovation in design, including resealable closures and tamper-evident features, is increasing consumer convenience. With food safety standards and extended shelf-life requirements being prioritized, this segment is expected to maintain its leadership while also benefiting from ongoing investments in recycled PET (rPET) integration across packaging supply chains..

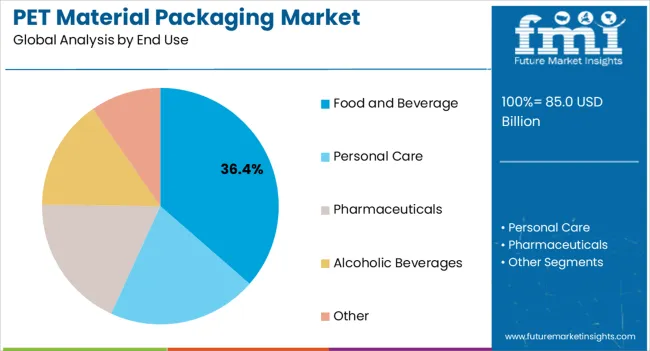
The food and beverage segment, holding 36.4% of the end-use category, has been leading demand due to PET’s superior protective and hygienic properties that preserve freshness and product quality. Expansion of ready-to-drink beverages, packaged water, and convenience foods has reinforced the preference for PET material, supported by its lightweight nature and ease of transport.
Consumer lifestyle changes, combined with the rapid expansion of modern retail channels, are sustaining adoption. Regulations favoring recyclable and food-grade materials are ensuring compliance and market trust.
Growth in emerging economies, where rising disposable incomes and urbanization are increasing consumption of packaged goods, is further strengthening the segment. With producers investing in sustainable packaging solutions and incorporating higher levels of rPET into food and beverage applications, this segment is projected to continue driving the market, ensuring both high-volume consumption and strategic focus from leading manufacturers.
The global PET material packaging market experienced substantial growth during the historical period from 2020 to 2025. The growth was influenced by various factors, including adopting PET material for packaging solutions across diverse industries.
In 2020, the market total valuation stood at USD 69.6 billion. Over the next four years, from 2020 to 2025, the market witnessed significant expansion, with the market value increasing to USD 122 billion. The remarkable growth was underpinned by the versatility and suitability of PET material for packaging applications, meeting regulatory requirements, and addressing environmental concerns.
During this period, the PET material packaging market responded to the increasing demand for sustainable and environmentally friendly solutions. The adoption of PET as a biodegradable material gained prominence, aligning with the industry focus on green plastics.
PET’s lightweight properties, coupled with its recyclability and reusability, contributed to its widespread adoption, especially as an alternative to traditional packaging materials like glass and metal.
The table below displays CAGRs in the five countries spearheaded by the United States, Canada, the United Kingdom, Germany, and India.
CAGRs from 2025 to 2035
| The United States | 2.1% |
|---|---|
| The United Kingdom | 3.7% |
| Germany | 2% |
| Canada | 3.8% |
| India | 6.3% |
The United States is expected to rise at a CAGR of 2.1% in the PET materials packaging market, driven by its vast manufacturing base and technological innovations. The country strong emphasis on green packaging solutions aligns with the global trend towards sustainability.
The growing population, increasing disposable incomes, and enhanced purchasing power of consumers will boost the demand for PET materials packaging in the United States. The need for lightweight, flexible, and easily transportable packaging solutions is expected to drive the growth of the PET materials packaging market.
Canada is expected to play a significant role in the PET materials packaging market, along with North America overall growth trajectory with a CAGR of 3.8% by 2035. The country commitment to eco-friendly packaging and sustainability aligns with the global drive towards responsible consumer practices.
The growth in Canada population, rising disposable incomes, and increased consumer purchasing power contribute to the rising demand for PET materials packaging. The packaging is lightweight, flexible, and has transport-friendly characteristics set further to bolster the PET materials packaging market in Canada.
The United Kingdom plays a pivotal role in Europe PET materials packaging market with a CAGR of 3.7%, showcasing a rapidly growing economy and a high standard of living. PET materials packaging has experienced significant growth in the United Kingdom, mainly driven by the increasing demand for bottled water.
The growing per capita population is a significant contributing factor to the growth of PET materials packaging on a global scale. Moreover, the efficient handling of solid waste, combined with the ease of transportation, results in lower shipping costs. These attributes are expected to propel PET materials packaging sales in the United Kingdom.
Germany is a key player in Europe PET materials packaging market, exemplifying the growth driven by a flourishing economy and high living standards with a CAGR of 2% through 2035. The country is witnessing a surge in demand for pharmaceuticals and personal care products, contributing to the overall growth of the PET materials packaging market in Europe.
Germany has invested in expanding its PET recycling infrastructure facilities, enhancing its commitment to sustainable packaging solutions. The nation efficient waste management practices, combined with its strategic location, support the growth of PET materials packaging in the German market. These factors make Germany significantly contribute to the European PET materials packaging landscape.
The PET materials packaging market in India is on a trajectory of substantial growth, holding a CAGR of 6.3% by 2035, driven by the country expanding population, rising disposable incomes, and increasing consumer purchasing power.
As the need for lightweight, flexible, and easily transportable packaging solutions gains prominence, PET materials packaging is becoming a preferred choice.
The growing demand for bottled water and other beverages further fuels the market expansion, as does the adoption of greener packaging practices. With an emerging economy and evolving consumer preferences, India PET materials packaging market is set to experience significant growth in the coming years.
The table below highlights how bottles and jars are projected to lead the product type market, expanding at a market share of 31.5% in 2025. The table further details how food and beverage is anticipated to witness a market share of 32.7% in 2025.
| Category | Market Share in 2025 |
|---|---|
| Bottles and Jars | 31.5% |
| Food and Beverage | 32.7% |
Bottles and jars are prominent packaging forms in the PET materials packaging market, holding a market share of 31.5% in 2025. PET (polyethylene terephthalate) is widely used to manufacture these containers, leveraging its lightweight, durable, and transparent properties.
PET bottles and jars are commonly employed for packaging various products, including beverages, personal care items, condiments, pharmaceuticals, and more. They are favored for their suitability for single-use and refillable applications, contributing to sustainability efforts.
PET bottles and jars are known for their versatility and cost-effectiveness, making them an essential component of the PET materials packaging market across various industries.
The food and beverages industry is a significant end-user segment in the PET materials packaging market, accounting for 32.7% in 2025. PET (polyethylene terephthalate) is extensively utilized for packaging various food and beverage products. PET containers are famous for bottling beverages such as water, soft drinks, juices, and alcoholic drinks due to their lightweight, transparency, and ability to retain the quality and taste of the contents.
They are also widely used for packaging food items like condiments, sauces, snacks, and dairy products. PET packaging offers benefits such as product visibility, convenience, and recyclability, aligning with consumer preferences and sustainability initiatives. As such, the food and beverages industry remains a key driver for the PET materials packaging market, ensuring the preservation and accessibility of consumable goods.

Many key PET material packaging manufacturers are inclined to invest significantly in innovation, research, and development practices to uncover increased applications of the PET material packaging market. With technology, players also focus on ensuring safety, quality, and customer satisfaction to captivate an increased customer base. Some of the latest developments include
| Attributes | Details |
|---|---|
| Estimated Market Size in 2025 | USD 81.7 billion |
| Projected Market Valuation in 2035 | USD 122 billion |
| CAGR Share from 2025 to 2035 | 4.1% |
| Forecast Period | 2025 to 2035 |
| Historical Data Available for | 2020 to 2025 |
| Market Analysis | Value in USD million |
| Key Regions Covered |
North America; Latin America; Western Europe; Eastern Europe; South Asia and Pacific; East Asia; The Middle East & Africa |
| Key Market Segments Covered |
Product, End Use, Region |
| Key Countries Profiled | The United States, Canada, Brazil, Mexico, Germany, The United Kingdom, France, Spain, Italy, Russia, Poland, Czech Republic, Romania, India, Bangladesh, Australia, New Zealand, China, Japan, South Korea, GCC countries, South Africa, Israel |
| Key Companies Profiled |
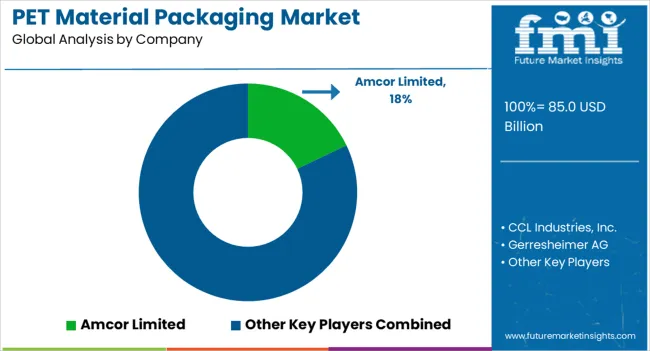
Amcor Limited; CCL Industries, Inc.; Gerresheimer AG; Smurfit Kappa Group PLC; Masterchem; PET Power; Berry Plastic Group Inc.; Resilux NV; GTX Hanex Plastic Sp. z o.o.; Klöckner Pentaplast GmbH & Co. KG.; PerPETual Global; Waipak; Loop Industries |
The global PET material packaging market is estimated to be valued at USD 85.0 billion in 2025.
The market size for the PET material packaging market is projected to reach USD 127.1 billion by 2035.
The PET material packaging market is expected to grow at a 4.1% CAGR between 2025 and 2035.
The key product types in PET material packaging market are PET bottles and jars, PET preforms and PET closures.
In terms of end use, food and beverage segment to command 36.4% share in the PET material packaging market in 2025.


Our Research Products

The "Full Research Suite" delivers actionable market intel, deep dives on markets or technologies, so clients act faster, cut risk, and unlock growth.

The Leaderboard benchmarks and ranks top vendors, classifying them as Established Leaders, Leading Challengers, or Disruptors & Challengers.

Locates where complements amplify value and substitutes erode it, forecasting net impact by horizon

We deliver granular, decision-grade intel: market sizing, 5-year forecasts, pricing, adoption, usage, revenue, and operational KPIs—plus competitor tracking, regulation, and value chains—across 60 countries broadly.

Spot the shifts before they hit your P&L. We track inflection points, adoption curves, pricing moves, and ecosystem plays to show where demand is heading, why it is changing, and what to do next across high-growth markets and disruptive tech

Real-time reads of user behavior. We track shifting priorities, perceptions of today’s and next-gen services, and provider experience, then pace how fast tech moves from trial to adoption, blending buyer, consumer, and channel inputs with social signals (#WhySwitch, #UX).

Partner with our analyst team to build a custom report designed around your business priorities. From analysing market trends to assessing competitors or crafting bespoke datasets, we tailor insights to your needs.
Supplier Intelligence
Discovery & Profiling
Capacity & Footprint
Performance & Risk
Compliance & Governance
Commercial Readiness
Who Supplies Whom
Scorecards & Shortlists
Playbooks & Docs
Category Intelligence
Definition & Scope
Demand & Use Cases
Cost Drivers
Market Structure
Supply Chain Map
Trade & Policy
Operating Norms
Deliverables
Buyer Intelligence
Account Basics
Spend & Scope
Procurement Model
Vendor Requirements
Terms & Policies
Entry Strategy
Pain Points & Triggers
Outputs
Pricing Analysis
Benchmarks
Trends
Should-Cost
Indexation
Landed Cost
Commercial Terms
Deliverables
Brand Analysis
Positioning & Value Prop
Share & Presence
Customer Evidence
Go-to-Market
Digital & Reputation
Compliance & Trust
KPIs & Gaps
Outputs
Full Research Suite comprises of:
Market outlook & trends analysis
Interviews & case studies
Strategic recommendations
Vendor profiles & capabilities analysis
5-year forecasts
8 regions and 60+ country-level data splits
Market segment data splits
12 months of continuous data updates
DELIVERED AS:
PDF EXCEL ONLINE
Competitive Overview of PET Material Packaging Market Share
PET Packaging Market Analysis - Growth & Forecast 2025 to 2035
BOPET Packaging Films Market Size and Share Forecast Outlook 2025 to 2035
Pet Food Packaging Industry Analysis in Europe - Size, Share, and Forecast 2025 to 2035
Pet Care Packaging Market Insights - Growth & Forecast 2025 to 2035
Packaging Materials Market Size and Share Forecast Outlook 2025 to 2035
Mono-material Packaging Market Analysis: Size, Share, and Forecast 2025 to 2035
Mono-material Packaging Film Market Trends & Growth Forecast 2024-2034
Recycled PET Packaging Market Size, Share & Forecast 2025 to 2035
Battery Packaging Material Market Size and Share Forecast Outlook 2025 to 2035
Recycled Materials Packaging Market Size and Share Forecast Outlook 2025 to 2035
Cigarette Packaging Material Market Size and Share Forecast Outlook 2025 to 2035
Semiconductor & IC Packaging Materials Market Size and Share Forecast Outlook 2025 to 2035
Compostable Plastic Packaging Material Market from 2025 to 2035
Pet Joint Health Supplement Market Size and Share Forecast Outlook 2025 to 2035
Pet Food Collagen Market Size, Share, Trends, and Forecast 2025 to 2035
Pet Cognitive Supplement Market Size and Share Forecast Outlook 2025 to 2035
Pet Food Pulverizer Market Size and Share Forecast Outlook 2025 to 2035
Pet Food Emulsifier Market Size and Share Forecast Outlook 2025 to 2035
PET Film for Face Shield Market Size and Share Forecast Outlook 2025 to 2035

Thank you!
You will receive an email from our Business Development Manager. Please be sure to check your SPAM/JUNK folder too.
Chat With
MaRIA