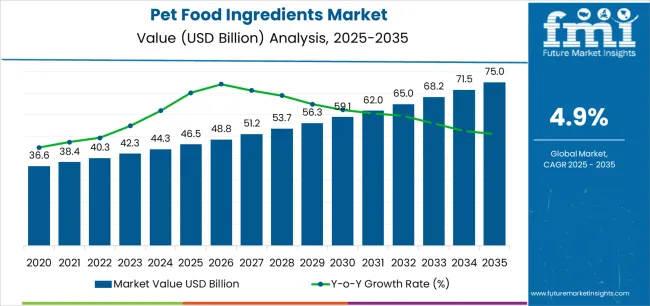
The pet food ingredients market stands at the threshold of a decade-long expansion trajectory that promises to reshape the companion animal nutrition industry and pet food manufacturing solutions. Based on Future Market Insights, recognized for packaging research supporting supply chain modernization, the market's journey from USD 46.5 billion in 2025 to USD 75.0 billion by 2035 represents substantial growth, demonstrating the accelerating adoption of advanced nutritional formulations and ingredient standardization across pet food facilities, manufacturing operations, and specialty nutrition sectors.
The first half of the decade (2025-2030) will witness the market climbing from USD 46.5 billion to approximately USD 58.7 billion, adding USD 12.2 billion in value, which constitutes 47% of the total forecast growth period. This phase will be characterized by the rapid adoption of functional ingredient systems, driven by increasing pet humanization trends and the growing need for specialized nutrition solutions worldwide. Enhanced processing capabilities and automated quality systems will become standard expectations rather than premium options.
The latter half (2030-2035) will witness continued growth from USD 58.7 billion to USD 75.0 billion, representing an addition of USD 16.3 billion or 53% of the decade's expansion. This period will be defined by mass market penetration of sustainable protein technologies, integration with comprehensive traceability platforms, and seamless compatibility with existing pet food processing infrastructure. The market trajectory signals fundamental shifts in how pet food facilities approach nutritional formulation and quality management, with participants positioned to benefit from growing demand across multiple ingredient types and application segments.
| Period | Revenue Bucket | Share (%) | Notes |
|---|---|---|---|
| Today | Commodity ingredients (grains, basic proteins) | 40% | Volume-led, pricing-driven |
| Standard meat meals & by-products | 25% | Margin compression, specification-driven | |
| Vitamins & minerals | 20% | Consistency & bioavailability critical | |
| Specialty additives | 15% | Premium positioning, functional formats | |
| Future (3–5 yrs) | Functional ingredients | 30–35% | Probiotics, prebiotics, joint health compounds |
| Sustainable proteins | 20–25% | Insect proteins, plant-based alternatives | |
| Personalized nutrition | 15–20% | Breed-specific, age-targeted formulas | |
| Clean-label solutions | 15–20% | Natural preservatives, organic ingredients | |
| Novel proteins | 10–15% | Cell-cultured meat, fermentation-derived | |
| Nutraceutical services | 5–10% | Health tracking, ingredient optimization |
| Metric | Value |
|---|---|
| Market Value (2025) | USD 46.5 billion |
| Market Forecast (2035) | USD 75.0 billion |
| Growth Rate (2025–2035) | 4.9% CAGR |
| Leading Technology | Starch-based Formulations |
| Primary Application | Dry Pet Food Manufacturing |
The market demonstrates strong fundamentals with starch-based ingredient systems capturing a dominant 31% share through advanced nutritional capabilities and formulation optimization. Dry pet food manufacturing applications drive primary demand, supported by increasing pet ownership and premiumization requirements. Geographic expansion remains concentrated in developed markets with established pet food processing infrastructure, while emerging economies show accelerating adoption rates driven by urbanization initiatives and rising disposable income for pet care solutions.
Design for nutrition, not just formulation
Primary Classification: The market segments by ingredient type into proteins, starches, vitamins & minerals, fats & oils, and additives, representing the evolution from basic animal nutrition to specialized formulation solutions for comprehensive pet health optimization.
Secondary Classification: Nature segmentation divides the market into conventional and organic sectors, reflecting distinct requirements for processing standards, environmental compliance, and consumer preference alignment.
Tertiary Classification: Form classification includes dry and wet ingredients, while functionality spans nutritional, functional, and sensory enhancement categories.
Quaternary Classification: Animal type segments cover dogs, cats, and other pets, while distribution channels include manufacturers, distributors, and direct sales platforms.
Regional Classification: Geographic distribution covers North America, Latin America, Western Europe, Eastern Europe, East Asia, South Asia Pacific, and Middle East & Africa, with developed markets leading adoption while emerging economies show accelerating growth patterns driven by expanding pet ownership.
The segmentation structure reveals technology progression from standard ingredient supply toward specialized nutritional systems with enhanced bioavailability and health benefit capabilities, while application diversity spans from mass-market kibble to prescription diet formulations requiring precise nutritional standards.
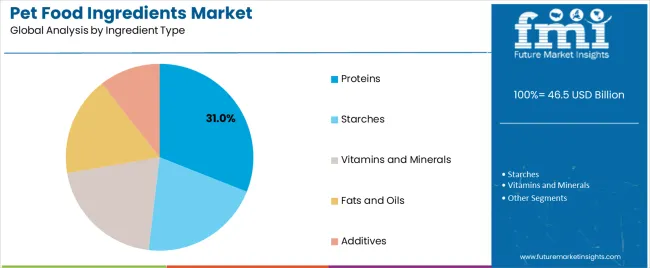
Market Position: Starch-based ingredients command the leading position with 31% market share (USD 14.4 billion in 2025) through essential binding properties, energy provision, and formulation optimization that enable pet food facilities to achieve optimal product consistency across diverse manufacturing and nutritional environments.
Value Drivers: The segment benefits from manufacturer preference for cost-effective systems that provide consistent texture performance, extrusion efficiency, and operational optimization without requiring significant infrastructure modifications. Advanced processing features enable automated quality control, nutritional consistency, and integration with existing pet food production lines, where operational performance and product reliability represent critical facility requirements.
Competitive Advantages: Starch ingredient systems differentiate through proven operational stability, consistent nutritional characteristics, and integration with automated manufacturing systems that enhance facility effectiveness while maintaining optimal quality standards suitable for diverse pet food applications.
Key market characteristics:
Protein ingredient systems maintain significant market position due to their essential nutritional properties and premium positioning advantages. These systems appeal to facilities requiring enhanced protein content with superior amino acid profiles for optimal pet health applications. Market growth is driven by premiumization trends, emphasizing high-quality protein sources and operational efficiency through optimized formulation designs.
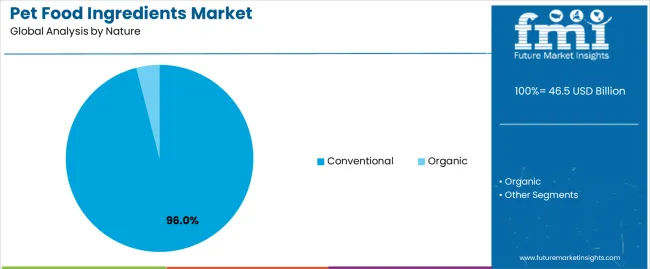
Market Context: Conventional ingredients dominate with 96% share (USD 44.6 billion in 2025) due to widespread adoption in cost-conscious markets and established processing infrastructure, particularly strong in Asia Pacific and North American regions where volume production drives procurement decisions.
Appeal Factors: Conventional ingredient operators prioritize cost efficiency, consistent supply availability, and integration with existing processing infrastructure that enables coordinated production across multiple manufacturing operations. The segment benefits from established agricultural supply chains and processing facilities that emphasize acquisition of conventional ingredients for standard pet food applications.
Growth Drivers: Volume-based procurement programs incorporate conventional ingredients as standard components for pet food operations, while expanding manufacturing increases demand for cost-effective nutritional capabilities that comply with regulatory standards.
Market Challenges: Growing consumer preference for organic and natural products may limit long-term growth potential in premium market segments.
Application dynamics include:
Organic ingredient applications capture growing market share through premium positioning in health-conscious markets, particularly in North America and Western Europe. These markets demand certified organic systems capable of meeting strict processing standards while providing traceable supply chain capabilities and environmental sustainability features.
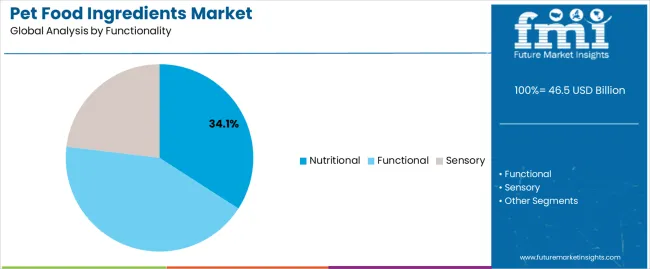
Market Position: Health and nutritional applications lead the market with 34.1% share, representing the largest functionality segment due to extensive health optimization and preventive nutrition requirements across life-stage formulations.
Growth Drivers: Pet humanization trends, veterinary recommendations, and consumer demand for functional nutrition drive demand for specialized ingredient solutions across commercial and premium pet food production facilities.
Application Scope: Health applications span joint support, digestive health, immune enhancement, and cognitive function requiring precise ingredient combinations and bioavailability features.
| Category | Factor | Impact | Why It Matters |
|---|---|---|---|
| Driver | Pet humanization | ★★★★★ | Premium nutrition demand requires human-grade, functional ingredients across production facilities, driving premiumization. |
| Driver | Health & preventive care | ★★★★★ | Nutrition shifts from “feeding” to “wellness”; functional ingredients enable premium positioning. |
| Driver | Supply chain diversification | ★★★★☆ | Ingredient innovation and technology reduce procurement inefficiency, complexity, and single-source dependency. |
| Restraint | Price volatility | ★★★★☆ | Agricultural and raw material dependency causes supply disruptions and raises procurement risks. |
| Restraint | Regulatory complexity | ★★★☆☆ | Varying pet food regulations and ingredient approval processes restrict innovation and slow global rollout. |
| Trend | Sustainable proteins | ★★★★★ | Insect-based, plant-forward, and alternative proteins shift competition toward sustainability-driven differentiation. |
| Trend | Personalization & customization | ★★★★☆ | Breed-specific, age-targeted, and health-condition formulations emerge as critical differentiators for brands. |
The market demonstrates varied regional dynamics with Growth Leaders including India (8.0% growth rate) and China (7.4% growth rate) driving expansion through rising pet ownership and increasing premiumization. Steady Performers encompass United States (4.1% growth rate), United Kingdom (4.5% growth rate), and developed regions, benefiting from established pet food industries and functional ingredient adoption. Emerging Markets feature Canada (4.2% growth rate) and developing regions, where pet humanization trends and nutritional awareness support consistent growth patterns.
Regional synthesis reveals Asian markets leading adoption through urbanization and disposable income growth, while North American countries maintain steady expansion supported by innovation advancement and quality standardization requirements. European markets show moderate growth driven by sustainable applications and clean-label integration trends.
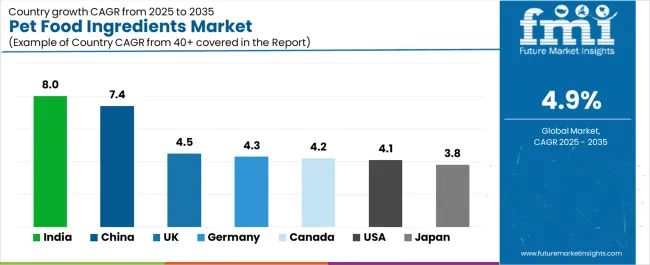
| Region / Country | CAGR (2025–2035) | How to Win | What to Watch Out |
|---|---|---|---|
| India | 8.0% | Focus on affordability and quality variance; develop local protein sources | Supply base gaps; infrastructure challenges |
| China | 7.4% | Lead with premiumization trends; build on functional and sustainable positioning | Regulatory shifts; heavy import dependency |
| United States | 4.1% | Emphasize functional ingredients and wellness positioning | Margin pressure; retail consolidation |
| United Kingdom | 4.5% | Focus on sustainable solutions; highlight eco-friendly formulations | Brexit trade impacts; higher supply chain costs |
| Germany | 4.3% | Position on technical excellence and premium certification | Over-specification; slower adoption cycles |
| Japan | 3.8% | Target senior pet nutrition and specialized formulations | Market saturation; aging demographics |
| Canada | 4.2% | Leverage natural & organic positioning; align with clean-label demand | Currency fluctuations; reliance on USA trade influence |
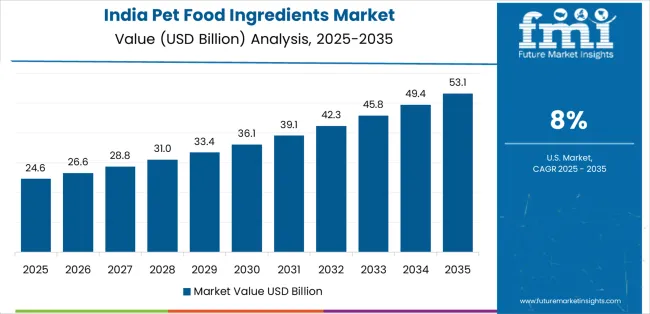
India establishes fastest market growth through aggressive pet adoption expansion and comprehensive pet food industry development, integrating specialized ingredients as standard components in pet nutrition and health applications. The country's 8.0% growth rate reflects growing middle-class pet ownership and domestic manufacturing capabilities that drive demand for ingredient systems in pet food facilities. Growth concentrates in major metropolitan centers, including Mumbai, Delhi, and Bangalore, where pet food manufacturing showcases integrated nutritional systems that appeal to manufacturers seeking quality capabilities and health management applications.
Indian processors are developing cost-effective ingredient solutions that combine agricultural advantages with nutritional capabilities, including protein diversification and enhanced bioavailability features. Distribution channels through pet food manufacturers and feed processors expand market access, while growing pet humanization supports adoption across diverse premium and functional segments.
Strategic Market Indicators:
In Beijing, Shanghai, and Shenzhen, pet food facilities and manufacturing plants are implementing specialized ingredients as standard components for nutritional optimization and production efficiency applications, driven by increasing pet ownership and premiumization programs. The market holds a 7.4% growth rate, supported by expanding pet industry and manufacturing development programs that promote ingredient adoption for nutritional excellence. Chinese operators are adopting ingredient systems that provide consistent quality performance and health benefit features, particularly appealing in urban regions where pet health and nutrition standards represent critical consumer requirements.
Market expansion benefits from growing processing technology capabilities and international quality certification programs that enable domestic production of standardized ingredient systems for pet food applications. Technology adoption follows patterns established in human food processing, where quality and safety drive procurement decisions and operational deployment.
Market Intelligence Brief:
United States establishes market leadership through comprehensive pet food industry infrastructure and advanced nutritional technology development, integrating specialized ingredients across pet food applications. The country's 4.1% growth rate reflects established industry relationships and mature ingredient technology adoption that supports widespread use of functional nutritional systems in manufacturing facilities. Growth concentrates in major pet food processing centers, including Missouri, Ohio, and California, where processing technology showcases mature ingredient deployment that appeals to manufacturers seeking proven nutritional capabilities and operational efficiency applications.
American ingredient providers leverage established distribution networks and comprehensive quality capabilities, including nutritional certification programs and technical support that create customer relationships and operational advantages. The market benefits from mature FDA regulations and AAFCO standards that support ingredient use while advancing technology development and formulation optimization.
Market Intelligence Brief:
United Kingdom's advanced pet food market demonstrates sophisticated ingredient deployment with documented sustainability effectiveness in pet food applications and manufacturing facilities through integration with existing quality systems and environmental infrastructure. The country leverages consumer awareness in sustainable nutrition and clean-label integration to maintain a 4.5% growth rate. Processing centers, including England, Scotland, and Wales, showcase premium installations where ingredient systems integrate with comprehensive sustainability platforms and traceability management systems to optimize nutritional delivery and environmental effectiveness.
British processors prioritize sustainability and transparency in ingredient development, creating demand for premium systems with advanced features, including carbon footprint tracking and ethical sourcing certification. The market benefits from established pet food infrastructure and willingness to invest in sustainable ingredient technologies that provide long-term market benefits and compliance with environmental standards.
Market Intelligence Brief:
Germany's market expansion benefits from technical precision in pet nutrition, including advanced formulation capabilities, processing facility sophistication, and quality-oriented infrastructure that positions the country as a premium ingredient innovator. The country maintains a 4.3% growth rate, driven by technical advantages and increasing quality sophistication, including advanced nutritional technology and bioavailability optimization systems.
Market dynamics focus on leveraging technical advantages while addressing cost challenges that affect mass-market competitiveness and price-sensitive distribution channels. Growing nutritional specialization creates continued demand for precision ingredient systems in facility upgrades and product innovation projects.
Strategic Market Considerations:
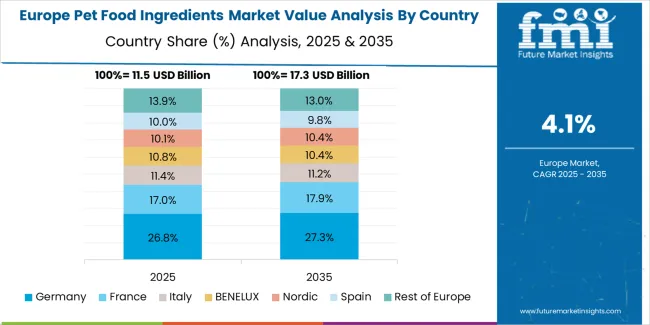
The European pet food ingredients market is projected to grow from USD 11.2 billion in 2025 to USD 17.3 billion by 2035, registering a CAGR of 4.4% over the forecast period. Germany is expected to maintain its leadership position with a 26.8% market share in 2025, supported by its advanced pet food processing infrastructure and technical standardization systems.
United Kingdom follows with a 24.2% share in 2025, driven by comprehensive sustainability programs and premium ingredient initiatives. France holds a 20.5% share through specialized nutritional applications and quality certification requirements. Italy commands a 13.8% share, while Spain accounts for 7.9% in 2025. The Rest of Europe region is anticipated to gain momentum, expanding its collective share from 6.8% to 7.5% by 2035, attributed to increasing premium adoption in Nordic countries and emerging functional segments in smaller markets.
| Stakeholder | Typical Strengths | What They Actually Control | Typical Blind Spots |
|---|---|---|---|
| Global suppliers | Supply chain reach, deep processing capacity, proven reliability, nutritional labs, multi-region sourcing | Consistent quality, processing innovation, application support | Agricultural dependency risk; climate vulnerability |
| Regional specialists | Local sourcing, custom formulations, proximity to processors, flexible response | Quick adaptation to local demand; niche market service | Scale limitations; export barriers |
| Sustainable protein players | Alternative proteins, traceable sourcing, clean processing, sustainability credentials | Premium positioning in eco-conscious segments | Yield pressures; scaling & environmental challenges |
| Innovation leaders | Functional ingredients, bioavailability tech, strong R&D, application support | Higher-margin differentiated formulations | Production complexity; regulatory approval hurdles |
| Private label suppliers | Cost efficiency, bulk processing, flexible specifications, competitive pricing | Volume economics, affordability for mass brands | Weak brand value; margin compression risks |
| Item | Value |
|---|---|
| Quantitative Units | USD 46.5 billion (2025 baseline) |
| Ingredient Type | Proteins, Starches, Vitamins & Minerals, Fats & Oils, Additives |
| Nature | Conventional, Organic |
| Form | Dry, Wet |
| Functionality | Nutritional, Functional, Sensory |
| Animal Type | Dogs, Cats, Others |
| Distribution Channel | Manufacturers, Distributors, Direct Sales |
| Regions Covered | North America, Latin America, Western Europe, Eastern Europe, East Asia, South Asia Pacific, Middle East & Africa |
| Countries Covered | United States, China, Germany, India, United Kingdom, Japan, Canada, Brazil, France, Italy, +25 additional countries |
| Key Companies | ADM, Cargill, DSM Nutritional Products, Kerry Group, Ingredion, BASF, Roquette Frères, Darling Ingredients |
| Additional Attributes | Dollar sales by ingredient & nature categories; regional adoption trends (Asia Pacific, North America, Western Europe); competitive landscape (ingredient processors & pet food manufacturers); manufacturer preferences for nutritional consistency & supply reliability; integration with pet food production & quality systems; innovations in functional ingredients & sustainable proteins; personalized nutrition solutions with traceability & health optimization |
The global pet food ingredients market is estimated to be valued at USD 46.5 billion in 2025.
The market size for the pet food ingredients market is projected to reach USD 75.0 billion by 2035.
The pet food ingredients market is expected to grow at a 4.9% CAGR between 2025 and 2035.
The key product types in pet food ingredients market are conventional and organic.
In terms of functionality, nutritional segment to command 34.1% share in the pet food ingredients market in 2025.


Full Research Suite comprises of:
Market outlook & trends analysis
Interviews & case studies
Strategic recommendations
Vendor profiles & capabilities analysis
5-year forecasts
8 regions and 60+ country-level data splits
Market segment data splits
12 months of continuous data updates
DELIVERED AS:
PDF EXCEL ONLINE
Pet Tick and Flea Prevention Market Forecast and Outlook 2025 to 2035
Pet Hotel Market Forecast and Outlook 2025 to 2035
PET Vascular Prosthesis Market Size and Share Forecast Outlook 2025 to 2035
Petroleum Liquid Feedstock Market Size and Share Forecast Outlook 2025 to 2035
PET Stretch Blow Molding Machines Market Size and Share Forecast Outlook 2025 to 2035
PET Injectors Market Size and Share Forecast Outlook 2025 to 2035
PET Material Packaging Market Size and Share Forecast Outlook 2025 to 2035
Petri Dishes Market Size and Share Forecast Outlook 2025 to 2035
Petroleum And Fuel Dyes and Markers Market Size and Share Forecast Outlook 2025 to 2035
Petrochemical Pumps Market Size and Share Forecast Outlook 2025 to 2035
PET Dome Lids Market Size and Share Forecast Outlook 2025 to 2035
Pet Dietary Supplement Market Size and Share Forecast Outlook 2025 to 2035
PET Imaging Workflow Market Analysis - Size, Share, and Forecast Outlook 2025 to 2035
Petroleum Refinery Merchant Hydrogen Generation Market Size and Share Forecast Outlook 2025 to 2035
Pet Bird Health Market Size and Share Forecast Outlook 2025 to 2035
PET Film Coated Steel Coil Market Size and Share Forecast Outlook 2025 to 2035
Petroleum Refinery Hydrogen Market Size and Share Forecast Outlook 2025 to 2035
Pet Collagen Treats Market Analysis - Size and Share Forecast Outlook 2025 to 2035
Pet Blood Pressure Monitoring Devices Market Size and Share Forecast Outlook 2025 to 2035
Petroleum Refining Hydrogen Generation Market Size and Share Forecast Outlook 2025 to 2035

Thank you!
You will receive an email from our Business Development Manager. Please be sure to check your SPAM/JUNK folder too.
Chat With
MaRIA