Reports

- Global Locations -

Headquarters

Future Market Insights, Inc.

Christiana Corporate, 200
Continental Drive, Suite 401,
Newark, Delaware - 19713,
United States

T: +1-845-579-5705

Americas

Future Market Insights, Inc.

616 Corporate Way, Suite 2-9018,
Valley Cottage, NY 10989, United States

T: +1-347-918-3531

MEA

Future Market Insights

1602-6 Jumeirah Bay X2 Tower, Plot No: JLT-PH2-X2A,
Jumeirah Lakes Towers, Dubai,
United Arab Emirates

Europe

Future Market Insights

3rd Floor, 207 Regent Street,
W1B 3HH London
United Kingdom

T: + 44 (0) 20 8123 9659
D: +44 (0) 20 3287 4268

Asia Pacific

Future Market Insights

IndiaLand Global Tech Park, Unit UG-1, Behind Grand HighStreet, Phase 1, Hinjawadi, MH, Pune – 411057, India

Wet Pet Food Market Outlook (2023 to 2033)

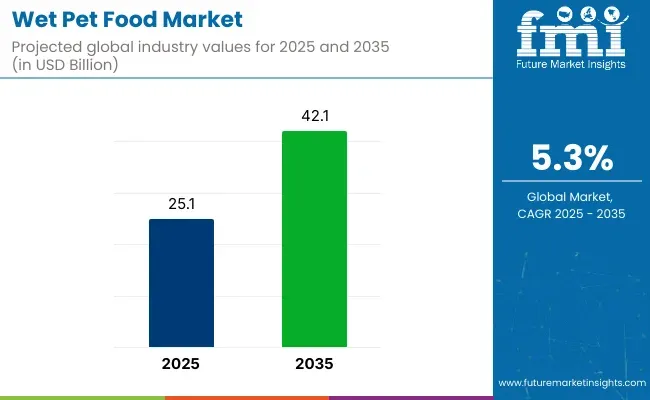
The global wet pet food market size is estimated to be valued at US$ 22.6 billion in 2023. Furthermore, with the rising adoption of pets worldwide, the overall demand for wet pet food is poised to grow at a steady CAGR of 5.5% between 2023 to 2033, totaling a market valuation of US$ 37.7 billion by 2033.

Wet pet food sales accounted for 19.2% of the overall pet food market, which was valued at US$ 22.6 billion by 2023 end. Rising sales of wet pet food can be attributed to the shifting preference of owners toward giving wet pet foods to their companion animals.

Wet pet food contains higher water content (around 70-80%), so it is the softest of the three forms. It is generally prepared by grinding the protein sources or meat ingredients. Then a gravy that contains minerals, vitamins, and grains is added. And finally, after mixing, the food is cooked and sterilized to produce the canned product.

Over the years, demand for wet food has risen at a healthy pace due to rising consumer awareness about its various advantages. Wet food has a higher moisture content, so it can help pets stay hydrated and avoid urinary tract infections. Similarly, wet pet foods contain lower carbohydrate content and can thus prevent weight gain in pets.

The growing adoption of wet pet food due to its various advantages over dry pet food will continue to bolster wet pet food sales over the next decade.

Attribute Key Statistics
Wet Pet Food Market Estimated Size (2023E) US$ 22.6 billion
Projected Market Size (2033F) US$ 37.7 billion
Value-based CAGR (2023 to 2033) 5.5%
Top 3 Countries' Market Share 35.8%

Don't pay for what you don't need

Customize your report by selecting specific countries or regions and save 30%!

2018 to 2022 Wet Pet Food Market Outlook Compared to 2023 to 2033 Forecast

The global wet pet food market is anticipated to grow at a CAGR of 5.5% between 2023 and 2033, in comparison to the 3.7% CAGR registered during the historical period from 2018 to 2022. The surge in pet adoption rates, changing preference towards wet pet foods due to their various benefits, and continuous new product launches are key factors driving demand for wet pet foods in the market.

Today, providing high-quality, healthy food for pets has become one of the most important responsibilities for pet owners. This is what motivates people to experiment with various forms of food for their pets, ranging from dry to chewable and wet food.

Wet pet food has many advantages over dry pet food, including more variety, high water content, low carbs, and soft nature. It is an ideal food choice for overweight pets or having difficulty chewing hard kibble due to dental problems or illness.

One of the main reasons for spurring wet pet food sales is an increase in pet adoption in high-income nations. People today are inclined towards having pets like a dog or cat due to healthy and mood-boosting benefits. Various studies have revealed that pets can reduce stress, anxiety, and depression, ease loneliness, and encourage exercise and playfulness.

What are the Key Trends Driving the Wet Pet Food Market?

Rising Demand for Nutritious Foods Propelling Sales of Wet Pet Food

The urge of pet owners to purchase premium quality products for their pets in order to assure optimal nutrition and care is a major factor driving the wet pet food market. The market is anticipated to grow as the number of nuclear families and couples who own pets rises. These pet owners adopt animals and treat them as if they were their children.

Wet pet food delivers nourishment, good health, and protein to pets, thereby allowing them to live longer and better lives. Furthermore, the market for wet pet food is being driven by an increase in disposable money.

Pet food demand is gradually increasing, presenting a substantial opportunity for the worldwide wet pet food industry. Furthermore, because wet pet food is soft, an increase in dental difficulties among pets will encourage pet owners to feed wet pet foods to their companion animals. This will boost wet pet food sales during the assessment period.

Nandini Roy Choudhury

Principal Consultant

Talk to Analyst

Find your sweet spots for generating winning opportunities in this market.

Country-wise Insights

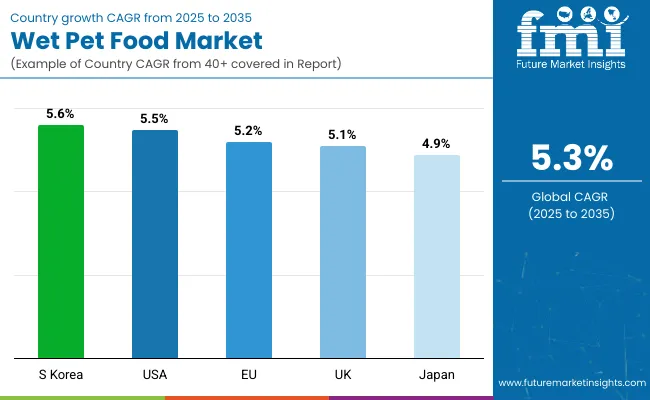
Why are the Sales of Wet Pet Food in the United States Rising at a Robust Pace?

Rising Trend of Pet Humanization Favoring Wet Pet Food Market Growth in the United States.

The growth of the wet pet food market in the USA can be ascribed to the rise in pet ownership and the growing trend of pet humanization, in which pets are given more attention and hygiene.

High-quality ingredients are essential for pet owners in the USA As consumers become increasingly sensitive about their pets' health, demand for wet pet food is expected to grow substantially.

Furthermore, the presence of some of the world’s leading wet pet food manufacturers in the country is positively impacting wet pet food market growth, and the trend is likely to continue during the forecast period.

Which Factors are Pushing Demand for Wet Pet Food in China?

Rise in Pet Adoption Rates Propelling Wet Pet Food Sales in China

Dogs are the most popular pets worldwide, contributing a significant portion of the revenue generated by the Chinese pet food sector.

With almost 27 million dogs as pets, China ranked third in the world regarding dog ownership in 2020. The second most popular pets were cats and birds, accounting for considerable revenue. This surge in pet animal rates is boosting wet pet food sales in the country.

Similarly, animal humanization, the rising number of e-commerce platforms, and the growing demand for natural pet food that is beneficial for animals are the top factors driving the wet pet food market in the country.

Why is India Emerging as a Promising Wet Pet Food Market?

Growing Focus towards Improving Pet Health Shaping Market Growth in India

East Asia accounts for a significant amount of the overall wet pet food demand because the number of pet owners in this region is higher than in other parts of the world. Countries like India are the reason for the region's ever-increasing pet population.

Over the years, there has been a rapid increase in pet food demand across India due to factors like expanding pet population, a rising focus on improving pet health, and a surge in pet food startups. As wet pet food offers several health benefits, it is being chosen over other forms of wet pet food. This will continue to drive growth in the Indian wet pet food market over the next ten years.

Category-wise Insights

Which Pet Type is Likely to Propel the Sales of Wet Pet Food?

Rising Adoption of Dogs as Pets Fueling Wet Pet Food Sales

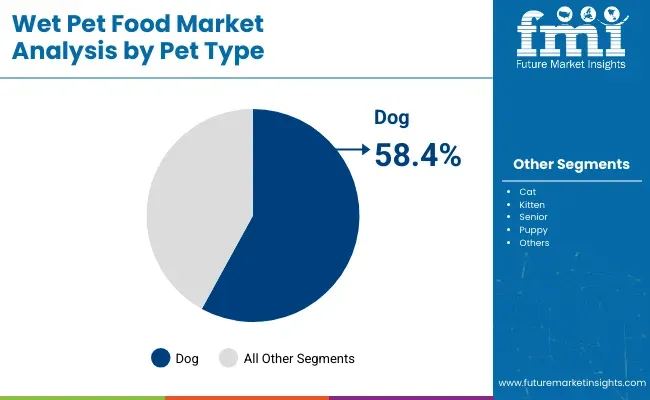
Over the projection period, dogs, particularly pups with no teeth, are expected to bolster sales of wet pet food in the market. This can be attributed to the rising adoption of dogs as pets and growing awareness about dog health.

Leading producers are developing wet pet food targeted to these dogs' nutritional demands to acquire a major share of the overall market. Furthermore, companies have increased their output of wet pet food aimed specifically at dogs in response to rising customer demand for luxury dog food items and the readiness of these dog parents to pay higher costs. This will continue to stimulate the growth of the dog segment in the market during the forecast period.

How is Organic Packaged Wet Pet Food Contributing Towards Sales?

Growing Preference Towards Organic Products to Spur Sales of Organic Wet Pet Foods

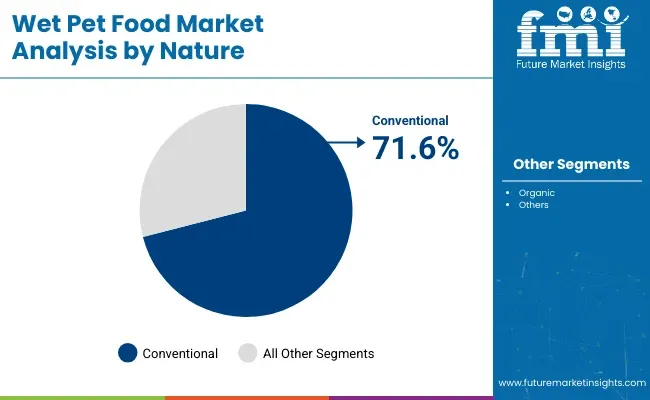
As pet owners are deeply concerned about their animals' well-being, they continuously spend large amounts on highly nutritious pet meals. Customers are demanding more specialized pet food, resulting in a rise in global organic wet pet food manufacturing.

Organic and natural foods are becoming more popular among pet owners, as these foods are free from hazardous ingredients. They want their pet foods to be free of preservatives, artificial colors and flavors, synthetic hormones, pesticides, and antibiotics. To capitalize on the current market trend, manufacturers are creating a variety of brands with a wide range of organic products.

Get the data you need at a Fraction of the cost

Personalize your report by choosing insights you need
and save 40%!

Competitive Landscape

Due to rising customer demand and increasing disposable income, a growing number of companies are entering the wet pet food market. In order to capitalize and improve their revenue share, wet pet food manufacturers are innovating to bring a new line of items to their inventory. Besides this, they are adopting strategies such as partnerships, acquisitions, mergers and establishing new manufacturing and distribution facilities. For instance,

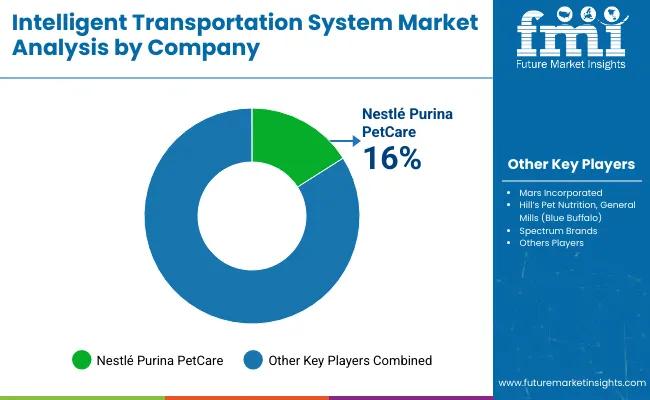
Lily's Kitchen, the UK's leading maker of quality dry and wet natural foods for cats and dogs, was acquired by Nestlé Purina PetCare. Nestle will benefit from the deal as it expands its operations in areas such as the Middle East and Asia.

In 2023, Dogs Plate, a Polish pet food company, introduced a new range of wet dog food products with insect protein.

Recent Development

  • Hill's Science Diet and Hill's Prescription Diet are prominent wet pet food brands from Hill's Pet Nutrition. They specialize in veterinary-recommended formulas, addressing specific dietary requirements and health conditions in pets.
  • Blue Buffalo provides a range of wet pet food options, including BLUE Homestyle Recipe and BLUE Wilderness. They focus on high-quality ingredients and natural recipes, catering to pet owners seeking holistic, grain-free alternatives.

Key Companies Profiled

  • PURINA
  • MONGE SPA
  • Blue Buffalo Co., Ltd.
  • Harringtons Foods
  • Wellness
  • PetGuard
  • C&D Foods
  • Darling Ingredients Inc.
  • Simmons Pet Food
  • NaturPak Pet
  • Others

PURINA and Blue Buffalo Co., Ltd. Emerging as Leading Wet Pet Food Giants

Proper nutrition is essential for all pets, and choosing the right food can be overwhelming. Pet owners must decide whether to feed their pets dry food or wet food.

Many dog owners prefer dry food for its affordable price and convenience, while others choose wet pet food on account of its various potential health benefits. However, with a rising focus on pet health due to pet humanization, there has been a sharp rise in the consumption of wet pet foods.

Wet pet foods are more appetizing than kibble to most pets. They contain higher moisture content and tend to be lower in carbohydrates and higher in protein than dry foods. As a result, wet pet foods are gaining immense popularity among owners.

Several companies are shifting their preference towards the wet pet food business as demand for these products continues to surge. Of those, PURINA and Blue Buffalo Co. Ltd. are set to remain at the forefront in pet wet food.

PURINA is offering a wide range of wet pet food products to meet the rising end user demand. The company is continuously striving to develop innovative wet pet food offering with high nutritional content. For instance, in November 2020, Nestle Purina launched new pet food with plant and insect proteins.

Similarly, PURINA is experimenting with wet pet food packaging to reduce environmental impact, expand its customer base, and comply with government regulations. For instance, in September 2020, the company introduced the world’s first recyclable flexible pouch for wet pet food.

Another company that has become a leading wet pet food giant is Blue Buffalo Co., Ltd. General Mills acquired the company in April 2018. Since then, it has significantly improved its customer base, especially in nations like the USA As per General Mills’ official report, Blue Buffalo hit double-digit net sales growth for both dog and cat food.

The company recently launched the Tastefuls line of wet cat food, available in three cuts, including pate, flaked entrees, and tender morsels.

Wet Pet Food Market by Category

By Pet Type:

  • Cat
  • Kitten
  • Senior
  • Dog
  • Puppy
  • Adult
  • Senior
  • Others

By Nature:

  • Organic
  • Conventional
  • By Source:
  • Animal Derived
  • Plant Derived
  • Insect Derived

By Sales Channel:

  • Offline Sales Channel
  • Supermarkets/Hypermarkets
  • Pet Stores
  • Convenience Store
  • Other Sales Channel
  • Online Sales Channel
  • Company Website
  • E-commerce Platform

By Region:

  • North America
  • Latin America
  • Europe
  • East Asia
  • South Asia
  • Oceania
  • Middle East and Africa

Frequently Asked Questions

What is the Current Performance Status of the Wet Pet Food Market?

The wet pet food market is valued at US$ 22.6 billion in 2023.

What is the Projected Size for the Wet Pet Food Market?

The global wet pet food market is projected to reach a valuation of US$ 37.7 billion by 2033.

What is the Growth Potential of the Wet Pet Food Market?

The growth potential of the wet pet food market is 5.5% through 2033

How was the Historical Performance of the Wet Pet Food Market?

During 2018 to 2022, the wet pet food market registered a CAGR of 3.7%.

What Trends are Driving Innovation in the Wet Pet Food Market?

Prominent trends involve organic, natural ingredients, grain-free formulations, and novel proteins to match evolving pet dietary choices.

Table of Content

1. Executive Summary

    1.1. Global Market Outlook

    1.2. Demand-side Trends

    1.3. Supply-side Trends

    1.4. Technology Roadmap Analysis

    1.5. Analysis and Recommendations

2. Market Overview

    2.1. Market Coverage / Taxonomy

    2.2. Market Definition / Scope / Limitations

3. Market Background

    3.1. Market Dynamics

        3.1.1. Drivers

        3.1.2. Restraints

        3.1.3. Opportunity

        3.1.4. Trends

    3.2. Scenario Forecast

        3.2.1. Demand in Optimistic Scenario

        3.2.2. Demand in Likely Scenario

        3.2.3. Demand in Conservative Scenario

    3.3. Opportunity Map Analysis

    3.4. Product Life Cycle Analysis

    3.5. Supply Chain Analysis

        3.5.1. Supply Side Participants and their Roles

            3.5.1.1. Producers

            3.5.1.2. Mid-Level Participants (Traders/ Agents/ Brokers)

            3.5.1.3. Wholesalers and Distributors

        3.5.2. Value Added and Value Created at Node in the Supply Chain

        3.5.3. List of Raw Material Suppliers

        3.5.4. List of Existing and Potential Buyer’s

    3.6. Investment Feasibility Matrix

    3.7. Value Chain Analysis

        3.7.1. Profit Margin Analysis

        3.7.2. Wholesalers and Distributors

        3.7.3. Retailers

    3.8. PESTLE and Porter’s Analysis

    3.9. Regulatory Landscape

        3.9.1. By Key Regions

        3.9.2. By Key Countries

    3.10. Regional Parent Market Outlook

    3.11. Production and Consumption Statistics

    3.12. Import and Export Statistics

4. Global Market Analysis 2018 to 2022 and Forecast, 2023 to 2033

    4.1. Historical Market Size Value (US$ Million) & Volume (Units) Analysis, 2018 to 2022

    4.2. Current and Future Market Size Value (US$ Million) & Volume (Units) Projections, 2023 to 2033

        4.2.1. Y-o-Y Growth Trend Analysis

        4.2.2. Absolute $ Opportunity Analysis

5. Global Market Analysis 2018 to 2022 and Forecast 2023 to 2033, By Pet Type

    5.1. Introduction / Key Findings

    5.2. Historical Market Size Value (US$ Million) & Volume (Units) Analysis By Pet Type, 2018 to 2022

    5.3. Current and Future Market Size Value (US$ Million) & Volume (Units) Analysis and Forecast By Pet Type, 2023 to 2033

        5.3.1. Cat

            5.3.1.1. Kitten

            5.3.1.2. Senior

        5.3.2. Dog

            5.3.2.1. Puppy

            5.3.2.2. Adult

            5.3.2.3. Senior

        5.3.3. Others

    5.4. Y-o-Y Growth Trend Analysis By Pet Type, 2018 to 2022

    5.5. Absolute $ Opportunity Analysis By Pet Type, 2023 to 2033

6. Global Market Analysis 2018 to 2022 and Forecast 2023 to 2033, By Nature

    6.1. Introduction / Key Findings

    6.2. Historical Market Size Value (US$ Million) & Volume (Units) Analysis By Nature, 2018 to 2022

    6.3. Current and Future Market Size Value (US$ Million) & Volume (Units) Analysis and Forecast By Nature, 2023 to 2033

        6.3.1. Organic

        6.3.2. Conventional

    6.4. Y-o-Y Growth Trend Analysis By Nature, 2018 to 2022

    6.5. Absolute $ Opportunity Analysis By Nature, 2023 to 2033

7. Global Market Analysis 2018 to 2022 and Forecast 2023 to 2033, By Source

    7.1. Introduction / Key Findings

    7.2. Historical Market Size Value (US$ Million) & Volume (Units) Analysis By Source, 2018 to 2022

    7.3. Current and Future Market Size Value (US$ Million) & Volume (Units) Analysis and Forecast By Source, 2023 to 2033

        7.3.1. Animal Derived

        7.3.2. Plant Derived

        7.3.3. Insect Derived

    7.4. Y-o-Y Growth Trend Analysis By Source, 2018 to 2022

    7.5. Absolute $ Opportunity Analysis By Source, 2023 to 2033

8. Global Market Analysis 2018 to 2022 and Forecast 2023 to 2033, By Sales Channel

    8.1. Introduction / Key Findings

    8.2. Historical Market Size Value (US$ Million) & Volume (Units) Analysis By Sales Channel, 2018 to 2022

    8.3. Current and Future Market Size Value (US$ Million) & Volume (Units) Analysis and Forecast By Sales Channel, 2023 to 2033

        8.3.1. Offline

            8.3.1.1. Supermarkets/Hypermarkets

            8.3.1.2. Pet Stores

            8.3.1.3. Convenience Store

            8.3.1.4. Other Sales Channel

        8.3.2. Online

            8.3.2.1. Company Website

            8.3.2.2. E-commerce Platform

    8.4. Y-o-Y Growth Trend Analysis By Sales Channel, 2018 to 2022

    8.5. Absolute $ Opportunity Analysis By Sales Channel, 2023 to 2033

9. Global Market Analysis 2018 to 2022 and Forecast 2023 to 2033, By Region

    9.1. Introduction

    9.2. Historical Market Size Value (US$ Million) & Volume (Units) Analysis By Region, 2018 to 2022

    9.3. Current Market Size Value (US$ Million) & Volume (Units) Analysis and Forecast By Region, 2023 to 2033

        9.3.1. North America

        9.3.2. Latin America

        9.3.3. Western Europe

        9.3.4. Eastern Europe

        9.3.5. South Asia and Pacific

        9.3.6. East Asia

        9.3.7. Middle East and Africa

    9.4. Market Attractiveness Analysis By Region

10. North America Market Analysis 2018 to 2022 and Forecast 2023 to 2033, By Country

    10.1. Historical Market Size Value (US$ Million) & Volume (Units) Trend Analysis By Market Taxonomy, 2018 to 2022

    10.2. Market Size Value (US$ Million) & Volume (Units) Forecast By Market Taxonomy, 2023 to 2033

        10.2.1. By Country

            10.2.1.1. USA

            10.2.1.2. Canada

        10.2.2. By Pet Type

        10.2.3. By Nature

        10.2.4. By Source

        10.2.5. By Sales Channel

    10.3. Market Attractiveness Analysis

        10.3.1. By Country

        10.3.2. By Pet Type

        10.3.3. By Nature

        10.3.4. By Source

        10.3.5. By Sales Channel

    10.4. Key Takeaways

11. Latin America Market Analysis 2018 to 2022 and Forecast 2023 to 2033, By Country

    11.1. Historical Market Size Value (US$ Million) & Volume (Units) Trend Analysis By Market Taxonomy, 2018 to 2022

    11.2. Market Size Value (US$ Million) & Volume (Units) Forecast By Market Taxonomy, 2023 to 2033

        11.2.1. By Country

            11.2.1.1. Brazil

            11.2.1.2. Mexico

            11.2.1.3. Rest of Latin America

        11.2.2. By Pet Type

        11.2.3. By Nature

        11.2.4. By Source

        11.2.5. By Sales Channel

    11.3. Market Attractiveness Analysis

        11.3.1. By Country

        11.3.2. By Pet Type

        11.3.3. By Nature

        11.3.4. By Source

        11.3.5. By Sales Channel

    11.4. Key Takeaways

12. Western Europe Market Analysis 2018 to 2022 and Forecast 2023 to 2033, By Country

    12.1. Historical Market Size Value (US$ Million) & Volume (Units) Trend Analysis By Market Taxonomy, 2018 to 2022

    12.2. Market Size Value (US$ Million) & Volume (Units) Forecast By Market Taxonomy, 2023 to 2033

        12.2.1. By Country

            12.2.1.1. Germany

            12.2.1.2. UK

            12.2.1.3. France

            12.2.1.4. Spain

            12.2.1.5. Italy

            12.2.1.6. Rest of Western Europe

        12.2.2. By Pet Type

        12.2.3. By Nature

        12.2.4. By Source

        12.2.5. By Sales Channel

    12.3. Market Attractiveness Analysis

        12.3.1. By Country

        12.3.2. By Pet Type

        12.3.3. By Nature

        12.3.4. By Source

        12.3.5. By Sales Channel

    12.4. Key Takeaways

13. Eastern Europe Market Analysis 2018 to 2022 and Forecast 2023 to 2033, By Country

    13.1. Historical Market Size Value (US$ Million) & Volume (Units) Trend Analysis By Market Taxonomy, 2018 to 2022

    13.2. Market Size Value (US$ Million) & Volume (Units) Forecast By Market Taxonomy, 2023 to 2033

        13.2.1. By Country

            13.2.1.1. Poland

            13.2.1.2. Russia

            13.2.1.3. Czech Republic

            13.2.1.4. Romania

            13.2.1.5. Rest of Eastern Europe

        13.2.2. By Pet Type

        13.2.3. By Nature

        13.2.4. By Source

        13.2.5. By Sales Channel

    13.3. Market Attractiveness Analysis

        13.3.1. By Country

        13.3.2. By Pet Type

        13.3.3. By Nature

        13.3.4. By Source

        13.3.5. By Sales Channel

    13.4. Key Takeaways

14. South Asia and Pacific Market Analysis 2018 to 2022 and Forecast 2023 to 2033, By Country

    14.1. Historical Market Size Value (US$ Million) & Volume (Units) Trend Analysis By Market Taxonomy, 2018 to 2022

    14.2. Market Size Value (US$ Million) & Volume (Units) Forecast By Market Taxonomy, 2023 to 2033

        14.2.1. By Country

            14.2.1.1. India

            14.2.1.2. Bangladesh

            14.2.1.3. Australia

            14.2.1.4. New Zealand

            14.2.1.5. Rest of South Asia and Pacific

        14.2.2. By Pet Type

        14.2.3. By Nature

        14.2.4. By Source

        14.2.5. By Sales Channel

    14.3. Market Attractiveness Analysis

        14.3.1. By Country

        14.3.2. By Pet Type

        14.3.3. By Nature

        14.3.4. By Source

        14.3.5. By Sales Channel

    14.4. Key Takeaways

15. East Asia Market Analysis 2018 to 2022 and Forecast 2023 to 2033, By Country

    15.1. Historical Market Size Value (US$ Million) & Volume (Units) Trend Analysis By Market Taxonomy, 2018 to 2022

    15.2. Market Size Value (US$ Million) & Volume (Units) Forecast By Market Taxonomy, 2023 to 2033

        15.2.1. By Country

            15.2.1.1. China

            15.2.1.2. Japan

            15.2.1.3. South Korea

        15.2.2. By Pet Type

        15.2.3. By Nature

        15.2.4. By Source

        15.2.5. By Sales Channel

    15.3. Market Attractiveness Analysis

        15.3.1. By Country

        15.3.2. By Pet Type

        15.3.3. By Nature

        15.3.4. By Source

        15.3.5. By Sales Channel

    15.4. Key Takeaways

16. Middle East and Africa Market Analysis 2018 to 2022 and Forecast 2023 to 2033, By Country

    16.1. Historical Market Size Value (US$ Million) & Volume (Units) Trend Analysis By Market Taxonomy, 2018 to 2022

    16.2. Market Size Value (US$ Million) & Volume (Units) Forecast By Market Taxonomy, 2023 to 2033

        16.2.1. By Country

            16.2.1.1. GCC Countries

            16.2.1.2. South Africa

            16.2.1.3. Israel

            16.2.1.4. Rest of MEA

        16.2.2. By Pet Type

        16.2.3. By Nature

        16.2.4. By Source

        16.2.5. By Sales Channel

    16.3. Market Attractiveness Analysis

        16.3.1. By Country

        16.3.2. By Pet Type

        16.3.3. By Nature

        16.3.4. By Source

        16.3.5. By Sales Channel

    16.4. Key Takeaways

17. Key Countries Market Analysis

    17.1. USA

        17.1.1. Pricing Analysis

        17.1.2. Market Share Analysis, 2022

            17.1.2.1. By Pet Type

            17.1.2.2. By Nature

            17.1.2.3. By Source

            17.1.2.4. By Sales Channel

    17.2. Canada

        17.2.1. Pricing Analysis

        17.2.2. Market Share Analysis, 2022

            17.2.2.1. By Pet Type

            17.2.2.2. By Nature

            17.2.2.3. By Source

            17.2.2.4. By Sales Channel

    17.3. Brazil

        17.3.1. Pricing Analysis

        17.3.2. Market Share Analysis, 2022

            17.3.2.1. By Pet Type

            17.3.2.2. By Nature

            17.3.2.3. By Source

            17.3.2.4. By Sales Channel

    17.4. Mexico

        17.4.1. Pricing Analysis

        17.4.2. Market Share Analysis, 2022

            17.4.2.1. By Pet Type

            17.4.2.2. By Nature

            17.4.2.3. By Source

            17.4.2.4. By Sales Channel

    17.5. Germany

        17.5.1. Pricing Analysis

        17.5.2. Market Share Analysis, 2022

            17.5.2.1. By Pet Type

            17.5.2.2. By Nature

            17.5.2.3. By Source

            17.5.2.4. By Sales Channel

    17.6. UK

        17.6.1. Pricing Analysis

        17.6.2. Market Share Analysis, 2022

            17.6.2.1. By Pet Type

            17.6.2.2. By Nature

            17.6.2.3. By Source

            17.6.2.4. By Sales Channel

    17.7. France

        17.7.1. Pricing Analysis

        17.7.2. Market Share Analysis, 2022

            17.7.2.1. By Pet Type

            17.7.2.2. By Nature

            17.7.2.3. By Source

            17.7.2.4. By Sales Channel

    17.8. Spain

        17.8.1. Pricing Analysis

        17.8.2. Market Share Analysis, 2022

            17.8.2.1. By Pet Type

            17.8.2.2. By Nature

            17.8.2.3. By Source

            17.8.2.4. By Sales Channel

    17.9. Italy

        17.9.1. Pricing Analysis

        17.9.2. Market Share Analysis, 2022

            17.9.2.1. By Pet Type

            17.9.2.2. By Nature

            17.9.2.3. By Source

            17.9.2.4. By Sales Channel

    17.10. Poland

        17.10.1. Pricing Analysis

        17.10.2. Market Share Analysis, 2022

            17.10.2.1. By Pet Type

            17.10.2.2. By Nature

            17.10.2.3. By Source

            17.10.2.4. By Sales Channel

    17.11. Russia

        17.11.1. Pricing Analysis

        17.11.2. Market Share Analysis, 2022

            17.11.2.1. By Pet Type

            17.11.2.2. By Nature

            17.11.2.3. By Source

            17.11.2.4. By Sales Channel

    17.12. Czech Republic

        17.12.1. Pricing Analysis

        17.12.2. Market Share Analysis, 2022

            17.12.2.1. By Pet Type

            17.12.2.2. By Nature

            17.12.2.3. By Source

            17.12.2.4. By Sales Channel

    17.13. Romania

        17.13.1. Pricing Analysis

        17.13.2. Market Share Analysis, 2022

            17.13.2.1. By Pet Type

            17.13.2.2. By Nature

            17.13.2.3. By Source

            17.13.2.4. By Sales Channel

    17.14. India

        17.14.1. Pricing Analysis

        17.14.2. Market Share Analysis, 2022

            17.14.2.1. By Pet Type

            17.14.2.2. By Nature

            17.14.2.3. By Source

            17.14.2.4. By Sales Channel

    17.15. Bangladesh

        17.15.1. Pricing Analysis

        17.15.2. Market Share Analysis, 2022

            17.15.2.1. By Pet Type

            17.15.2.2. By Nature

            17.15.2.3. By Source

            17.15.2.4. By Sales Channel

    17.16. Australia

        17.16.1. Pricing Analysis

        17.16.2. Market Share Analysis, 2022

            17.16.2.1. By Pet Type

            17.16.2.2. By Nature

            17.16.2.3. By Source

            17.16.2.4. By Sales Channel

    17.17. New Zealand

        17.17.1. Pricing Analysis

        17.17.2. Market Share Analysis, 2022

            17.17.2.1. By Pet Type

            17.17.2.2. By Nature

            17.17.2.3. By Source

            17.17.2.4. By Sales Channel

    17.18. China

        17.18.1. Pricing Analysis

        17.18.2. Market Share Analysis, 2022

            17.18.2.1. By Pet Type

            17.18.2.2. By Nature

            17.18.2.3. By Source

            17.18.2.4. By Sales Channel

    17.19. Japan

        17.19.1. Pricing Analysis

        17.19.2. Market Share Analysis, 2022

            17.19.2.1. By Pet Type

            17.19.2.2. By Nature

            17.19.2.3. By Source

            17.19.2.4. By Sales Channel

    17.20. South Korea

        17.20.1. Pricing Analysis

        17.20.2. Market Share Analysis, 2022

            17.20.2.1. By Pet Type

            17.20.2.2. By Nature

            17.20.2.3. By Source

            17.20.2.4. By Sales Channel

    17.21. GCC Countries

        17.21.1. Pricing Analysis

        17.21.2. Market Share Analysis, 2022

            17.21.2.1. By Pet Type

            17.21.2.2. By Nature

            17.21.2.3. By Source

            17.21.2.4. By Sales Channel

    17.22. South Africa

        17.22.1. Pricing Analysis

        17.22.2. Market Share Analysis, 2022

            17.22.2.1. By Pet Type

            17.22.2.2. By Nature

            17.22.2.3. By Source

            17.22.2.4. By Sales Channel

    17.23. Israel

        17.23.1. Pricing Analysis

        17.23.2. Market Share Analysis, 2022

            17.23.2.1. By Pet Type

            17.23.2.2. By Nature

            17.23.2.3. By Source

            17.23.2.4. By Sales Channel

18. Market Structure Analysis

    18.1. Competition Dashboard

    18.2. Competition Benchmarking

    18.3. Market Share Analysis of Top Players

        18.3.1. By Regional

        18.3.2. By Pet Type

        18.3.3. By Nature

        18.3.4. By Source

        18.3.5. By Sales Channel

19. Competition Analysis

    19.1. Competition Deep Dive

        19.1.1. PURINA

            19.1.1.1. Overview

            19.1.1.2. Product Portfolio

            19.1.1.3. Profitability by Market Segments

            19.1.1.4. Sales Footprint

            19.1.1.5. Strategy Overview

                19.1.1.5.1. Marketing Strategy

                19.1.1.5.2. Product Strategy

                19.1.1.5.3. Channel Strategy

        19.1.2. MONGE SPA

            19.1.2.1. Overview

            19.1.2.2. Product Portfolio

            19.1.2.3. Profitability by Market Segments

            19.1.2.4. Sales Footprint

            19.1.2.5. Strategy Overview

                19.1.2.5.1. Marketing Strategy

                19.1.2.5.2. Product Strategy

                19.1.2.5.3. Channel Strategy

        19.1.3. Blue Buffalo Co., Ltd.

            19.1.3.1. Overview

            19.1.3.2. Product Portfolio

            19.1.3.3. Profitability by Market Segments

            19.1.3.4. Sales Footprint

            19.1.3.5. Strategy Overview

                19.1.3.5.1. Marketing Strategy

                19.1.3.5.2. Product Strategy

                19.1.3.5.3. Channel Strategy

        19.1.4. Harringtons Foods

            19.1.4.1. Overview

            19.1.4.2. Product Portfolio

            19.1.4.3. Profitability by Market Segments

            19.1.4.4. Sales Footprint

            19.1.4.5. Strategy Overview

                19.1.4.5.1. Marketing Strategy

                19.1.4.5.2. Product Strategy

                19.1.4.5.3. Channel Strategy

        19.1.5. Wellness

            19.1.5.1. Overview

            19.1.5.2. Product Portfolio

            19.1.5.3. Profitability by Market Segments

            19.1.5.4. Sales Footprint

            19.1.5.5. Strategy Overview

                19.1.5.5.1. Marketing Strategy

                19.1.5.5.2. Product Strategy

                19.1.5.5.3. Channel Strategy

        19.1.6. PetGuard

            19.1.6.1. Overview

            19.1.6.2. Product Portfolio

            19.1.6.3. Profitability by Market Segments

            19.1.6.4. Sales Footprint

            19.1.6.5. Strategy Overview

                19.1.6.5.1. Marketing Strategy

                19.1.6.5.2. Product Strategy

                19.1.6.5.3. Channel Strategy

        19.1.7. C&D Foods

            19.1.7.1. Overview

            19.1.7.2. Product Portfolio

            19.1.7.3. Profitability by Market Segments

            19.1.7.4. Sales Footprint

            19.1.7.5. Strategy Overview

                19.1.7.5.1. Marketing Strategy

                19.1.7.5.2. Product Strategy

                19.1.7.5.3. Channel Strategy

        19.1.8. Darling Ingredients Inc.

            19.1.8.1. Overview

            19.1.8.2. Product Portfolio

            19.1.8.3. Profitability by Market Segments

            19.1.8.4. Sales Footprint

            19.1.8.5. Strategy Overview

                19.1.8.5.1. Marketing Strategy

                19.1.8.5.2. Product Strategy

                19.1.8.5.3. Channel Strategy

        19.1.9. Simmons Pet Food

            19.1.9.1. Overview

            19.1.9.2. Product Portfolio

            19.1.9.3. Profitability by Market Segments

            19.1.9.4. Sales Footprint

            19.1.9.5. Strategy Overview

                19.1.9.5.1. Marketing Strategy

                19.1.9.5.2. Product Strategy

                19.1.9.5.3. Channel Strategy

        19.1.10. NaturPak Pet

            19.1.10.1. Overview

            19.1.10.2. Product Portfolio

            19.1.10.3. Profitability by Market Segments

            19.1.10.4. Sales Footprint

            19.1.10.5. Strategy Overview

                19.1.10.5.1. Marketing Strategy

                19.1.10.5.2. Product Strategy

                19.1.10.5.3. Channel Strategy

20. Assumptions & Acronyms Used

21. Research Methodology

Don't pay for what you don't need

Customize your report by selecting specific countries or regions and save 30%!

List of Tables

Table 1: Global Market Value (US$ Million) Forecast by Region, 2018 to 2033

Table 2: Global Market Volume (Units) Forecast by Region, 2018 to 2033

Table 3: Global Market Value (US$ Million) Forecast by Pet Type, 2018 to 2033

Table 4: Global Market Volume (Units) Forecast by Pet Type, 2018 to 2033

Table 5: Global Market Value (US$ Million) Forecast by Nature, 2018 to 2033

Table 6: Global Market Volume (Units) Forecast by Nature, 2018 to 2033

Table 7: Global Market Value (US$ Million) Forecast by Source, 2018 to 2033

Table 8: Global Market Volume (Units) Forecast by Source, 2018 to 2033

Table 9: Global Market Value (US$ Million) Forecast by Sales Channel, 2018 to 2033

Table 10: Global Market Volume (Units) Forecast by Sales Channel, 2018 to 2033

Table 11: North America Market Value (US$ Million) Forecast by Country, 2018 to 2033

Table 12: North America Market Volume (Units) Forecast by Country, 2018 to 2033

Table 13: North America Market Value (US$ Million) Forecast by Pet Type, 2018 to 2033

Table 14: North America Market Volume (Units) Forecast by Pet Type, 2018 to 2033

Table 15: North America Market Value (US$ Million) Forecast by Nature, 2018 to 2033

Table 16: North America Market Volume (Units) Forecast by Nature, 2018 to 2033

Table 17: North America Market Value (US$ Million) Forecast by Source, 2018 to 2033

Table 18: North America Market Volume (Units) Forecast by Source, 2018 to 2033

Table 19: North America Market Value (US$ Million) Forecast by Sales Channel, 2018 to 2033

Table 20: North America Market Volume (Units) Forecast by Sales Channel, 2018 to 2033

Table 21: Latin America Market Value (US$ Million) Forecast by Country, 2018 to 2033

Table 22: Latin America Market Volume (Units) Forecast by Country, 2018 to 2033

Table 23: Latin America Market Value (US$ Million) Forecast by Pet Type, 2018 to 2033

Table 24: Latin America Market Volume (Units) Forecast by Pet Type, 2018 to 2033

Table 25: Latin America Market Value (US$ Million) Forecast by Nature, 2018 to 2033

Table 26: Latin America Market Volume (Units) Forecast by Nature, 2018 to 2033

Table 27: Latin America Market Value (US$ Million) Forecast by Source, 2018 to 2033

Table 28: Latin America Market Volume (Units) Forecast by Source, 2018 to 2033

Table 29: Latin America Market Value (US$ Million) Forecast by Sales Channel, 2018 to 2033

Table 30: Latin America Market Volume (Units) Forecast by Sales Channel, 2018 to 2033

Table 31: Western Europe Market Value (US$ Million) Forecast by Country, 2018 to 2033

Table 32: Western Europe Market Volume (Units) Forecast by Country, 2018 to 2033

Table 33: Western Europe Market Value (US$ Million) Forecast by Pet Type, 2018 to 2033

Table 34: Western Europe Market Volume (Units) Forecast by Pet Type, 2018 to 2033

Table 35: Western Europe Market Value (US$ Million) Forecast by Nature, 2018 to 2033

Table 36: Western Europe Market Volume (Units) Forecast by Nature, 2018 to 2033

Table 37: Western Europe Market Value (US$ Million) Forecast by Source, 2018 to 2033

Table 38: Western Europe Market Volume (Units) Forecast by Source, 2018 to 2033

Table 39: Western Europe Market Value (US$ Million) Forecast by Sales Channel, 2018 to 2033

Table 40: Western Europe Market Volume (Units) Forecast by Sales Channel, 2018 to 2033

Table 41: Eastern Europe Market Value (US$ Million) Forecast by Country, 2018 to 2033

Table 42: Eastern Europe Market Volume (Units) Forecast by Country, 2018 to 2033

Table 43: Eastern Europe Market Value (US$ Million) Forecast by Pet Type, 2018 to 2033

Table 44: Eastern Europe Market Volume (Units) Forecast by Pet Type, 2018 to 2033

Table 45: Eastern Europe Market Value (US$ Million) Forecast by Nature, 2018 to 2033

Table 46: Eastern Europe Market Volume (Units) Forecast by Nature, 2018 to 2033

Table 47: Eastern Europe Market Value (US$ Million) Forecast by Source, 2018 to 2033

Table 48: Eastern Europe Market Volume (Units) Forecast by Source, 2018 to 2033

Table 49: Eastern Europe Market Value (US$ Million) Forecast by Sales Channel, 2018 to 2033

Table 50: Eastern Europe Market Volume (Units) Forecast by Sales Channel, 2018 to 2033

Table 51: South Asia and Pacific Market Value (US$ Million) Forecast by Country, 2018 to 2033

Table 52: South Asia and Pacific Market Volume (Units) Forecast by Country, 2018 to 2033

Table 53: South Asia and Pacific Market Value (US$ Million) Forecast by Pet Type, 2018 to 2033

Table 54: South Asia and Pacific Market Volume (Units) Forecast by Pet Type, 2018 to 2033

Table 55: South Asia and Pacific Market Value (US$ Million) Forecast by Nature, 2018 to 2033

Table 56: South Asia and Pacific Market Volume (Units) Forecast by Nature, 2018 to 2033

Table 57: South Asia and Pacific Market Value (US$ Million) Forecast by Source, 2018 to 2033

Table 58: South Asia and Pacific Market Volume (Units) Forecast by Source, 2018 to 2033

Table 59: South Asia and Pacific Market Value (US$ Million) Forecast by Sales Channel, 2018 to 2033

Table 60: South Asia and Pacific Market Volume (Units) Forecast by Sales Channel, 2018 to 2033

Table 61: East Asia Market Value (US$ Million) Forecast by Country, 2018 to 2033

Table 62: East Asia Market Volume (Units) Forecast by Country, 2018 to 2033

Table 63: East Asia Market Value (US$ Million) Forecast by Pet Type, 2018 to 2033

Table 64: East Asia Market Volume (Units) Forecast by Pet Type, 2018 to 2033

Table 65: East Asia Market Value (US$ Million) Forecast by Nature, 2018 to 2033

Table 66: East Asia Market Volume (Units) Forecast by Nature, 2018 to 2033

Table 67: East Asia Market Value (US$ Million) Forecast by Source, 2018 to 2033

Table 68: East Asia Market Volume (Units) Forecast by Source, 2018 to 2033

Table 69: East Asia Market Value (US$ Million) Forecast by Sales Channel, 2018 to 2033

Table 70: East Asia Market Volume (Units) Forecast by Sales Channel, 2018 to 2033

Table 71: Middle East and Africa Market Value (US$ Million) Forecast by Country, 2018 to 2033

Table 72: Middle East and Africa Market Volume (Units) Forecast by Country, 2018 to 2033

Table 73: Middle East and Africa Market Value (US$ Million) Forecast by Pet Type, 2018 to 2033

Table 74: Middle East and Africa Market Volume (Units) Forecast by Pet Type, 2018 to 2033

Table 75: Middle East and Africa Market Value (US$ Million) Forecast by Nature, 2018 to 2033

Table 76: Middle East and Africa Market Volume (Units) Forecast by Nature, 2018 to 2033

Table 77: Middle East and Africa Market Value (US$ Million) Forecast by Source, 2018 to 2033

Table 78: Middle East and Africa Market Volume (Units) Forecast by Source, 2018 to 2033

Table 79: Middle East and Africa Market Value (US$ Million) Forecast by Sales Channel, 2018 to 2033

Table 80: Middle East and Africa Market Volume (Units) Forecast by Sales Channel, 2018 to 2033
Nandini Roy Choudhury

Principal Consultant

Talk to Analyst

Find your sweet spots for generating winning opportunities in this market.

List of Charts

Figure 1: Global Market Value (US$ Million) by Pet Type, 2023 to 2033

Figure 2: Global Market Value (US$ Million) by Nature, 2023 to 2033

Figure 3: Global Market Value (US$ Million) by Source, 2023 to 2033

Figure 4: Global Market Value (US$ Million) by Sales Channel, 2023 to 2033

Figure 5: Global Market Value (US$ Million) by Region, 2023 to 2033

Figure 6: Global Market Value (US$ Million) Analysis by Region, 2018 to 2033

Figure 7: Global Market Volume (Units) Analysis by Region, 2018 to 2033

Figure 8: Global Market Value Share (%) and BPS Analysis by Region, 2023 to 2033

Figure 9: Global Market Y-o-Y Growth (%) Projections by Region, 2023 to 2033

Figure 10: Global Market Value (US$ Million) Analysis by Pet Type, 2018 to 2033

Figure 11: Global Market Volume (Units) Analysis by Pet Type, 2018 to 2033

Figure 12: Global Market Value Share (%) and BPS Analysis by Pet Type, 2023 to 2033

Figure 13: Global Market Y-o-Y Growth (%) Projections by Pet Type, 2023 to 2033

Figure 14: Global Market Value (US$ Million) Analysis by Nature, 2018 to 2033

Figure 15: Global Market Volume (Units) Analysis by Nature, 2018 to 2033

Figure 16: Global Market Value Share (%) and BPS Analysis by Nature, 2023 to 2033

Figure 17: Global Market Y-o-Y Growth (%) Projections by Nature, 2023 to 2033

Figure 18: Global Market Value (US$ Million) Analysis by Source, 2018 to 2033

Figure 19: Global Market Volume (Units) Analysis by Source, 2018 to 2033

Figure 20: Global Market Value Share (%) and BPS Analysis by Source, 2023 to 2033

Figure 21: Global Market Y-o-Y Growth (%) Projections by Source, 2023 to 2033

Figure 22: Global Market Value (US$ Million) Analysis by Sales Channel, 2018 to 2033

Figure 23: Global Market Volume (Units) Analysis by Sales Channel, 2018 to 2033

Figure 24: Global Market Value Share (%) and BPS Analysis by Sales Channel, 2023 to 2033

Figure 25: Global Market Y-o-Y Growth (%) Projections by Sales Channel, 2023 to 2033

Figure 26: Global Market Attractiveness by Pet Type, 2023 to 2033

Figure 27: Global Market Attractiveness by Nature, 2023 to 2033

Figure 28: Global Market Attractiveness by Source, 2023 to 2033

Figure 29: Global Market Attractiveness by Sales Channel, 2023 to 2033

Figure 30: Global Market Attractiveness by Region, 2023 to 2033

Figure 31: North America Market Value (US$ Million) by Pet Type, 2023 to 2033

Figure 32: North America Market Value (US$ Million) by Nature, 2023 to 2033

Figure 33: North America Market Value (US$ Million) by Source, 2023 to 2033

Figure 34: North America Market Value (US$ Million) by Sales Channel, 2023 to 2033

Figure 35: North America Market Value (US$ Million) by Country, 2023 to 2033

Figure 36: North America Market Value (US$ Million) Analysis by Country, 2018 to 2033

Figure 37: North America Market Volume (Units) Analysis by Country, 2018 to 2033

Figure 38: North America Market Value Share (%) and BPS Analysis by Country, 2023 to 2033

Figure 39: North America Market Y-o-Y Growth (%) Projections by Country, 2023 to 2033

Figure 40: North America Market Value (US$ Million) Analysis by Pet Type, 2018 to 2033

Figure 41: North America Market Volume (Units) Analysis by Pet Type, 2018 to 2033

Figure 42: North America Market Value Share (%) and BPS Analysis by Pet Type, 2023 to 2033

Figure 43: North America Market Y-o-Y Growth (%) Projections by Pet Type, 2023 to 2033

Figure 44: North America Market Value (US$ Million) Analysis by Nature, 2018 to 2033

Figure 45: North America Market Volume (Units) Analysis by Nature, 2018 to 2033

Figure 46: North America Market Value Share (%) and BPS Analysis by Nature, 2023 to 2033

Figure 47: North America Market Y-o-Y Growth (%) Projections by Nature, 2023 to 2033

Figure 48: North America Market Value (US$ Million) Analysis by Source, 2018 to 2033

Figure 49: North America Market Volume (Units) Analysis by Source, 2018 to 2033

Figure 50: North America Market Value Share (%) and BPS Analysis by Source, 2023 to 2033

Figure 51: North America Market Y-o-Y Growth (%) Projections by Source, 2023 to 2033

Figure 52: North America Market Value (US$ Million) Analysis by Sales Channel, 2018 to 2033

Figure 53: North America Market Volume (Units) Analysis by Sales Channel, 2018 to 2033

Figure 54: North America Market Value Share (%) and BPS Analysis by Sales Channel, 2023 to 2033

Figure 55: North America Market Y-o-Y Growth (%) Projections by Sales Channel, 2023 to 2033

Figure 56: North America Market Attractiveness by Pet Type, 2023 to 2033

Figure 57: North America Market Attractiveness by Nature, 2023 to 2033

Figure 58: North America Market Attractiveness by Source, 2023 to 2033

Figure 59: North America Market Attractiveness by Sales Channel, 2023 to 2033

Figure 60: North America Market Attractiveness by Country, 2023 to 2033

Figure 61: Latin America Market Value (US$ Million) by Pet Type, 2023 to 2033

Figure 62: Latin America Market Value (US$ Million) by Nature, 2023 to 2033

Figure 63: Latin America Market Value (US$ Million) by Source, 2023 to 2033

Figure 64: Latin America Market Value (US$ Million) by Sales Channel, 2023 to 2033

Figure 65: Latin America Market Value (US$ Million) by Country, 2023 to 2033

Figure 66: Latin America Market Value (US$ Million) Analysis by Country, 2018 to 2033

Figure 67: Latin America Market Volume (Units) Analysis by Country, 2018 to 2033

Figure 68: Latin America Market Value Share (%) and BPS Analysis by Country, 2023 to 2033

Figure 69: Latin America Market Y-o-Y Growth (%) Projections by Country, 2023 to 2033

Figure 70: Latin America Market Value (US$ Million) Analysis by Pet Type, 2018 to 2033

Figure 71: Latin America Market Volume (Units) Analysis by Pet Type, 2018 to 2033

Figure 72: Latin America Market Value Share (%) and BPS Analysis by Pet Type, 2023 to 2033

Figure 73: Latin America Market Y-o-Y Growth (%) Projections by Pet Type, 2023 to 2033

Figure 74: Latin America Market Value (US$ Million) Analysis by Nature, 2018 to 2033

Figure 75: Latin America Market Volume (Units) Analysis by Nature, 2018 to 2033

Figure 76: Latin America Market Value Share (%) and BPS Analysis by Nature, 2023 to 2033

Figure 77: Latin America Market Y-o-Y Growth (%) Projections by Nature, 2023 to 2033

Figure 78: Latin America Market Value (US$ Million) Analysis by Source, 2018 to 2033

Figure 79: Latin America Market Volume (Units) Analysis by Source, 2018 to 2033

Figure 80: Latin America Market Value Share (%) and BPS Analysis by Source, 2023 to 2033

Figure 81: Latin America Market Y-o-Y Growth (%) Projections by Source, 2023 to 2033

Figure 82: Latin America Market Value (US$ Million) Analysis by Sales Channel, 2018 to 2033

Figure 83: Latin America Market Volume (Units) Analysis by Sales Channel, 2018 to 2033

Figure 84: Latin America Market Value Share (%) and BPS Analysis by Sales Channel, 2023 to 2033

Figure 85: Latin America Market Y-o-Y Growth (%) Projections by Sales Channel, 2023 to 2033

Figure 86: Latin America Market Attractiveness by Pet Type, 2023 to 2033

Figure 87: Latin America Market Attractiveness by Nature, 2023 to 2033

Figure 88: Latin America Market Attractiveness by Source, 2023 to 2033

Figure 89: Latin America Market Attractiveness by Sales Channel, 2023 to 2033

Figure 90: Latin America Market Attractiveness by Country, 2023 to 2033

Figure 91: Western Europe Market Value (US$ Million) by Pet Type, 2023 to 2033

Figure 92: Western Europe Market Value (US$ Million) by Nature, 2023 to 2033

Figure 93: Western Europe Market Value (US$ Million) by Source, 2023 to 2033

Figure 94: Western Europe Market Value (US$ Million) by Sales Channel, 2023 to 2033

Figure 95: Western Europe Market Value (US$ Million) by Country, 2023 to 2033

Figure 96: Western Europe Market Value (US$ Million) Analysis by Country, 2018 to 2033

Figure 97: Western Europe Market Volume (Units) Analysis by Country, 2018 to 2033

Figure 98: Western Europe Market Value Share (%) and BPS Analysis by Country, 2023 to 2033

Figure 99: Western Europe Market Y-o-Y Growth (%) Projections by Country, 2023 to 2033

Figure 100: Western Europe Market Value (US$ Million) Analysis by Pet Type, 2018 to 2033

Figure 101: Western Europe Market Volume (Units) Analysis by Pet Type, 2018 to 2033

Figure 102: Western Europe Market Value Share (%) and BPS Analysis by Pet Type, 2023 to 2033

Figure 103: Western Europe Market Y-o-Y Growth (%) Projections by Pet Type, 2023 to 2033

Figure 104: Western Europe Market Value (US$ Million) Analysis by Nature, 2018 to 2033

Figure 105: Western Europe Market Volume (Units) Analysis by Nature, 2018 to 2033

Figure 106: Western Europe Market Value Share (%) and BPS Analysis by Nature, 2023 to 2033

Figure 107: Western Europe Market Y-o-Y Growth (%) Projections by Nature, 2023 to 2033

Figure 108: Western Europe Market Value (US$ Million) Analysis by Source, 2018 to 2033

Figure 109: Western Europe Market Volume (Units) Analysis by Source, 2018 to 2033

Figure 110: Western Europe Market Value Share (%) and BPS Analysis by Source, 2023 to 2033

Figure 111: Western Europe Market Y-o-Y Growth (%) Projections by Source, 2023 to 2033

Figure 112: Western Europe Market Value (US$ Million) Analysis by Sales Channel, 2018 to 2033

Figure 113: Western Europe Market Volume (Units) Analysis by Sales Channel, 2018 to 2033

Figure 114: Western Europe Market Value Share (%) and BPS Analysis by Sales Channel, 2023 to 2033

Figure 115: Western Europe Market Y-o-Y Growth (%) Projections by Sales Channel, 2023 to 2033

Figure 116: Western Europe Market Attractiveness by Pet Type, 2023 to 2033

Figure 117: Western Europe Market Attractiveness by Nature, 2023 to 2033

Figure 118: Western Europe Market Attractiveness by Source, 2023 to 2033

Figure 119: Western Europe Market Attractiveness by Sales Channel, 2023 to 2033

Figure 120: Western Europe Market Attractiveness by Country, 2023 to 2033

Figure 121: Eastern Europe Market Value (US$ Million) by Pet Type, 2023 to 2033

Figure 122: Eastern Europe Market Value (US$ Million) by Nature, 2023 to 2033

Figure 123: Eastern Europe Market Value (US$ Million) by Source, 2023 to 2033

Figure 124: Eastern Europe Market Value (US$ Million) by Sales Channel, 2023 to 2033

Figure 125: Eastern Europe Market Value (US$ Million) by Country, 2023 to 2033

Figure 126: Eastern Europe Market Value (US$ Million) Analysis by Country, 2018 to 2033

Figure 127: Eastern Europe Market Volume (Units) Analysis by Country, 2018 to 2033

Figure 128: Eastern Europe Market Value Share (%) and BPS Analysis by Country, 2023 to 2033

Figure 129: Eastern Europe Market Y-o-Y Growth (%) Projections by Country, 2023 to 2033

Figure 130: Eastern Europe Market Value (US$ Million) Analysis by Pet Type, 2018 to 2033

Figure 131: Eastern Europe Market Volume (Units) Analysis by Pet Type, 2018 to 2033

Figure 132: Eastern Europe Market Value Share (%) and BPS Analysis by Pet Type, 2023 to 2033

Figure 133: Eastern Europe Market Y-o-Y Growth (%) Projections by Pet Type, 2023 to 2033

Figure 134: Eastern Europe Market Value (US$ Million) Analysis by Nature, 2018 to 2033

Figure 135: Eastern Europe Market Volume (Units) Analysis by Nature, 2018 to 2033

Figure 136: Eastern Europe Market Value Share (%) and BPS Analysis by Nature, 2023 to 2033

Figure 137: Eastern Europe Market Y-o-Y Growth (%) Projections by Nature, 2023 to 2033

Figure 138: Eastern Europe Market Value (US$ Million) Analysis by Source, 2018 to 2033

Figure 139: Eastern Europe Market Volume (Units) Analysis by Source, 2018 to 2033

Figure 140: Eastern Europe Market Value Share (%) and BPS Analysis by Source, 2023 to 2033

Figure 141: Eastern Europe Market Y-o-Y Growth (%) Projections by Source, 2023 to 2033

Figure 142: Eastern Europe Market Value (US$ Million) Analysis by Sales Channel, 2018 to 2033

Figure 143: Eastern Europe Market Volume (Units) Analysis by Sales Channel, 2018 to 2033

Figure 144: Eastern Europe Market Value Share (%) and BPS Analysis by Sales Channel, 2023 to 2033

Figure 145: Eastern Europe Market Y-o-Y Growth (%) Projections by Sales Channel, 2023 to 2033

Figure 146: Eastern Europe Market Attractiveness by Pet Type, 2023 to 2033

Figure 147: Eastern Europe Market Attractiveness by Nature, 2023 to 2033

Figure 148: Eastern Europe Market Attractiveness by Source, 2023 to 2033

Figure 149: Eastern Europe Market Attractiveness by Sales Channel, 2023 to 2033

Figure 150: Eastern Europe Market Attractiveness by Country, 2023 to 2033

Figure 151: South Asia and Pacific Market Value (US$ Million) by Pet Type, 2023 to 2033

Figure 152: South Asia and Pacific Market Value (US$ Million) by Nature, 2023 to 2033

Figure 153: South Asia and Pacific Market Value (US$ Million) by Source, 2023 to 2033

Figure 154: South Asia and Pacific Market Value (US$ Million) by Sales Channel, 2023 to 2033

Figure 155: South Asia and Pacific Market Value (US$ Million) by Country, 2023 to 2033

Figure 156: South Asia and Pacific Market Value (US$ Million) Analysis by Country, 2018 to 2033

Figure 157: South Asia and Pacific Market Volume (Units) Analysis by Country, 2018 to 2033

Figure 158: South Asia and Pacific Market Value Share (%) and BPS Analysis by Country, 2023 to 2033

Figure 159: South Asia and Pacific Market Y-o-Y Growth (%) Projections by Country, 2023 to 2033

Figure 160: South Asia and Pacific Market Value (US$ Million) Analysis by Pet Type, 2018 to 2033

Figure 161: South Asia and Pacific Market Volume (Units) Analysis by Pet Type, 2018 to 2033

Figure 162: South Asia and Pacific Market Value Share (%) and BPS Analysis by Pet Type, 2023 to 2033

Figure 163: South Asia and Pacific Market Y-o-Y Growth (%) Projections by Pet Type, 2023 to 2033

Figure 164: South Asia and Pacific Market Value (US$ Million) Analysis by Nature, 2018 to 2033

Figure 165: South Asia and Pacific Market Volume (Units) Analysis by Nature, 2018 to 2033

Figure 166: South Asia and Pacific Market Value Share (%) and BPS Analysis by Nature, 2023 to 2033

Figure 167: South Asia and Pacific Market Y-o-Y Growth (%) Projections by Nature, 2023 to 2033

Figure 168: South Asia and Pacific Market Value (US$ Million) Analysis by Source, 2018 to 2033

Figure 169: South Asia and Pacific Market Volume (Units) Analysis by Source, 2018 to 2033

Figure 170: South Asia and Pacific Market Value Share (%) and BPS Analysis by Source, 2023 to 2033

Figure 171: South Asia and Pacific Market Y-o-Y Growth (%) Projections by Source, 2023 to 2033

Figure 172: South Asia and Pacific Market Value (US$ Million) Analysis by Sales Channel, 2018 to 2033

Figure 173: South Asia and Pacific Market Volume (Units) Analysis by Sales Channel, 2018 to 2033

Figure 174: South Asia and Pacific Market Value Share (%) and BPS Analysis by Sales Channel, 2023 to 2033

Figure 175: South Asia and Pacific Market Y-o-Y Growth (%) Projections by Sales Channel, 2023 to 2033

Figure 176: South Asia and Pacific Market Attractiveness by Pet Type, 2023 to 2033

Figure 177: South Asia and Pacific Market Attractiveness by Nature, 2023 to 2033

Figure 178: South Asia and Pacific Market Attractiveness by Source, 2023 to 2033

Figure 179: South Asia and Pacific Market Attractiveness by Sales Channel, 2023 to 2033

Figure 180: South Asia and Pacific Market Attractiveness by Country, 2023 to 2033

Figure 181: East Asia Market Value (US$ Million) by Pet Type, 2023 to 2033

Figure 182: East Asia Market Value (US$ Million) by Nature, 2023 to 2033

Figure 183: East Asia Market Value (US$ Million) by Source, 2023 to 2033

Figure 184: East Asia Market Value (US$ Million) by Sales Channel, 2023 to 2033

Figure 185: East Asia Market Value (US$ Million) by Country, 2023 to 2033

Figure 186: East Asia Market Value (US$ Million) Analysis by Country, 2018 to 2033

Figure 187: East Asia Market Volume (Units) Analysis by Country, 2018 to 2033

Figure 188: East Asia Market Value Share (%) and BPS Analysis by Country, 2023 to 2033

Figure 189: East Asia Market Y-o-Y Growth (%) Projections by Country, 2023 to 2033

Figure 190: East Asia Market Value (US$ Million) Analysis by Pet Type, 2018 to 2033

Figure 191: East Asia Market Volume (Units) Analysis by Pet Type, 2018 to 2033

Figure 192: East Asia Market Value Share (%) and BPS Analysis by Pet Type, 2023 to 2033

Figure 193: East Asia Market Y-o-Y Growth (%) Projections by Pet Type, 2023 to 2033

Figure 194: East Asia Market Value (US$ Million) Analysis by Nature, 2018 to 2033

Figure 195: East Asia Market Volume (Units) Analysis by Nature, 2018 to 2033

Figure 196: East Asia Market Value Share (%) and BPS Analysis by Nature, 2023 to 2033

Figure 197: East Asia Market Y-o-Y Growth (%) Projections by Nature, 2023 to 2033

Figure 198: East Asia Market Value (US$ Million) Analysis by Source, 2018 to 2033

Figure 199: East Asia Market Volume (Units) Analysis by Source, 2018 to 2033

Figure 200: East Asia Market Value Share (%) and BPS Analysis by Source, 2023 to 2033

Figure 201: East Asia Market Y-o-Y Growth (%) Projections by Source, 2023 to 2033

Figure 202: East Asia Market Value (US$ Million) Analysis by Sales Channel, 2018 to 2033

Figure 203: East Asia Market Volume (Units) Analysis by Sales Channel, 2018 to 2033

Figure 204: East Asia Market Value Share (%) and BPS Analysis by Sales Channel, 2023 to 2033

Figure 205: East Asia Market Y-o-Y Growth (%) Projections by Sales Channel, 2023 to 2033

Figure 206: East Asia Market Attractiveness by Pet Type, 2023 to 2033

Figure 207: East Asia Market Attractiveness by Nature, 2023 to 2033

Figure 208: East Asia Market Attractiveness by Source, 2023 to 2033

Figure 209: East Asia Market Attractiveness by Sales Channel, 2023 to 2033

Figure 210: East Asia Market Attractiveness by Country, 2023 to 2033

Figure 211: Middle East and Africa Market Value (US$ Million) by Pet Type, 2023 to 2033

Figure 212: Middle East and Africa Market Value (US$ Million) by Nature, 2023 to 2033

Figure 213: Middle East and Africa Market Value (US$ Million) by Source, 2023 to 2033

Figure 214: Middle East and Africa Market Value (US$ Million) by Sales Channel, 2023 to 2033

Figure 215: Middle East and Africa Market Value (US$ Million) by Country, 2023 to 2033

Figure 216: Middle East and Africa Market Value (US$ Million) Analysis by Country, 2018 to 2033

Figure 217: Middle East and Africa Market Volume (Units) Analysis by Country, 2018 to 2033

Figure 218: Middle East and Africa Market Value Share (%) and BPS Analysis by Country, 2023 to 2033

Figure 219: Middle East and Africa Market Y-o-Y Growth (%) Projections by Country, 2023 to 2033

Figure 220: Middle East and Africa Market Value (US$ Million) Analysis by Pet Type, 2018 to 2033

Figure 221: Middle East and Africa Market Volume (Units) Analysis by Pet Type, 2018 to 2033

Figure 222: Middle East and Africa Market Value Share (%) and BPS Analysis by Pet Type, 2023 to 2033

Figure 223: Middle East and Africa Market Y-o-Y Growth (%) Projections by Pet Type, 2023 to 2033

Figure 224: Middle East and Africa Market Value (US$ Million) Analysis by Nature, 2018 to 2033

Figure 225: Middle East and Africa Market Volume (Units) Analysis by Nature, 2018 to 2033

Figure 226: Middle East and Africa Market Value Share (%) and BPS Analysis by Nature, 2023 to 2033

Figure 227: Middle East and Africa Market Y-o-Y Growth (%) Projections by Nature, 2023 to 2033

Figure 228: Middle East and Africa Market Value (US$ Million) Analysis by Source, 2018 to 2033

Figure 229: Middle East and Africa Market Volume (Units) Analysis by Source, 2018 to 2033

Figure 230: Middle East and Africa Market Value Share (%) and BPS Analysis by Source, 2023 to 2033

Figure 231: Middle East and Africa Market Y-o-Y Growth (%) Projections by Source, 2023 to 2033

Figure 232: Middle East and Africa Market Value (US$ Million) Analysis by Sales Channel, 2018 to 2033

Figure 233: Middle East and Africa Market Volume (Units) Analysis by Sales Channel, 2018 to 2033

Figure 234: Middle East and Africa Market Value Share (%) and BPS Analysis by Sales Channel, 2023 to 2033

Figure 235: Middle East and Africa Market Y-o-Y Growth (%) Projections by Sales Channel, 2023 to 2033

Figure 236: Middle East and Africa Market Attractiveness by Pet Type, 2023 to 2033

Figure 237: Middle East and Africa Market Attractiveness by Nature, 2023 to 2033

Figure 238: Middle East and Africa Market Attractiveness by Source, 2023 to 2033

Figure 239: Middle East and Africa Market Attractiveness by Sales Channel, 2023 to 2033

Figure 240: Middle East and Africa Market Attractiveness by Country, 2023 to 2033

Recommendations

Food and Beverage

Pet Food Microalgae Market

Published : June 2023

Food and Beverage

Pet Food Ingredients Market

Published : February 2023

Explore Food and Beverage Insights

View Reports