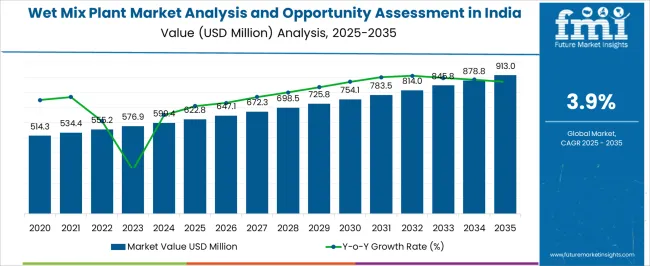
The Wet Mix Plant Market Analysis and Opportunity Assessment in India is estimated to be valued at USD 622.8 million in 2025 and is projected to reach USD 913.0 million by 2035, registering a compound annual growth rate (CAGR) of 3.9% over the forecast period.
| Metric | Value |
|---|---|
| Wet Mix Plant Market Analysis and Opportunity Assessment in India Estimated Value in (2025 E) | USD 622.8 million |
| Wet Mix Plant Market Analysis and Opportunity Assessment in India Forecast Value in (2035 F) | USD 913.0 million |
| Forecast CAGR (2025 to 2035) | 3.9% |
The wet mix plant market in India is witnessing strong growth, propelled by large-scale road development projects, highway expansion, and government investment in infrastructure modernization. Wet mix plants provide superior efficiency in producing homogeneous mixtures for base and sub-base layers, ensuring durability and compliance with construction quality standards.
The market benefits from rapid urbanization, industrialization, and increasing public-private partnerships in infrastructure. Rising demand for cost-effective, high-performance equipment with advanced automation features is further accelerating adoption.
Current market conditions are shaped by robust demand from national highway construction, rural road programs, and state-level infrastructure initiatives. With sustained government focus on transportation infrastructure and smart city development, the wet mix plant market in India is set to expand significantly over the forecast period.
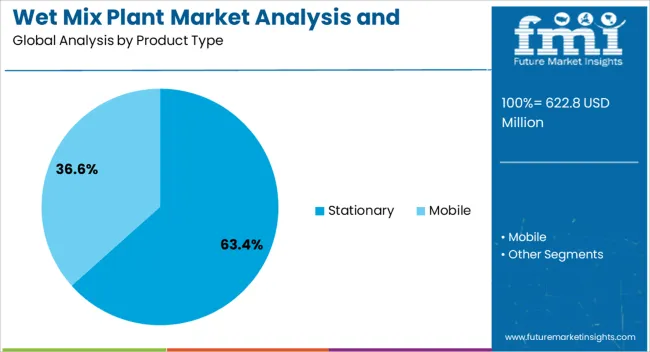
The stationary segment leads the product type category with approximately 63.40% share, driven by its widespread adoption in large-scale road and infrastructure projects. Stationary wet mix plants are preferred for their high production capacity, operational stability, and long-term cost efficiency.
The segment benefits from established demand in highway construction and industrial site development where continuous output is critical. Its robust design and ability to integrate with advanced control systems enhance quality consistency and operational efficiency.
With ongoing expansion of road networks and urban infrastructure in India, the stationary segment is expected to retain its strong position in the market.
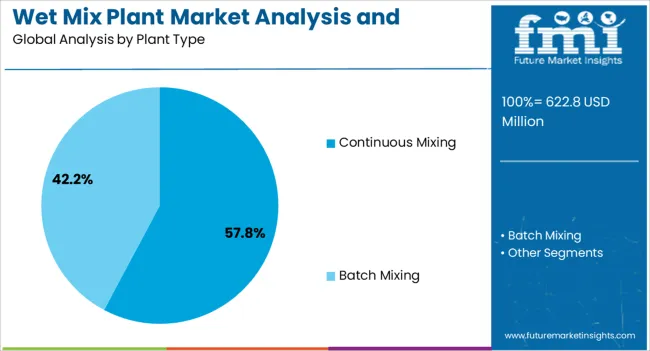
The continuous mixing segment dominates the plant type category, accounting for approximately 57.80% share. Its leadership is attributed to the ability to deliver uninterrupted production, improving project efficiency and reducing downtime.
Continuous mixing plants are valued for their ability to provide consistent material quality at scale, aligning with the stringent requirements of modern road construction projects. Their operational efficiency and adaptability to high-volume applications make them a preferred choice among contractors.
With government emphasis on timely project completion and quality infrastructure, the continuous mixing segment is projected to maintain its leading share.
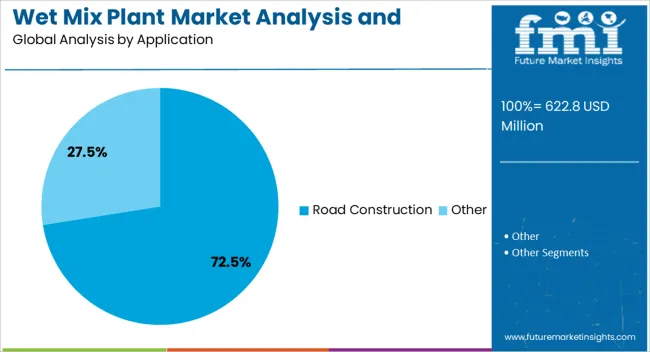
The road construction segment holds the largest share in the application category, representing approximately 72.50% of the Indian wet mix plant market. Growth in this segment is reinforced by large-scale investments in national and state highways, rural connectivity programs, and urban mobility projects.
Wet mix plants are indispensable for producing high-quality base materials that ensure road durability and performance. The segment’s growth is further supported by the government’s focus on expanding the road network under initiatives such as Bharatmala Pariyojana and Pradhan Mantri Gram Sadak Yojana.
With rising demand for durable road infrastructure and continued investment in transportation projects, the road construction segment is expected to remain the primary driver of the Indian wet mix plant market.
Revenue to Expand Around 1.5X through 2035
The wet mix plant industry revenue is set to expand around 1.5X through 2035, amid a 2.5% rise in expected CAGR compared to the historical one. This is due to the expanding road network infrastructure, growing demand for advanced technologies, and increased industrialization.
Other Factors Boosting Wet Mix Plant Market Growth Include
As per the latest analysis, East Asia is anticipated to emerge as the most lucrative pocket for wet mix plant manufacturers during the assessment period. It is set to hold around 32.4% of the global wet mix plant industry share in 2035. This is attributed to the following factors:
Road Construction Remains the Most Remunerative Application for Wet Mix Plants
As per the latest global and India wet mix plant market analysis, the road construction segment is projected to dominate the market, holding a volume share of about 93.6% in 2025. This is attributable to the ever-increasing demand for road construction and increasing need for novel road construction technologies.
Constituting a substantial market share, road construction demands efficient, high-capacity solutions for infrastructure development. With their versatility and ability to produce consistent and high-quality mixes, wet mix plants play a crucial role in meeting the rigorous requirements of road construction projects.
The wet mix plant industry is poised to grow steadily during the forecast period. This is due to rising usage of these plants in road and dam construction applications.
With a strong emphasis on durability and high-quality construction, manufacturers are establishing a global presence, exploring export opportunities, and expanding their network of channel partners. They are investing in research and development to enhance plant efficiency and productivity.
Wet mix plant manufacturers are also incorporating advanced technologies, including remote monitoring and real-time reporting, to enhance plant efficiency. The market is witnessing global expansion, with manufacturers exploring export opportunities and establishing international networks.
The need for reliable wet mix plants that offer customization, quick delivery, and robust after-sales support is evident. As governments prioritize infrastructure development and project owners seek long-lasting road solutions, manufacturers are keen on optimizing production processes for cost-effective solutions.
There is an increasing trend among contractors and project owners to opt for wet mix macadam in road construction. This is due to a greater emphasis on the durability and quality of road infrastructure.
The superior attributes of wet mix, such as quick drying, durability, and efficient base layer creation, make it a preferred choice over conventional methods like water-bound macadam. This trend is expected to drive the demand for wet mix plants that can meet the specifications for durable road construction.
The demand for wet mix plants is influenced by the industry's adoption of advanced technologies. Contractors and construction companies seek plants equipped with remote monitoring systems, real-time reporting, and advanced human-machine interface (HMI) controls.
The integration of technology not only enhances operational efficiency but also aligns with the broader trend of modernizing construction practices. Hence, ongoing advancements in wet mix plants will likely play a key role in fostering growth of the wet mix plant industry through 2035.
Sales of wet mix plants grew at a sluggish CAGR of 1.4% between 2020 and 2025. Total market revenue reached about USD 622.8 million in 2025. In the assessment period, the wet mix plant industry is set to thrive at a CAGR of 3.9%.
| Historical CAGR (2020 to 2025) | 1.4% |
|---|---|
| Forecast CAGR (2025 to 2035) | 3.9% |
The market for wet mix plants witnessed slow growth between 2020 and 2025. This was due to reduced construction activities and economic uncertainties brought on by the COVID-19 pandemic.
Amid lockdowns, there was a significant decrease in road construction activities during the historical period. This decreased the demand for road construction equipment, including wet mix plants.
Future Scope of the Wet Mix Macadam Plant Market
With the resumption of construction activities, the wet mix plant industry is projected to expand steadily during the forecast period. It will likely total a valuation of USD 913 million by 2035.
Rapid industrialization and increasing investments in road infrastructure are expected to positively impact sales of wet mix plants. Similarly, rising emphasis on sustainable and eco-friendly manufacturing practices and growing demand for industrial wet mix macadam plants will likely foster growth.
Rising Demand for Residential and Commercial Structures
With populations flocking to urban areas, there is an imperative need for constructing housing complexes, commercial spaces, and associated infrastructure. Wet mix plants emerge as pivotal players in meeting this escalating demand, offering an efficient and dependable means of producing high-quality construction materials.
Wet mix plants are essential for building durable roads, pavements, and foundational layers of structures, contributing to the development of robust and enduring buildings. The adaptability of wet mix plants makes them indispensable across a diverse range of construction projects.
The construction industry's dynamic nature, particularly in urbanizing regions, ensures an ongoing demand for wet mix plant services. Construction companies rely on these plants to ensure a continuous supply of top-notch materials, allowing them to keep pace with the swift development of residential and commercial infrastructure.
Government-led Infrastructural Growth
Government initiatives for road construction and infrastructural development stand out as pivotal drivers for the wet mixing plant industry. Recognizing the integral role of robust infrastructure in fostering economic growth and elevating the quality of life, governments are actively investing in these sectors.
Road construction takes center stage in many government agendas due to its profound impact on transportation networks. Wet mix plants play a crucial role in this domain by producing essential base and sub-base materials.
Wet mix plants contribute to the creation of durable and high-performance roadways. The use of wet mix ensures superior load-bearing capacity, increased resistance to wear and tear, and enhanced overall road performance.
Government backing not only validates the significance of wet mix plants but also provides a stable and lucrative market for manufacturers and operators. The Indian government, for example, has embarked on major initiatives like the Bharatmala Pariyojana.
Bharatmala Pariyojana project is aimed at upgrading and expanding the road network, including the construction of expressways and economic corridors. Notably, 60% of the projects under this initiative are envisaged on the hybrid annuity model (HAM), showcasing the diverse opportunities for collaboration between the public and private sectors in infrastructural development.
Growing Emphasis on Uniform Mixing and Segregation-free Material Delivery
Another key factor driving the target industry is the heightened demand for plants capable of ensuring uniform mixing and seamless delivery of wet mix materials without segregation. This imperative is a direct response to the escalating emphasis on quality assurance in construction projects, where the consistent composition of materials significantly contributes to the overall durability and regulatory compliance of the infrastructure.
Achieving precise and uniform mixtures is critical for ensuring the structural integrity of the end product in construction projects. Wet mix plants that effectively address the challenge of material segregation are increasingly preferred. These plants play a pivotal role in preventing uneven distribution of aggregates and binders, safeguarding the strength and longevity of the constructed infrastructure.
Stringent Environmental Regulations
The wet mixing plant market faces a significant restraint due to stringent environmental regulations. Similarly, escalating concerns regarding the ecological impact of construction activities may limit market growth.
Governments and environmental agencies are intensifying their focus on promoting sustainable and eco-friendly practices within the construction industry. They aim to align with evolving environmental expectations and mitigate the environmental footprint linked to infrastructure development. This is projected to negatively impact the target market.
Like other construction equipment, wet mix plants possess the potential to contribute to environmental degradation through factors such as dust emissions and energy consumption. To comply with strict regulations, operators of wet mix plants must invest in advanced technologies and practices that effectively mitigate these environmental impacts.
Implementing measures for dust control, noise reduction, and responsible waste disposal introduces operational complexity and additional costs to wet mix plant setups. This is anticipated to significantly influence the overall market performance.
The necessity to adhere to stringent environmental standards not only influences operational aspects but may also necessitate fundamental changes in traditional construction practices. This transformative impact is projected to reshape the way wet mix plants operate and underscores the industry's commitment to aligning with global sustainability goals.
As environmental regulations continue to evolve, the demand for environmentally responsible wet mix plant solutions is expected to grow. They is anticipated to trigger innovation and drive the adoption of eco-friendly practices across the wet mixing plant industry.
Operational Challenges
Operational complexities stemming from the need to implement measures for dust control, noise reduction, and responsible waste disposal are becoming a key hurdle for the market. While these measures are crucial for environmental compliance, they introduce intricacies that impact the efficiency and cost-effectiveness of wet mix plant setups.
Mitigating dust emissions, curbing noise pollution, and ensuring responsible waste disposal require meticulous planning and execution. This, in turn, is set to contribute to the operational intricacies faced by wet mix plant operators.
The integration of advanced technologies and practices to meet stringent environmental standards not only adds a layer of complexity to daily operations but also necessitates ongoing monitoring and adjustments. These operational complexities pose challenges to the seamless functioning of wet mix plants, impacting their overall efficiency and cost-effectiveness.
As the industry grapples with these operational intricacies, finding innovative solutions to streamline processes while maintaining environmental compliance is expected to be essential. This underscores the market's need for adaptive strategies that balance sustainability and operational efficiency in wet mixing plant setups.
The table below highlights the wet mix plant revenue in prominent states in India. Maharashtra, Delhi & NCR, and Uttar Pradesh are expected to remain the top three consumers of wet mix plants, with expected valuations of USD 913.0 million, USD 5.913 million, and USD 4.9 million, respectively, in 2035. Increasing demand for road construction machinery in these states will likely foster growth of the India wet mix plant industry.
| States | Projected Revenue (2035) |
|---|---|
| Maharashtra | USD 913.0 million |
| Delhi & NCR | USD 5.913 million |
| Uttar Pradesh | USD 4.9 million |
| Madhya Pradesh | USD 4.1 million |
| Gujrat | USD 3.5 million |
The table below shows the estimated growth rates of the top five states in India. Telangana, Odisha, and Chhattisgarh are set to record high CAGRs of 5.9%, 5.8%, and 5.5%, respectively, through 2035.
| States | Projected Wet Mix Plants CAGR (2025 to 2035) |
|---|---|
| Telangana | 5.9% |
| Odisha | 5.8% |
| Chhattisgarh | 5.5% |
| Andhra Pradesh | 5.4% |
| West Bengal | 5.1% |
Maharashtra wet mix plant industry size is anticipated to reach USD 913.0 million by 2035. Sales of wet mix plants in Maharashtra are projected to surge at a CAGR of around 5.1% during the assessment period, driven by the adoption of both continuous mixing and batch mixing technologies, primarily for road construction.
The diverse application of wet mix plants ensures efficient and high-quality infrastructure development. They significantly contribute to the state's rapid industrial and economic expansion.
A dynamic industrial landscape, bustling economy, and strategic geographic location underpin Maharashtra's robust growth. The state's commitment to infrastructure development, especially in road construction, fuels the demand for wet mix plants.
The state government is striving hard to modernize and expand its infrastructure for economic growth and development. As a result, Maharashtra is expected to present lucrative growth opportunities to both regional and international wet mix plant manufacturers.
Delhi & NCR wet mix plant industry is poised to register steady growth, totaling a valuation of USD 5.913 million by 2035. Over the forecast period, demand for wet mix plants in Delhi & NCR is predicted to rise at a 4.3% CAGR, owing to the expanding road construction sector.
The robust growth of the road construction sector in Delhi & NCR has become a pivotal driver for the wet mix plant industry. The increasing demand for infrastructure development, especially in road networks, has led to a surge in the adoption of wet mix plants, emphasizing efficiency and quality in construction projects.
The Delhi & NCR region, serving as the capital of India, showcases a dynamic economic landscape. The thriving infrastructure development, propelled by government initiatives and private investments, has positioned the region as a significant contributor to the national economy.
The rapid economic strength serves as a catalyst propelling demand for advanced construction technologies, including automatic wet mix plants in Delhi. These plants play a crucial role in meeting the region's rising requirements for road construction projects.
The below section shows the stationary segment dominating the wet mix plant industry. It is projected to rise at a 3.8% CAGR between 2025 and 2035. Based on plant type, the continuous mixing segment will likely record a CAGR of 3.7% through 2035.
| Top Segment (Product Type) | Stationary |
|---|---|
| Predicted CAGR (2025 to 2035) | 3.8% |
As per the latest report, demand remains high for stationary wet mix plants across India and other nations. This is due to several advantages of stationary wet mix plants, including their versatility, high production capacity, lower operating cost.
Stationary wet mix plants are suitable for a wide range of projects, especially large-scale ones, with consistent concrete requirements, owing to their versatility. Their demand is expected to rise steadily across nations like India amid expanding road infrastructure.
With varied capacity options, ranging from below 100 TPH to above 500 TPH, stationary plants offer flexibility, efficiency, and consistency in meeting the diverse demands of road construction and other applications. Their stable and continuous operation makes them a preferred choice, ensuring seamless integration into large-scale infrastructure projects.
The stationary mixing segment is projected to advance at a 3.8% CAGR during the assessment period. It will likely have a total valuation of USD 913 million by 2035.
In contrast, the mobile segment holds a smaller market share and experiences lower demand than stationary plants. While mobile wet mix plants offer mobility advantages, their application is constrained and primarily suited for specific projects.
| Top Segment (Plant Type) | Continuous Mixing |
|---|---|
| Projected CAGR (2025 to 2035) | 3.7% |
Based on plant type, the wet mix plant industry is segmented into continuous mixing and batch mixing. Among these, the continuous mixing segment is expected to lead the market, totaling a valuation of USD 652.1 million by 2035. Over the forecast period, demand for continuous wet mixing plants is set to rise at a 3.7% CAGR.
Continuous mixing plants have become highly sought-after due to their seamless, non-stop production capabilities. These plants are preferred for large-scale projects like road construction, offering advantages in terms of efficiency, uniformity, and reduced production time.
The ability of continuous wet mix plants to handle varying workloads and deliver consistent output positions them as the frontrunners in the market. These versatile plants are designed for high-volume production of asphalt mixtures. They are projected to operate continuously, unlike batch wet mix plants that produce discrete batches of material.
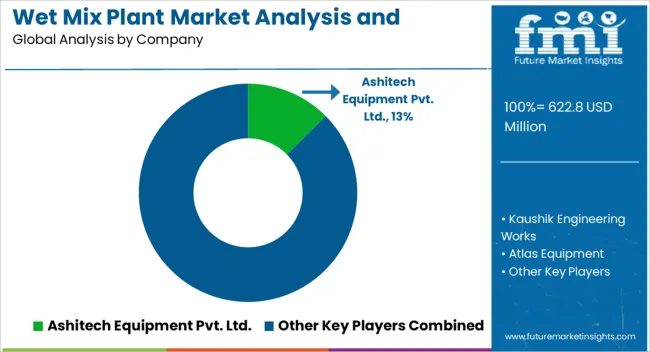
The wet mix plant market is moderately consolidated, with leading players accounting for about 25% to 30% share. Ashitech Equipment Pvt. Ltd., Kaushik Engineering Works, Atlas Equipment, Macons Equipments Pvt Ltd, Apollo Inffratech Group, FABHIND, Speedcrafts Ltd., LYROAD Machinery, Topcon Engineering, Lintec & Linnhoff, Capious Roadtech Pvt. Ltd., Aapsa Equipment, Himalaya Engineering, Solmec Earthmover, Everest Road Equipments Pvt. Ltd., Dhruvi Road Equipment Private Limited, Nilang Asphalt Equipments Pvt. Ltd., Leo Road Equipments, Ashok Road Construction Equipment Pvt Ltd., Plus Engineers, UNIVERSAL ENGINEERS, Coninfera, and Vinayak Asphalt & Concrete Equipment are the leading wet mix plant manufacturers worldwide.
Top wet mix plant companies are striving to develop new solutions to meet growing end-user demand across countries like India. They are also implementing strategies such as facility expansions, collaborations, mergers, partnerships, and acquisitions to solidify their market positions.
Recent Wet Mix Plant Market Developments
| Attribute | Details |
|---|---|
| Estimated Market Size (2025) | USD 622.8 million |
| Projected Market Size (2035) | USD 913.0 million |
| Anticipated Growth Rate (2025 to 2035) | 3.9% |
| Historical Data | 2020 to 2025 |
| Forecast Period | 2025 to 2035 |
| Quantitative Units | Value (USD million) and Volume (Units) |
| Report Coverage | Revenue Forecast, Volume Forecast, Company Ranking, Competitive Landscape, Growth Factors, Trends, and Pricing Analysis |
| Market Segments Covered | Product Type, Plant Type, Application, Region |
| Regions Covered | North America; Latin America; Western Europe; Eastern Europe; East Asia; South Asia Pacific; Middle East & Africa; North India; East India; West India; South India |
| Key States Covered | Delhi & NCR, Rajasthan, Punjab, Uttar Pradesh, West India, Maharashtra, Gujrat, Madhya Pradesh, Rest of West India, East India, West Bengal, Odisha, Chhattisgarh, Rest of East India, South India, Karnataka, Tamil Nadu, Andhra Pradesh, Telangana, Rest of South India |
| Key Companies Profiled | Ashitech Equipment Pvt. Ltd.; Kaushik Engineering Works; Atlas Equipment; Macons Equipments Pvt Ltd; Apollo Inffratech Group; FABHIND; Speedcrafts Ltd.; LYROAD Machinery; Topcon Engineering; Lintec & Linnhoff; Capious Roadtech Pvt. Ltd.; Aapsa Equipment; Himalaya Engineering; Solmec Earthmover; Everest Road Equipments Pvt. Ltd.; Dhruvi Road Equipment Private Limited; Nilang Asphalt Equipments Pvt. Ltd; Leo Road Equipments; Ashok Road Construction Equipment Pvt Ltd; Plus Engineers; UNIVERSAL ENGINEERS; Coninfera; Vinayak Asphalt & Concrete Equipment |
The global wet mix plant market analysis and opportunity assessment in india is estimated to be valued at USD 622.8 million in 2025.
The market size for the wet mix plant market analysis and opportunity assessment in india is projected to reach USD 913.0 million by 2035.
The wet mix plant market analysis and opportunity assessment in india is expected to grow at a 3.9% CAGR between 2025 and 2035.
The key product types in wet mix plant market analysis and opportunity assessment in india are stationary, _below 100 tph, _100 to 300 tph, _300 to 500 tph, _above 500 tph, mobile, _below 100 tph and _above 100 tph.
In terms of plant type, continuous mixing segment to command 57.8% share in the wet mix plant market analysis and opportunity assessment in india in 2025.


Full Research Suite comprises of:
Market outlook & trends analysis
Interviews & case studies
Strategic recommendations
Vendor profiles & capabilities analysis
5-year forecasts
8 regions and 60+ country-level data splits
Market segment data splits
12 months of continuous data updates
DELIVERED AS:
PDF EXCEL ONLINE
Wet Food for Cat Market Size and Share Forecast Outlook 2025 to 2035
Wet Food Pouch Market Size and Share Forecast Outlook 2025 to 2035
Wet Process Equipment Market Size and Share Forecast Outlook 2025 to 2035
Wet Vacuum Pumps Market Size and Share Forecast Outlook 2025 to 2035
Wet Electrostatic Precipitator Market Size and Share Forecast Outlook 2025 to 2035
Wet Pet Food Market Analysis - Size, Share, and Forecast Outlook 2025 to 2035
Wet Vacuum Cleaner Market Size and Share Forecast Outlook 2025 to 2035
Wet Strength Paper Market Analysis - Size, Share, and Forecast Outlook 2025 to 2035
Wet Wipes Canister Market - Demand & Forecast 2025 to 2035
Wetsuit Market Trends - Growth, Demand & Forecast 2025 to 2035
Wet Wipes Market - Trends & Forecast 2025 to 2035
Wet Fertilizer Spreaders Market
Wetting Agent Market Size and Share Forecast Outlook 2025 to 2035
Wet Ink Coding Machines Market
Wet Glue Labelling Machines Market
Burn-Wet Gas Abatement System Market Size and Share Forecast Outlook 2025 to 2035
Corn Wet Milling Services Market Size, Growth, and Forecast for 2025 to 2035
Canned Wet Cat Food Market Size and Share Forecast Outlook 2025 to 2035
Thermal-Wet Gas Abatement System Market Size and Share Forecast Outlook 2025 to 2035
Dry and Wet Wipes Market Size and Share Forecast Outlook 2025 to 2035

Thank you!
You will receive an email from our Business Development Manager. Please be sure to check your SPAM/JUNK folder too.
Chat With
MaRIA