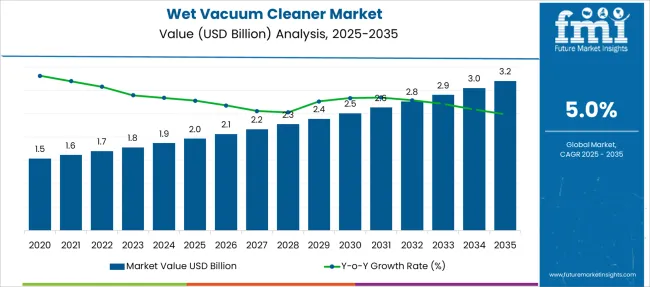
The Wet Vacuum Cleaner Market is estimated to be valued at USD 2.0 billion in 2025 and is projected to reach USD 3.2 billion by 2035, registering a compound annual growth rate (CAGR) of 5.0% over the forecast period.
| Metric | Value |
|---|---|
| Wet Vacuum Cleaner Market Estimated Value in (2025 E) | USD 2.0 billion |
| Wet Vacuum Cleaner Market Forecast Value in (2035 F) | USD 3.2 billion |
| Forecast CAGR (2025 to 2035) | 5.0% |
The wet vacuum cleaner market is experiencing steady growth driven by increased demand in commercial cleaning applications and the need for efficient maintenance solutions. Growing awareness of hygiene standards in offices, retail spaces, and industrial environments has led to the adoption of reliable wet cleaning equipment.
Technological advancements have improved the performance, durability, and ease of use of wet vacuum cleaners, enhancing their appeal to facility managers and cleaning service providers. The expansion of commercial infrastructure and stricter regulations regarding workplace cleanliness have further fueled market growth.
Additionally, sales channels such as hypermarkets and supermarkets have broadened product accessibility, making these cleaners available to a wider customer base. Moving forward, the market is expected to grow with innovations targeting energy efficiency, noise reduction, and multifunctional cleaning capabilities. Segmental growth is projected to be led by wired wet vacuum cleaners in product type, commercial sector applications, and hypermarket/supermarket sales channels.
The market is segmented by Product Type, Application, and Sales Channels and region. By Product Type, the market is divided into Wired and Cordless. In terms of Application, the market is classified into Commercial sector and Household sector. Based on Sales Channels, the market is segmented into Hypermarket/Supermarket, Specialty stores, and E-commerce. Regionally, the market is classified into North America, Latin America, Western Europe, Eastern Europe, Balkan & Baltic Countries, Russia & Belarus, Central Asia, East Asia, South Asia & Pacific, and the Middle East & Africa.
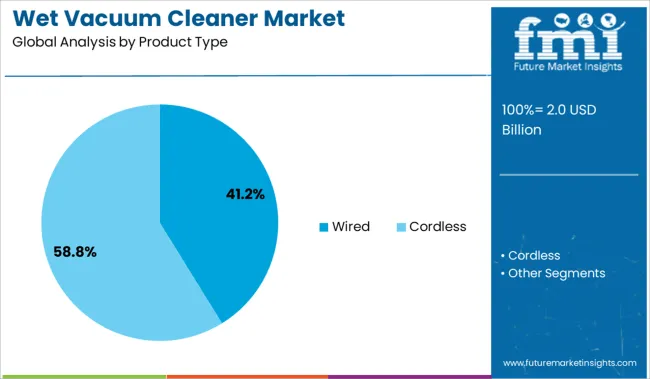
The wired wet vacuum cleaner segment is expected to hold 41.2% of the market revenue in 2025, retaining its leading position among product types. This preference is largely due to the consistent power supply that wired models provide, ensuring uninterrupted cleaning performance in large commercial areas.
Wired vacuum cleaners are favored in settings where extended use and high suction power are essential. Their reliability and typically longer operational time make them suitable for professional cleaning tasks.
While cordless models offer portability, wired vacuum cleaners continue to dominate due to their cost-effectiveness and suitability for heavy-duty cleaning requirements. As commercial spaces demand rigorous maintenance, wired wet vacuum cleaners are expected to sustain their market leadership.
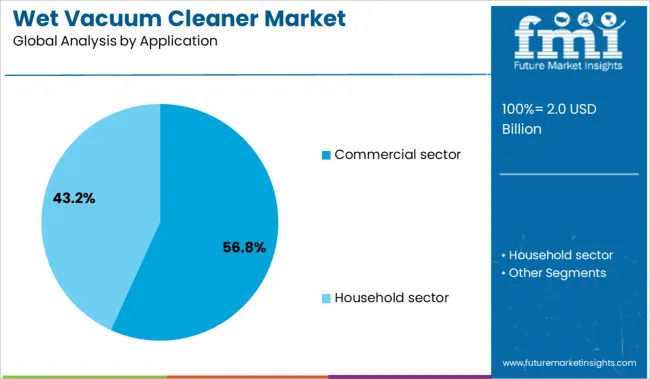
The commercial sector segment is projected to contribute 56.8% of the wet vacuum cleaner market revenue in 2025, securing its position as the dominant application area. Growth in this segment has been fueled by expanding commercial real estate, including offices, shopping centers, and industrial facilities.
The need for efficient cleaning solutions that can handle wet spills and debris in high-traffic environments has increased demand. Facility management teams prioritize wet vacuum cleaners to maintain hygiene and safety standards, minimizing downtime caused by water accumulation or hazardous spills.
Regulatory emphasis on workplace cleanliness and health has also encouraged the use of wet vacuum cleaners in commercial settings. The segment is expected to continue leading as commercial infrastructure development accelerates globally.
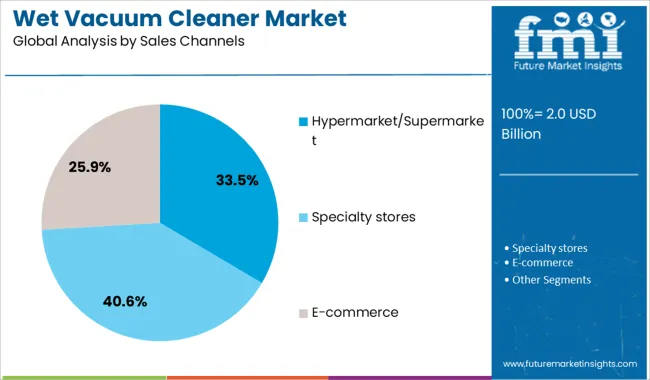
The hypermarket/supermarket sales channel segment is projected to account for 33.5% of the wet vacuum cleaner market revenue in 2025, maintaining its role as a key distribution avenue. The accessibility and convenience offered by these retail formats attract both professional buyers and individual consumers.
Hypermarkets and supermarkets provide broad product assortments, promotional discounts, and in-store customer support, which influence purchase decisions. These channels have also become important for reaching small businesses and residential customers seeking reliable cleaning solutions.
The growth of organized retail in urban and suburban regions has further strengthened this distribution channel. As consumer preference for in-person product experience remains strong, hypermarkets and supermarkets are expected to retain their significant share in wet vacuum cleaner sales.
Some of the significant drivers contributing to the drenched Hoover sales are changing end-user demand and rising hygiene concerns in both the residential and commercial sectors, as well as the advent of DIY applications and the need to maintain cleanliness, particularly in commercial sectors.
Sales of wet vacuum cleaners have had a long-running win-fail cycle due to their use mostly for fine chores in business areas, which has been a long-standing issue for manufacturers. Sales of wet vacuum cleaners are predicted to increase as technology advances, allowing for more advanced capabilities and the availability of smaller models.
The drenched Hoover sales were severely impacted, along with many other industries, due to the lockdown forced in every country.
Close down of unimportant industries, lack in demand from customers, further delay in the production of goods due to lack of employees, and so on in order to control the spread of the deadly virus, and thus, led to loss and decline in wet vacuum cleaner market.
The existence of multiple suppliers on e-commerce platforms has permitted one of the fastest eras for the development of sales of wet vacuum cleaners. Demand for a wet vacuum cleaner is expanding, as customers will be more likely to buy wet vacuum cleaners if they have easy access to them, as well as a variety of offers and discounts on electrical devices. Furthermore, manufacturers are investing in Research and Development facilities to improve the wet vacuum cleaners' market share and to make them available in compact dimensions and low weight.
Manufacturers are also concentrating on manufacturing vacuum cleaners with HEPA filters, which are readily available aftermarket, to improve the demand for wet vacuum cleaners. Additionally, the wet vacuum cleaners are equipped with cutting-edge technologies such as Bluetooth and remote control access to make work easier and increase sales of wet vacuum cleaners.
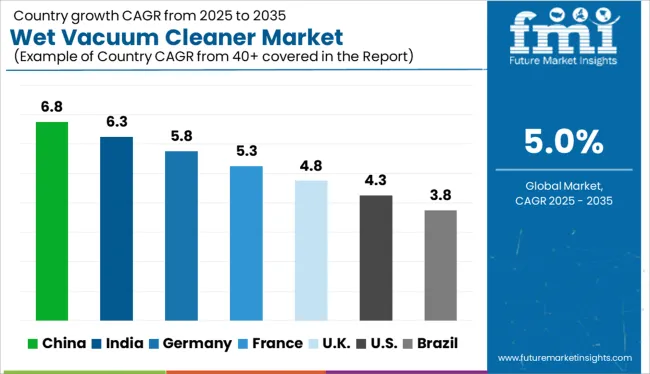
The USA is one of the world's major wet vacuum cleaner markets. During the forecast period 2024 to 2035, sales of wet vacuum cleaners in the USA are expected to follow the traditional pattern of boom and bust. With the advent of robotic hoovers backed by modern technology and Research and Development initiatives, demand for a wet vacuum cleaner is expected to rise.
Europe has been one of the largest Research and Development hubs in the world since the lifting of the lockdown, and because of their great flexibility and viability, which makes corner cleaning of spaces easier, which leads to increased sales of wet vacuum cleaners.
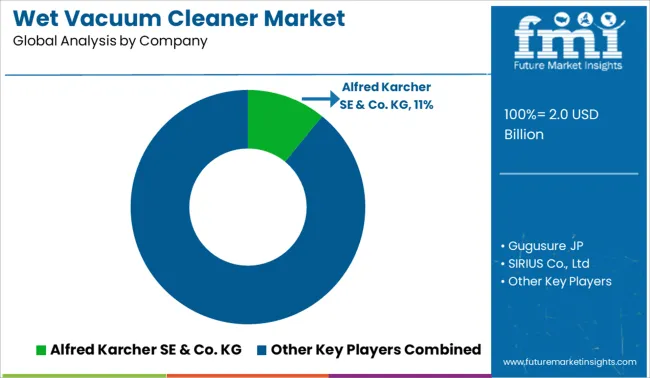
Alfred Karcher SE &Co. KG, Makita Corporation, Milwaukee Tool (Techtronic Industries Company Limited), Panasonic Corporation, Nilfisk Industrial Vacuum, Tennant Company, Numatic International Ltd, Wessel werk Gmbh, Renesas Electronic Corporation, and TOSHIBA CORPORATION are some of the leading manufacturers and suppliers of wet vacuum cleaners.
| Report Attribute | Details |
|---|---|
| Growth rate | CAGR of 5% from 2025 to 2035 |
| The base year for estimation | 2024 |
| Historical data | 2020 to 2024 |
| Forecast period | 2025 to 2035 |
| Quantitative units | Revenue in USD billion, volume in kilotons, and CAGR from 2025 to 2035 |
| Report Coverage | Revenue forecast, volume forecast, company ranking, competitive landscape, growth factors, and trends, Pricing Analysis |
| Segments Covered | Application, technology, type, region |
| Regional scope | North America; Western Europe; Eastern Europe; Middle East; Africa; ASEAN; South Asia; Rest of Asia; Australia; and New Zealand |
| Country scope | USA, Canada, Mexico, Germany, United Kingdom, France, Italy, Spain, Russia, Belgium, Poland, Czech Republic, China, India, Japan, Australia, Brazil, Argentina, Colombia, Saudi Arabia, United Arab Emirates(UAE), Iran, South Africa |
| Key companies profiled | Alfred Karcher SE & Co. KG; Makita Corporation; Milwaukee Tool (Techtronic Industries Company Limited); Panasonic Corporation; Nilfisk Industrial Vacuum; Tennant Company; Numatic International Ltd.; Wessel werk Gmbh; Renesas Electronic Corporation; TOSHIBA CORPORATION; MOOSOO; SIRIUS Co.; Ltd.; Gugusure JP |
| Customization scope | Free report customization (equivalent to up to 8 analysts' working days) with purchase. Addition or alteration to country, regional & segment scope. |
| Pricing and purchase options | Avail customized purchase options to meet your exact research needs. |
The global wet vacuum cleaner market is estimated to be valued at USD 2.0 billion in 2025.
The market size for the wet vacuum cleaner market is projected to reach USD 3.2 billion by 2035.
The wet vacuum cleaner market is expected to grow at a 5.0% CAGR between 2025 and 2035.
The key product types in wet vacuum cleaner market are wired and cordless.
In terms of application, commercial sector segment to command 56.8% share in the wet vacuum cleaner market in 2025.


Our Research Products

The "Full Research Suite" delivers actionable market intel, deep dives on markets or technologies, so clients act faster, cut risk, and unlock growth.

The Leaderboard benchmarks and ranks top vendors, classifying them as Established Leaders, Leading Challengers, or Disruptors & Challengers.

Locates where complements amplify value and substitutes erode it, forecasting net impact by horizon

We deliver granular, decision-grade intel: market sizing, 5-year forecasts, pricing, adoption, usage, revenue, and operational KPIs—plus competitor tracking, regulation, and value chains—across 60 countries broadly.

Spot the shifts before they hit your P&L. We track inflection points, adoption curves, pricing moves, and ecosystem plays to show where demand is heading, why it is changing, and what to do next across high-growth markets and disruptive tech

Real-time reads of user behavior. We track shifting priorities, perceptions of today’s and next-gen services, and provider experience, then pace how fast tech moves from trial to adoption, blending buyer, consumer, and channel inputs with social signals (#WhySwitch, #UX).

Partner with our analyst team to build a custom report designed around your business priorities. From analysing market trends to assessing competitors or crafting bespoke datasets, we tailor insights to your needs.
Supplier Intelligence
Discovery & Profiling
Capacity & Footprint
Performance & Risk
Compliance & Governance
Commercial Readiness
Who Supplies Whom
Scorecards & Shortlists
Playbooks & Docs
Category Intelligence
Definition & Scope
Demand & Use Cases
Cost Drivers
Market Structure
Supply Chain Map
Trade & Policy
Operating Norms
Deliverables
Buyer Intelligence
Account Basics
Spend & Scope
Procurement Model
Vendor Requirements
Terms & Policies
Entry Strategy
Pain Points & Triggers
Outputs
Pricing Analysis
Benchmarks
Trends
Should-Cost
Indexation
Landed Cost
Commercial Terms
Deliverables
Brand Analysis
Positioning & Value Prop
Share & Presence
Customer Evidence
Go-to-Market
Digital & Reputation
Compliance & Trust
KPIs & Gaps
Outputs
Full Research Suite comprises of:
Market outlook & trends analysis
Interviews & case studies
Strategic recommendations
Vendor profiles & capabilities analysis
5-year forecasts
8 regions and 60+ country-level data splits
Market segment data splits
12 months of continuous data updates
DELIVERED AS:
PDF EXCEL ONLINE
Wet Cleaning Ozone Water System Market Size and Share Forecast Outlook 2025 to 2035
Wet Food for Cat Market Size and Share Forecast Outlook 2025 to 2035
Wet Food Pouch Market Size and Share Forecast Outlook 2025 to 2035
Wetting Agent Market Size and Share Forecast Outlook 2025 to 2035
Wet Mix Plant Market Analysis and Opportunity Assessment in India Size and Share Forecast Outlook 2025 to 2035
Wet Process Equipment Market Size and Share Forecast Outlook 2025 to 2035
Wet Electrostatic Precipitator Market Size and Share Forecast Outlook 2025 to 2035
Wet Pet Food Market Analysis - Size, Share, and Forecast Outlook 2025 to 2035
Wet Strength Paper Market Analysis - Size, Share, and Forecast Outlook 2025 to 2035
Wet Wipes Canister Market - Demand & Forecast 2025 to 2035
Wetsuit Market Trends - Growth, Demand & Forecast 2025 to 2035
Wet Wipes Market - Trends & Forecast 2025 to 2035
Wet Glue Labelling Machines Market
Wet Fertilizer Spreaders Market
Wet Ink Coding Machines Market
Wet Vacuum Pumps Market Size and Share Forecast Outlook 2025 to 2035
Burn-Wet Gas Abatement System Market Size and Share Forecast Outlook 2025 to 2035
Corn Wet Milling Services Market Size, Growth, and Forecast for 2025 to 2035
Canned Wet Cat Food Market Size and Share Forecast Outlook 2025 to 2035
Thermal-Wet Gas Abatement System Market Size and Share Forecast Outlook 2025 to 2035

Thank you!
You will receive an email from our Business Development Manager. Please be sure to check your SPAM/JUNK folder too.
Chat With
MaRIA