Reports

- Global Locations -

Headquarters

Future Market Insights, Inc.

Christiana Corporate, 200
Continental Drive, Suite 401,
Newark, Delaware - 19713,
United States

T: +1-845-579-5705

Americas

Future Market Insights, Inc.

616 Corporate Way, Suite 2-9018,
Valley Cottage, NY 10989, United States

T: +1-347-918-3531

MEA

Future Market Insights

1602-6 Jumeirah Bay X2 Tower, Plot No: JLT-PH2-X2A,
Jumeirah Lakes Towers, Dubai,
United Arab Emirates

Europe

Future Market Insights

3rd Floor, 207 Regent Street,
W1B 3HH London
United Kingdom

T: + 44 (0) 20 8123 9659
D: +44 (0) 20 3287 4268

Asia Pacific

Future Market Insights

IndiaLand Global Tech Park, Unit UG-1, Behind Grand HighStreet, Phase 1, Hinjawadi, MH, Pune – 411057, India

Vacuum-sealed Packaging Market Outlook

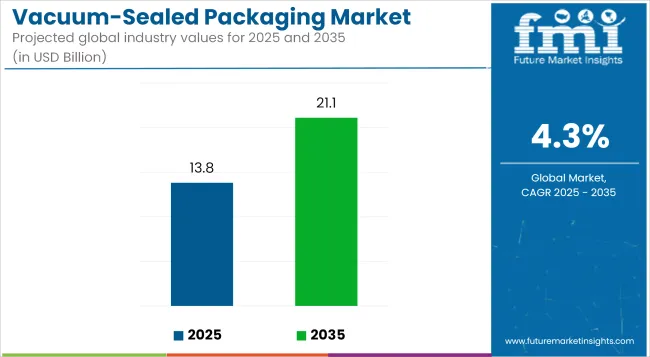
The vacuum-sealed packaging market is projected to be worth US$ 13.2 billion in 2024. Vacuum-sealed packaging sales are anticipated to witness a CAGR of 4.3%, reaching US$ 20.1 billion by 2034.

The demand for vacuum-sealed packaging has evolved steadily due to rising consumer demand for longer product shelf lives, better product freshness and preservation. Enhancing consumer consciousness regarding sustainability and reducing food waste promotes the adoption of vacuum-sealed packaging.

Attributes Details
Market Value for 2024 US$ 13.2 billion
Market Value for 2034 US$ 20.1 billion
Market CAGR from 2024 to 2034 4.3%

Don't pay for what you don't need

Customize your report by selecting specific countries or regions and save 30%!

Decoding the Factors Driving Vacuum-sealed Packaging Adoption

  • Vacuum-sealed packaging is becoming more widely used in sectors other than traditional ones, like electronics, pharmaceuticals, and industrial components. This diversification aids in the market expansion for vacuum-sealed packaging.
  • The vacuum-sealed packaging demand is influenced by growing consumer knowledge of the advantages of vacuum-sealed packaging, such as enhanced product freshness and decreased food waste.
  • The vacuum-sealed packaging market is expanding due to advancements in technology and packaging materials, which make it possible to create more affordable and environmentally friendly solutions.
  • The adoption of vacuum-sealed packaging is growing due to increased awareness of food safety laws and the requirement to adhere to packaging standards, particularly in sectors where preserving product integrity is essential.

Factors Impacting the Growth of Vacuum-sealed Packaging

  • Concerns about environmental sustainability may arise from the materials used in vacuum-sealed packaging, such as some plastic varieties. The vacuum-sealed packaging market is pressured to use more environmentally friendly products and lessen their environmental impact.
  • Consumers need to comprehend the advantages of vacuum-sealed packaging fully. The technology's broad market acceptance may need to be improved by opinions that it is redundant and complex.
  • Alternative packaging technologies and solutions that provide comparable advantages compete with the vacuum-sealed packaging market. The vacuum-sealed packaging industry must constantly innovate to remain competitive and meet changing demands.
  • The equipment and materials required for vacuum-sealed packaging technology are often specialized, raising initial setup costs. The vacuum-sealed packaging startups might be reluctant to invest in these solutions.
Ismail Sutaria
Ismail Sutaria

Principal Consultant

Talk to Analyst

Find your sweet spots for generating winning opportunities in this market.

Insights into the Vacuum-sealed Packaging Market's Past Performance from 2019 to 2023 and Future Trajectory from 2024 to 2034

The vacuum-sealed packaging market expanded rapidly between 2019 and 2023, primarily due to rising consumer demand for longer product shelf lives and freshness preservation. Technological and material innovations were crucial in raising the efficiency of the vacuum-sealed packaging bag market.

The vacuum-sealed packaging machine market's future is likely to be shaped by developments expected in environmentally friendly packaging materials and increased consciousness of environmental impact.

Expanding consumer preferences for convenience and health-conscious options are anticipated to dominate the vacuum-sealed packaging industry, making it an essential vendor in the global packaging landscape.

Attributes Details
Market Value for 2019 US$ 11.8 billion
Market Value for 2023 US$ 12.7 billion
Market CAGR from 2019 to 2023 1.9%

Growth Avenues in the Vacuum-sealed Packaging Market

  • The packaging industry has changed as a result of e-commerce's growth. To promote safe and effective delivery, vacuum-sealed packaging providers can customize their packaging solutions to meet the unique needs of the e-commerce industry.
  • Vacuum-sealed packaging can help reduce food waste by delaying spoiling, especially in light of the current global focus on sustainability. The vacuum-sealed packaging manufacturers highlighting the environmental benefits and promoting eco-friendly packaging options can profit from this trend.
  • Ongoing advancements in materials science present opportunities to develop more economical and environmentally friendly vacuum-sealed packaging solutions. To comply with consumer preferences for environmentally friendly packaging, businesses can investigate using recyclable and biodegradable materials. This boosts the sales of vacuum-sealed packaging solutions.

Get the data you need at a Fraction of the cost

Personalize your report by choosing insights you need
and save 40%!

Comparative View of Adjacent Vacuum-sealed Packaging Market

The section provides comparative analysis of the vacuum packaging market with two related markets. The figures show how the vacuum-sealed packaging market is expected to expand to other markets between 2024 and 2034. It displays the potential revenues in the different markets that are indicated below.

Vacuum-sealed Packaging Market:

Attributes Vacuum-sealed Packaging Market
Value-based CAGR (2024 to 2034) 4.3%
Growth Factor
  • The market is expanding due to rising demand for longer shelf lives.
  • Sustainably packaged goods are receiving more attention, compelling the vacuum-sealed packaging machine market.
Market Trend
  • Eco-friendly components are becoming more popular in vacuum-sealed packaging options.
  • Single-serve vacuum-sealed product sales are growing due to their convenience and portability.
Market Restraint
  • Issues with non-biodegradable vacuum-sealed packaging that raise environmental concerns.
  • Vacuum-sealed packaging technologies are linked to high production expenses.

Vacuum Sealing Machine Market:

Attributes Vacuum Sealing Machine Market
Value-based CAGR (2024 to 2034) 4.8%
Growth Factor
  • The demand for vacuum sealers is expanding due to rising consumer interest in maintaining food freshness.
  • In line with sustainable practices and green principles, vacuum sealing helps minimize food waste and boosts the market.
Market Trend
  • As vacuum sealing preserves nutrients and reduces food waste, consumers use it to prepare meals healthily.
  • As consumers look to extend the shelf life of their bulk purchases, the burgeoning e-commerce industry drives up demand for vacuum sealing machines.
Market Restraint
  • Vacuum sealing machine adoption is limited by their high initial cost.
  • Growth in the market is hampered by low knowledge of vacuum sealing technology.

Vacuum Packaging Market:

Attributes Vacuum Packaging Market
Value-based CAGR (2024 to 2034) 4.9%
Growth Factor
Market Trend
  • The adoption of vacuum packaging is increased by consumers' growing preference for quick and ready-to-eat meals.
  • The market is growing as people become more conscious of reducing food waste.
Market Restraint
  • For small businesses, the initial expenses associated with vacuum packaging equipment can be a significant obstacle.
  • Due to the difficulties in disposing of some packaging materials, there are environmental concerns with the increasing adoption of vacuum packaging.

Category-wise Outlook

The segmented market analysis of vacuum-sealed packaging is included in the following subsection. Based on comprehensive studies, the polyethylene (PE) sector is leading the material category, and the food segment is commanding the end-use category.

Polyethylene Segment’s Leading Position in Vacuum-sealed Packaging Industry

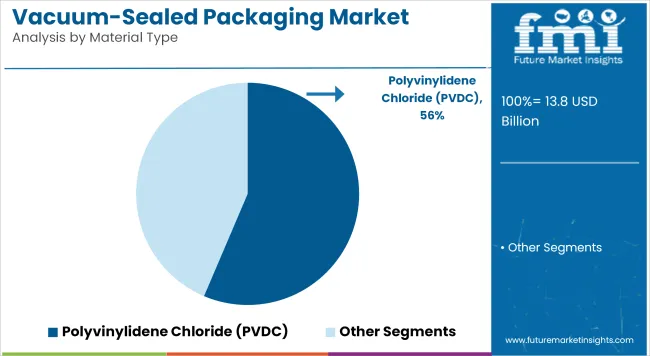
Due to its advantageous and versatile properties, the polyethylene (PE) segment is projected to take over the vacuum-sealed packaging sales. Its widespread availability and ease of processing add to its appeal for applications involving vacuum-sealed packaging.

Leading Segment Polyethylene (PE)
Segment Share 41.7%

The polyethylene segment is predicted to retain the lead in the market. Due to its advantageous attributes and flexibility in meeting packaging needs, industries increasingly emphasize dependable and efficient packaging solutions.

Food Segment Takes the Lead in Vacuum-sealed Packaging Sales

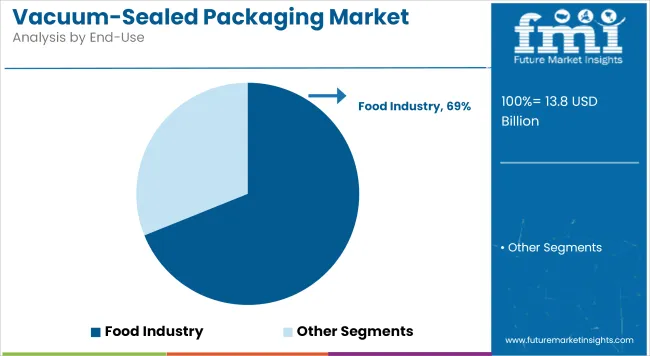
The food segment is expected to lead the sales of vacuum-sealed packaging, demonstrating its superiority over the non-food segment. The importance of vacuum-sealed packaging in maintaining and prolonging the shelf life of perishable food items is the reason behind the trend.

Leading Segment Food
Segment Share 48.9%

The food industry has seen a sharp increase in demand for vacuum-sealed packaging as consumers value freshness and convenience more. Given the continued focus on food sustainability and preservation, the food segment's dominance in sales of vacuum-sealed packaging highlights that it is crucial to meet demand.

Country-wise Analysis

The vacuum-sealed packaging market can be observed in the subsequent tables, focusing on the leading economies in North America, Europe, and Asia Pacific. A comprehensive evaluation demonstrates that Asia Pacific has enormous opportunities due to its resilient vacuum-sealed packaging manufacturers.

A Closer Look at the Growing Vacuum Packaging Market in the Asia Pacific

China Market Outlook

  • The desire from consumers for better food safety and longer shelf lives is fueling the robust China market growth of vacuum-sealed packaging.
  • A significant factor promoting the adoption of vacuum-sealed packaging is the growth of e-commerce in China, where online retailers give packaging solutions that improve product preservation during transit priority.
  • China vacuum-sealed packaging manufacturers are looking into eco-friendly and sustainable vacuum-sealed packaging options in response to strict government regulations and public awareness of environmental issues.

India Market Outlook

  • Due to the growing middle class, urbanization, and shifting lifestyles of consumers, the India vacuum-sealed packaging bag market is growing. There is an increasing demand for hygienic and convenient vacuum-sealed packaging options.
  • With an emphasis on minimizing food waste and maintaining the freshness of perishable items, India's food and beverage sector is a significant driver of vacuum-sealed packaging.
  • The regulatory environment in India and initiatives to advance a circular economy are pushing packaging producers to invest in cutting-edge, recyclable materials for vacuum-sealed containers.
Attributes Details
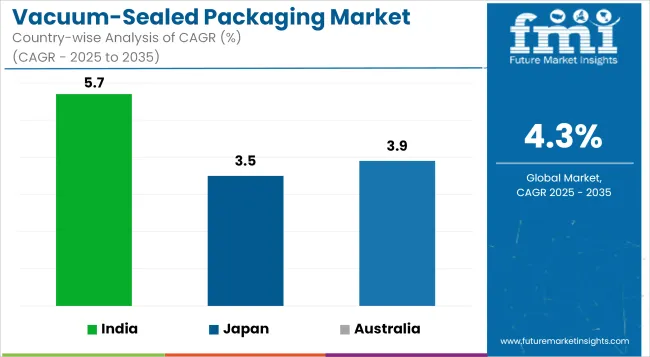
India Market CAGR 5.7%
Japan Market CAGR 3.5%
Australia Market CAGR 3.9%
China Market CAGR 4.9%

Japan Market Outlook

  • The market for vacuum-sealed packaging in Japan is fueled by a culture that places a premium on food safety, quality, and aesthetics. Customers are looking for packaging options that preserve their purchases' original flavor and texture.
  • The demand for vacuum-sealed packaging is fueled by Japan's aging population, which coincides with a desire for more convenient portion sizes and longer shelf lives.
  • The Japan market is shifting toward smart packaging technologies incorporating features like product freshness information and QR codes for traceability within the vacuum-sealed product category.

Australia Market Outlook

  • The emphasis on export-oriented industries in Australia, particularly agriculture, where vacuum-sealed packaging helps preserve product quality during shipping, impacts the country's market.
  • Australia vacuum-sealed packaging trends are shaped by a growing consciousness of sustainability and environmental impact, leading to a preference for environmentally friendly materials and packaging options.
  • Australia's retail industry spearheads vacuum-sealed packaging, emphasizing protecting product integrity and improving the aesthetic appeal of products on shelves.

The Evolution of the Vacuum-sealed Packaging Sector in North America

Attributes Details
North America Market Share 26.3%
United States Market CAGR 2.7%

United States Market Outlook

  • The need for food packaging solutions with extended shelf lives and convenience is propelling the United States market growth of vacuum-sealed packaging.
  • The United States is shifting toward vacuum-sealed packaging due to growing environmental concerns and a preference for sustainable packaging materials.
  • Vacuum-sealed packaging is increasingly popular in the United States due mainly to the growth of e-commerce and the growing popularity of online grocery shopping.

Canada Market Outlook

  • The vacuum-sealed packaging market in Canada is expanding steadily, driven by changing consumer demands for food products that are convenient and fresh.
  • Regarding product safety, vacuum-sealed packaging is in high demand in the pharmaceutical and healthcare industries.
  • The demand for vacuum-sealed packaging is driven by Canada's growing urbanization and busy lifestyles, as consumers look for quick and easy ways to store food.

Strategic Market Insights into Vacuum-Sealed Packaging for Europe

Attributes Details
Europe Market Share 22.7%

Germany Market Outlook

  • The Germany vacuum-sealed packaging market is propelled by a robust industrial sector that prioritizes packaging efficiency and preservation.
  • Germany vacuum-sealed packaging industry is distinguished by an increasing need for environmentally friendly packaging options, consistent with the nation's high level of environmental consciousness.
  • Advancements in vacuum-sealed packaging techniques are becoming popular in Germany as companies look for creative and economical ways to solve problems.
Attributes Details
United Kingdom Market CAGR 4.3%
Germany Market CAGR 3%

United Kingdom Market Outlook

  • The vacuum-sealed packaging market in the United Kingdom indicates a trend toward convenience, as customers value time- and effort-saving packaging options.
  • In response to growing environmental concerns, the United Kingdom's vacuum-sealed packaging market focuses heavily on sustainability, driving the adoption of eco-friendly vacuum-sealed packaging options.
  • Brexit has impacted the United Kingdom's packaging trends, focusing on using cutting-edge vacuum-sealed packaging techniques to maximize supply chain efficiency and minimize waste.

Competitive Analysis

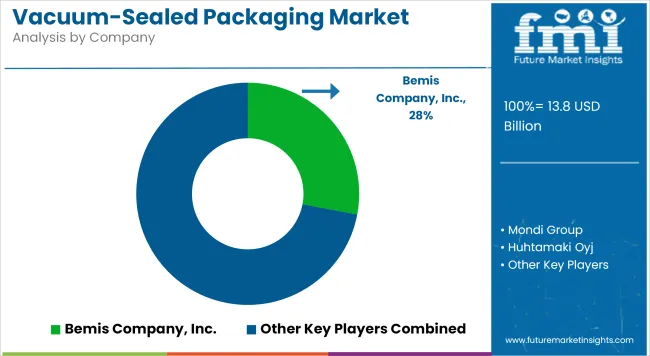
The vacuum-sealed packaging industry is characterized by fierce competition, with significant players emphasizing sustainability and innovation. To increase their global footprint and diversify their product offerings, vacuum-sealed packaging vendors strongly emphasize strategic alliances, mergers, and acquisitions. Market expansion for vacuum-sealed packaging is driven by rising consumer demand for food preservation products and extended shelf lives.

Due to strict food safety and quality regulations, vacuum-sealed packaging is becoming prevalent in various industries. Steady technological progress and an increasing focus on environmentally friendly packaging options heighten competition in the ever-changing vacuum-sealed packaging market. This creates a scene characterized by ongoing change and calculated moves from key vacuum-sealed packaging suppliers.

Notable Breakthroughs

Company Details
Amcor plc In August 2022, Amcor plc expanded its European presence by purchasing a cutting-edge flexible packaging facility in the Czech Republic.
Klockner Pentaplast By adding rPET/PET capacity to its Beaver location in April 2022, Klockner Pentaplast increased its power and potentially aided the company's growth in the North American market for sustainable healthcare and food packaging.

Pivotal Vacuum-sealed Packaging Manufacturers

  • Sealed Air Corporation
  • Amcor plc
  • Berry Global Group
  • Schur Flexibles Holding GesmbH
  • Winpak Ltd.
  • Klöckner Pentaplast
  • Allfo GmbH & Co. KG
  • Nemco Machinery A/S
  • Plastissimo Film Co., Ltd.
  • Plastopil Hazorea Company Ltd.
  • Coveris Holdings S.A.
  • The Vacuum Pouch Company Ltd.

Key Segments

By Material:

  • Polyethylene (PE)
  • Polypropylene (PP)
  • Polyamide (PA)
  • Ethylene Vinyl Alcohol (EVOH)
  • Polyethylene terephthalate (PET)
  • Other

By Product Type:

  • Pouches and Bags
  • Films

By End Use:

  • Food
  • Non-Food

By Region:

  • North America
  • Latin America
  • Europe
  • East Asia
  • South Asia
  • Oceania
  • The Middle East and Africa

Frequently Asked Questions

What is the Current Vacuum-sealed Packaging Market Valuation?

The vacuum-sealed packaging machine market is to secure a valuation of US$ 13.2 billion in 2024.

How Big Can the Vacuum-sealed Packaging Market Be by 2034?

The vacuum-sealed packaging bag market is estimated to reach US$ 20.1 billion by 2034.

What is the Growth Potential of the Vacuum-sealed Packaging Market?

Through 2034, the vacuum-sealed packaging industry is anticipated to expand at a 4.3% CAGR.

What Was the Historical Outlook of the Vacuum-sealed Packaging Market?

From 2019 to 2023, the vacuum-sealed packaging system market registered a 1.9% CAGR.

Which Material Segment to Dominate in the Vacuum-sealed Packaging Market?

The polyethylene (PE) sector is set to achieve a market share of 41.7%.

Which End-use Segment to Lead the Vacuum-sealed Packaging Market?

A 48.9% market share is expected for the food sector.

Table of Content

1. Executive Summary

    1.1. Global Market Outlook

    1.2. Demand-side Trends

    1.3. Supply-side Trends

    1.4. Technology Roadmap Analysis

    1.5. Analysis and Recommendations

2. Market Overview

    2.1. Market Coverage / Taxonomy

    2.2. Market Definition / Scope / Limitations

3. Market Background

    3.1. Market Dynamics

        3.1.1. Drivers

        3.1.2. Restraints

        3.1.3. Opportunity

        3.1.4. Trends

    3.2. Scenario Forecast

        3.2.1. Demand in Optimistic Scenario

        3.2.2. Demand in Likely Scenario

        3.2.3. Demand in Conservative Scenario

    3.3. Opportunity Map Analysis

    3.4. Product Life Cycle Analysis

    3.5. Supply Chain Analysis

        3.5.1. Supply Side Participants and their Roles

            3.5.1.1. Producers

            3.5.1.2. Mid-Level Participants (Traders/ Agents/ Brokers)

            3.5.1.3. Wholesalers and Distributors

        3.5.2. Value Added and Value Created at Node in the Supply Chain

        3.5.3. List of Raw Material Suppliers

        3.5.4. List of Existing and Potential Buyer’s

    3.6. Investment Feasibility Matrix

    3.7. Value Chain Analysis

        3.7.1. Profit Margin Analysis

        3.7.2. Wholesalers and Distributors

        3.7.3. Retailers

    3.8. PESTLE and Porter’s Analysis

    3.9. Regulatory Landscape

        3.9.1. By Key Regions

        3.9.2. By Key Countries

    3.10. Regional Parent Market Outlook

    3.11. Production and Consumption Statistics

    3.12. Import and Export Statistics

4. Global Market Analysis 2019 to 2023 and Forecast, 2024 to 2034

    4.1. Historical Market Size Value (US$ Million) & Volume (Tons) Analysis, 2019 to 2023

    4.2. Current and Future Market Size Value (US$ Million) & Volume (Tons) Projections, 2024 to 2034

        4.2.1. Y-o-Y Growth Trend Analysis

        4.2.2. Absolute $ Opportunity Analysis

5. Global Market Analysis 2019 to 2023 and Forecast 2024 to 2034, By Materials

    5.1. Introduction / Key Findings

    5.2. Historical Market Size Value (US$ Million) & Volume (Tons) Analysis By Materials, 2019 to 2023

    5.3. Current and Future Market Size Value (US$ Million) & Volume (Tons) Analysis and Forecast By Materials, 2024 to 2034

        5.3.1. Polyethylene

        5.3.2. Polypropylene

        5.3.3. Polyamide

        5.3.4. Ethylene Vinyl Alcohol

        5.3.5. Polyethylene terephthalate

        5.3.6. Other Plastics

    5.4. Y-o-Y Growth Trend Analysis By Materials, 2019 to 2023

    5.5. Absolute $ Opportunity Analysis By Materials, 2024 to 2034

6. Global Market Analysis 2019 to 2023 and Forecast 2024 to 2034, By Product Type

    6.1. Introduction / Key Findings

    6.2. Historical Market Size Value (US$ Million) & Volume (Tons) Analysis By Product Type, 2019 to 2023

    6.3. Current and Future Market Size Value (US$ Million) & Volume (Tons) Analysis and Forecast By Product Type, 2024 to 2034

        6.3.1. Pouches & bags

        6.3.2. Films

    6.4. Y-o-Y Growth Trend Analysis By Product Type, 2019 to 2023

    6.5. Absolute $ Opportunity Analysis By Product Type, 2024 to 2034

7. Global Market Analysis 2019 to 2023 and Forecast 2024 to 2034, By End Use

    7.1. Introduction / Key Findings

    7.2. Historical Market Size Value (US$ Million) & Volume (Tons) Analysis By End Use, 2019 to 2023

    7.3. Current and Future Market Size Value (US$ Million) & Volume (Tons) Analysis and Forecast By End Use, 2024 to 2034

        7.3.1. Food

        7.3.2. Non-Food

    7.4. Y-o-Y Growth Trend Analysis By End Use, 2019 to 2023

    7.5. Absolute $ Opportunity Analysis By End Use, 2024 to 2034

8. Global Market Analysis 2019 to 2023 and Forecast 2024 to 2034, By Region

    8.1. Introduction

    8.2. Historical Market Size Value (US$ Million) & Volume (Tons) Analysis By Region, 2019 to 2023

    8.3. Current Market Size Value (US$ Million) & Volume (Tons) Analysis and Forecast By Region, 2024 to 2034

        8.3.1. North America

        8.3.2. Latin America

        8.3.3. Europe

        8.3.4. East Asia

        8.3.5. South Asia

        8.3.6. Oceania

        8.3.7. MEA

    8.4. Market Attractiveness Analysis By Region

9. North America Market Analysis 2019 to 2023 and Forecast 2024 to 2034, By Country

    9.1. Historical Market Size Value (US$ Million) & Volume (Tons) Trend Analysis By Market Taxonomy, 2019 to 2023

    9.2. Market Size Value (US$ Million) & Volume (Tons) Forecast By Market Taxonomy, 2024 to 2034

        9.2.1. By Country

            9.2.1.1. USA

            9.2.1.2. Canada

        9.2.2. By Materials

        9.2.3. By Product Type

        9.2.4. By End Use

    9.3. Market Attractiveness Analysis

        9.3.1. By Country

        9.3.2. By Materials

        9.3.3. By Product Type

        9.3.4. By End Use

    9.4. Key Takeaways

10. Latin America Market Analysis 2019 to 2023 and Forecast 2024 to 2034, By Country

    10.1. Historical Market Size Value (US$ Million) & Volume (Tons) Trend Analysis By Market Taxonomy, 2019 to 2023

    10.2. Market Size Value (US$ Million) & Volume (Tons) Forecast By Market Taxonomy, 2024 to 2034

        10.2.1. By Country

            10.2.1.1. Brazil

            10.2.1.2. Mexico

            10.2.1.3. Argentina

            10.2.1.4. Rest of Latin America

        10.2.2. By Materials

        10.2.3. By Product Type

        10.2.4. By End Use

    10.3. Market Attractiveness Analysis

        10.3.1. By Country

        10.3.2. By Materials

        10.3.3. By Product Type

        10.3.4. By End Use

    10.4. Key Takeaways

11. Europe Market Analysis 2019 to 2023 and Forecast 2024 to 2034, By Country

    11.1. Historical Market Size Value (US$ Million) & Volume (Tons) Trend Analysis By Market Taxonomy, 2019 to 2023

    11.2. Market Size Value (US$ Million) & Volume (Tons) Forecast By Market Taxonomy, 2024 to 2034

        11.2.1. By Country

            11.2.1.1. Germany

            11.2.1.2. Italy

            11.2.1.3. France

            11.2.1.4. UK

            11.2.1.5. Spain

            11.2.1.6. Russia

            11.2.1.7. BENELUX

            11.2.1.8. Rest of Europe

        11.2.2. By Materials

        11.2.3. By Product Type

        11.2.4. By End Use

    11.3. Market Attractiveness Analysis

        11.3.1. By Country

        11.3.2. By Materials

        11.3.3. By Product Type

        11.3.4. By End Use

    11.4. Key Takeaways

12. East Asia Market Analysis 2019 to 2023 and Forecast 2024 to 2034, By Country

    12.1. Historical Market Size Value (US$ Million) & Volume (Tons) Trend Analysis By Market Taxonomy, 2019 to 2023

    12.2. Market Size Value (US$ Million) & Volume (Tons) Forecast By Market Taxonomy, 2024 to 2034

        12.2.1. By Country

            12.2.1.1. China

            12.2.1.2. Japan

            12.2.1.3. South Korea

        12.2.2. By Materials

        12.2.3. By Product Type

        12.2.4. By End Use

    12.3. Market Attractiveness Analysis

        12.3.1. By Country

        12.3.2. By Materials

        12.3.3. By Product Type

        12.3.4. By End Use

    12.4. Key Takeaways

13. South Asia Market Analysis 2019 to 2023 and Forecast 2024 to 2034, By Country

    13.1. Historical Market Size Value (US$ Million) & Volume (Tons) Trend Analysis By Market Taxonomy, 2019 to 2023

    13.2. Market Size Value (US$ Million) & Volume (Tons) Forecast By Market Taxonomy, 2024 to 2034

        13.2.1. By Country

            13.2.1.1. India

            13.2.1.2. Thailand

            13.2.1.3. Malaysia

            13.2.1.4. Indonesia

            13.2.1.5. Rest of South Asia

        13.2.2. By Materials

        13.2.3. By Product Type

        13.2.4. By End Use

    13.3. Market Attractiveness Analysis

        13.3.1. By Country

        13.3.2. By Materials

        13.3.3. By Product Type

        13.3.4. By End Use

    13.4. Key Takeaways

14. Oceania Market Analysis 2019 to 2023 and Forecast 2024 to 2034, By Country

    14.1. Historical Market Size Value (US$ Million) & Volume (Tons) Trend Analysis By Market Taxonomy, 2019 to 2023

    14.2. Market Size Value (US$ Million) & Volume (Tons) Forecast By Market Taxonomy, 2024 to 2034

        14.2.1. By Country

            14.2.1.1. Australia

            14.2.1.2. New Zealand

        14.2.2. By Materials

        14.2.3. By Product Type

        14.2.4. By End Use

    14.3. Market Attractiveness Analysis

        14.3.1. By Country

        14.3.2. By Materials

        14.3.3. By Product Type

        14.3.4. By End Use

    14.4. Key Takeaways

15. MEA Market Analysis 2019 to 2023 and Forecast 2024 to 2034, By Country

    15.1. Historical Market Size Value (US$ Million) & Volume (Tons) Trend Analysis By Market Taxonomy, 2019 to 2023

    15.2. Market Size Value (US$ Million) & Volume (Tons) Forecast By Market Taxonomy, 2024 to 2034

        15.2.1. By Country

            15.2.1.1. GCC

            15.2.1.2. Rest of MEA

        15.2.2. By Materials

        15.2.3. By Product Type

        15.2.4. By End Use

    15.3. Market Attractiveness Analysis

        15.3.1. By Country

        15.3.2. By Materials

        15.3.3. By Product Type

        15.3.4. By End Use

    15.4. Key Takeaways

16. Key Countries Market Analysis

    16.1. USA

        16.1.1. Pricing Analysis

        16.1.2. Market Share Analysis, 2023

            16.1.2.1. By Materials

            16.1.2.2. By Product Type

            16.1.2.3. By End Use

    16.2. Canada

        16.2.1. Pricing Analysis

        16.2.2. Market Share Analysis, 2023

            16.2.2.1. By Materials

            16.2.2.2. By Product Type

            16.2.2.3. By End Use

    16.3. Brazil

        16.3.1. Pricing Analysis

        16.3.2. Market Share Analysis, 2023

            16.3.2.1. By Materials

            16.3.2.2. By Product Type

            16.3.2.3. By End Use

    16.4. Mexico

        16.4.1. Pricing Analysis

        16.4.2. Market Share Analysis, 2023

            16.4.2.1. By Materials

            16.4.2.2. By Product Type

            16.4.2.3. By End Use

    16.5. Argentina

        16.5.1. Pricing Analysis

        16.5.2. Market Share Analysis, 2023

            16.5.2.1. By Materials

            16.5.2.2. By Product Type

            16.5.2.3. By End Use

    16.6. Germany

        16.6.1. Pricing Analysis

        16.6.2. Market Share Analysis, 2023

            16.6.2.1. By Materials

            16.6.2.2. By Product Type

            16.6.2.3. By End Use

    16.7. Italy

        16.7.1. Pricing Analysis

        16.7.2. Market Share Analysis, 2023

            16.7.2.1. By Materials

            16.7.2.2. By Product Type

            16.7.2.3. By End Use

    16.8. France

        16.8.1. Pricing Analysis

        16.8.2. Market Share Analysis, 2023

            16.8.2.1. By Materials

            16.8.2.2. By Product Type

            16.8.2.3. By End Use

    16.9. UK

        16.9.1. Pricing Analysis

        16.9.2. Market Share Analysis, 2023

            16.9.2.1. By Materials

            16.9.2.2. By Product Type

            16.9.2.3. By End Use

    16.10. Spain

        16.10.1. Pricing Analysis

        16.10.2. Market Share Analysis, 2023

            16.10.2.1. By Materials

            16.10.2.2. By Product Type

            16.10.2.3. By End Use

    16.11. Russia

        16.11.1. Pricing Analysis

        16.11.2. Market Share Analysis, 2023

            16.11.2.1. By Materials

            16.11.2.2. By Product Type

            16.11.2.3. By End Use

    16.12. BENELUX

        16.12.1. Pricing Analysis

        16.12.2. Market Share Analysis, 2023

            16.12.2.1. By Materials

            16.12.2.2. By Product Type

            16.12.2.3. By End Use

    16.13. China

        16.13.1. Pricing Analysis

        16.13.2. Market Share Analysis, 2023

            16.13.2.1. By Materials

            16.13.2.2. By Product Type

            16.13.2.3. By End Use

    16.14. Japan

        16.14.1. Pricing Analysis

        16.14.2. Market Share Analysis, 2023

            16.14.2.1. By Materials

            16.14.2.2. By Product Type

            16.14.2.3. By End Use

    16.15. South Korea

        16.15.1. Pricing Analysis

        16.15.2. Market Share Analysis, 2023

            16.15.2.1. By Materials

            16.15.2.2. By Product Type

            16.15.2.3. By End Use

    16.16. India

        16.16.1. Pricing Analysis

        16.16.2. Market Share Analysis, 2023

            16.16.2.1. By Materials

            16.16.2.2. By Product Type

            16.16.2.3. By End Use

    16.17. Thailand

        16.17.1. Pricing Analysis

        16.17.2. Market Share Analysis, 2023

            16.17.2.1. By Materials

            16.17.2.2. By Product Type

            16.17.2.3. By End Use

    16.18. Malaysia

        16.18.1. Pricing Analysis

        16.18.2. Market Share Analysis, 2023

            16.18.2.1. By Materials

            16.18.2.2. By Product Type

            16.18.2.3. By End Use

    16.19. Indonesia

        16.19.1. Pricing Analysis

        16.19.2. Market Share Analysis, 2023

            16.19.2.1. By Materials

            16.19.2.2. By Product Type

            16.19.2.3. By End Use

    16.20. Australia

        16.20.1. Pricing Analysis

        16.20.2. Market Share Analysis, 2023

            16.20.2.1. By Materials

            16.20.2.2. By Product Type

            16.20.2.3. By End Use

    16.21. New Zealand

        16.21.1. Pricing Analysis

        16.21.2. Market Share Analysis, 2023

            16.21.2.1. By Materials

            16.21.2.2. By Product Type

            16.21.2.3. By End Use

    16.22. GCC Countries

        16.22.1. Pricing Analysis

        16.22.2. Market Share Analysis, 2023

            16.22.2.1. By Materials

            16.22.2.2. By Product Type

            16.22.2.3. By End Use

17. Market Structure Analysis

    17.1. Competition Dashboard

    17.2. Competition Benchmarking

    17.3. Market Share Analysis of Top Players

        17.3.1. By Regional

        17.3.2. By Materials

        17.3.3. By Product Type

        17.3.4. By End Use

18. Competition Analysis

    18.1. Competition Deep Dive

        18.1.1. Sealed Air Corporation

            18.1.1.1. Overview

            18.1.1.2. Product Portfolio

            18.1.1.3. Profitability by Market Segments

            18.1.1.4. Sales Footprint

            18.1.1.5. Strategy Overview

                18.1.1.5.1. Marketing Strategy

                18.1.1.5.2. Product Strategy

                18.1.1.5.3. Channel Strategy

        18.1.2. Amcor plc

            18.1.2.1. Overview

            18.1.2.2. Product Portfolio

            18.1.2.3. Profitability by Market Segments

            18.1.2.4. Sales Footprint

            18.1.2.5. Strategy Overview

                18.1.2.5.1. Marketing Strategy

                18.1.2.5.2. Product Strategy

                18.1.2.5.3. Channel Strategy

        18.1.3. Berry Global Group

            18.1.3.1. Overview

            18.1.3.2. Product Portfolio

            18.1.3.3. Profitability by Market Segments

            18.1.3.4. Sales Footprint

            18.1.3.5. Strategy Overview

                18.1.3.5.1. Marketing Strategy

                18.1.3.5.2. Product Strategy

                18.1.3.5.3. Channel Strategy

        18.1.4. Schur Flexibles Holding GesmbH

            18.1.4.1. Overview

            18.1.4.2. Product Portfolio

            18.1.4.3. Profitability by Market Segments

            18.1.4.4. Sales Footprint

            18.1.4.5. Strategy Overview

                18.1.4.5.1. Marketing Strategy

                18.1.4.5.2. Product Strategy

                18.1.4.5.3. Channel Strategy

        18.1.5. Winpak Ltd.

            18.1.5.1. Overview

            18.1.5.2. Product Portfolio

            18.1.5.3. Profitability by Market Segments

            18.1.5.4. Sales Footprint

            18.1.5.5. Strategy Overview

                18.1.5.5.1. Marketing Strategy

                18.1.5.5.2. Product Strategy

                18.1.5.5.3. Channel Strategy

        18.1.6. Klöckner Pentaplast

            18.1.6.1. Overview

            18.1.6.2. Product Portfolio

            18.1.6.3. Profitability by Market Segments

            18.1.6.4. Sales Footprint

            18.1.6.5. Strategy Overview

                18.1.6.5.1. Marketing Strategy

                18.1.6.5.2. Product Strategy

                18.1.6.5.3. Channel Strategy

        18.1.7. Allfo GmbH & Co. KG

            18.1.7.1. Overview

            18.1.7.2. Product Portfolio

            18.1.7.3. Profitability by Market Segments

            18.1.7.4. Sales Footprint

            18.1.7.5. Strategy Overview

                18.1.7.5.1. Marketing Strategy

                18.1.7.5.2. Product Strategy

                18.1.7.5.3. Channel Strategy

        18.1.8. Nemco Machinery A/S

            18.1.8.1. Overview

            18.1.8.2. Product Portfolio

            18.1.8.3. Profitability by Market Segments

            18.1.8.4. Sales Footprint

            18.1.8.5. Strategy Overview

                18.1.8.5.1. Marketing Strategy

                18.1.8.5.2. Product Strategy

                18.1.8.5.3. Channel Strategy

        18.1.9. Plastissimo Film Co., Ltd.

            18.1.9.1. Overview

            18.1.9.2. Product Portfolio

            18.1.9.3. Profitability by Market Segments

            18.1.9.4. Sales Footprint

            18.1.9.5. Strategy Overview

                18.1.9.5.1. Marketing Strategy

                18.1.9.5.2. Product Strategy

                18.1.9.5.3. Channel Strategy

        18.1.10. Plastopil Hazorea Company Ltd.

            18.1.10.1. Overview

            18.1.10.2. Product Portfolio

            18.1.10.3. Profitability by Market Segments

            18.1.10.4. Sales Footprint

            18.1.10.5. Strategy Overview

                18.1.10.5.1. Marketing Strategy

                18.1.10.5.2. Product Strategy

                18.1.10.5.3. Channel Strategy

        18.1.11. Coveris Holdings S.A.

            18.1.11.1. Overview

            18.1.11.2. Product Portfolio

            18.1.11.3. Profitability by Market Segments

            18.1.11.4. Sales Footprint

            18.1.11.5. Strategy Overview

                18.1.11.5.1. Marketing Strategy

                18.1.11.5.2. Product Strategy

                18.1.11.5.3. Channel Strategy

        18.1.12. The Vacuum Pouch Company Ltd.

            18.1.12.1. Overview

            18.1.12.2. Product Portfolio

            18.1.12.3. Profitability by Market Segments

            18.1.12.4. Sales Footprint

            18.1.12.5. Strategy Overview

                18.1.12.5.1. Marketing Strategy

                18.1.12.5.2. Product Strategy

                18.1.12.5.3. Channel Strategy

19. Assumptions & Acronyms Used

20. Research Methodology

List of Tables

Table 1: Global Market Value (US$ Million) Forecast by Region, 2019 to 2034

Table 2: Global Market Volume (Tons) Forecast by Region, 2019 to 2034

Table 3: Global Market Value (US$ Million) Forecast by Materials, 2019 to 2034

Table 4: Global Market Volume (Tons) Forecast by Materials, 2019 to 2034

Table 5: Global Market Value (US$ Million) Forecast by Product Type, 2019 to 2034

Table 6: Global Market Volume (Tons) Forecast by Product Type, 2019 to 2034

Table 7: Global Market Value (US$ Million) Forecast by End Use, 2019 to 2034

Table 8: Global Market Volume (Tons) Forecast by End Use, 2019 to 2034

Table 9: North America Market Value (US$ Million) Forecast by Country, 2019 to 2034

Table 10: North America Market Volume (Tons) Forecast by Country, 2019 to 2034

Table 11: North America Market Value (US$ Million) Forecast by Materials, 2019 to 2034

Table 12: North America Market Volume (Tons) Forecast by Materials, 2019 to 2034

Table 13: North America Market Value (US$ Million) Forecast by Product Type, 2019 to 2034

Table 14: North America Market Volume (Tons) Forecast by Product Type, 2019 to 2034

Table 15: North America Market Value (US$ Million) Forecast by End Use, 2019 to 2034

Table 16: North America Market Volume (Tons) Forecast by End Use, 2019 to 2034

Table 17: Latin America Market Value (US$ Million) Forecast by Country, 2019 to 2034

Table 18: Latin America Market Volume (Tons) Forecast by Country, 2019 to 2034

Table 19: Latin America Market Value (US$ Million) Forecast by Materials, 2019 to 2034

Table 20: Latin America Market Volume (Tons) Forecast by Materials, 2019 to 2034

Table 21: Latin America Market Value (US$ Million) Forecast by Product Type, 2019 to 2034

Table 22: Latin America Market Volume (Tons) Forecast by Product Type, 2019 to 2034

Table 23: Latin America Market Value (US$ Million) Forecast by End Use, 2019 to 2034

Table 24: Latin America Market Volume (Tons) Forecast by End Use, 2019 to 2034

Table 25: Europe Market Value (US$ Million) Forecast by Country, 2019 to 2034

Table 26: Europe Market Volume (Tons) Forecast by Country, 2019 to 2034

Table 27: Europe Market Value (US$ Million) Forecast by Materials, 2019 to 2034

Table 28: Europe Market Volume (Tons) Forecast by Materials, 2019 to 2034

Table 29: Europe Market Value (US$ Million) Forecast by Product Type, 2019 to 2034

Table 30: Europe Market Volume (Tons) Forecast by Product Type, 2019 to 2034

Table 31: Europe Market Value (US$ Million) Forecast by End Use, 2019 to 2034

Table 32: Europe Market Volume (Tons) Forecast by End Use, 2019 to 2034

Table 33: East Asia Market Value (US$ Million) Forecast by Country, 2019 to 2034

Table 34: East Asia Market Volume (Tons) Forecast by Country, 2019 to 2034

Table 35: East Asia Market Value (US$ Million) Forecast by Materials, 2019 to 2034

Table 36: East Asia Market Volume (Tons) Forecast by Materials, 2019 to 2034

Table 37: East Asia Market Value (US$ Million) Forecast by Product Type, 2019 to 2034

Table 38: East Asia Market Volume (Tons) Forecast by Product Type, 2019 to 2034

Table 39: East Asia Market Value (US$ Million) Forecast by End Use, 2019 to 2034

Table 40: East Asia Market Volume (Tons) Forecast by End Use, 2019 to 2034

Table 41: South Asia Market Value (US$ Million) Forecast by Country, 2019 to 2034

Table 42: South Asia Market Volume (Tons) Forecast by Country, 2019 to 2034

Table 43: South Asia Market Value (US$ Million) Forecast by Materials, 2019 to 2034

Table 44: South Asia Market Volume (Tons) Forecast by Materials, 2019 to 2034

Table 45: South Asia Market Value (US$ Million) Forecast by Product Type, 2019 to 2034

Table 46: South Asia Market Volume (Tons) Forecast by Product Type, 2019 to 2034

Table 47: South Asia Market Value (US$ Million) Forecast by End Use, 2019 to 2034

Table 48: South Asia Market Volume (Tons) Forecast by End Use, 2019 to 2034

Table 49: Oceania Market Value (US$ Million) Forecast by Country, 2019 to 2034

Table 50: Oceania Market Volume (Tons) Forecast by Country, 2019 to 2034

Table 51: Oceania Market Value (US$ Million) Forecast by Materials, 2019 to 2034

Table 52: Oceania Market Volume (Tons) Forecast by Materials, 2019 to 2034

Table 53: Oceania Market Value (US$ Million) Forecast by Product Type, 2019 to 2034

Table 54: Oceania Market Volume (Tons) Forecast by Product Type, 2019 to 2034

Table 55: Oceania Market Value (US$ Million) Forecast by End Use, 2019 to 2034

Table 56: Oceania Market Volume (Tons) Forecast by End Use, 2019 to 2034

Table 57: MEA Market Value (US$ Million) Forecast by Country, 2019 to 2034

Table 58: MEA Market Volume (Tons) Forecast by Country, 2019 to 2034

Table 59: MEA Market Value (US$ Million) Forecast by Materials, 2019 to 2034

Table 60: MEA Market Volume (Tons) Forecast by Materials, 2019 to 2034

Table 61: MEA Market Value (US$ Million) Forecast by Product Type, 2019 to 2034

Table 62: MEA Market Volume (Tons) Forecast by Product Type, 2019 to 2034

Table 63: MEA Market Value (US$ Million) Forecast by End Use, 2019 to 2034

Table 64: MEA Market Volume (Tons) Forecast by End Use, 2019 to 2034

List of Charts

Figure 1: Global Market Value (US$ Million) by Materials, 2024 to 2034

Figure 2: Global Market Value (US$ Million) by Product Type, 2024 to 2034

Figure 3: Global Market Value (US$ Million) by End Use, 2024 to 2034

Figure 4: Global Market Value (US$ Million) by Region, 2024 to 2034

Figure 5: Global Market Value (US$ Million) Analysis by Region, 2019 to 2034

Figure 6: Global Market Volume (Tons) Analysis by Region, 2019 to 2034

Figure 7: Global Market Value Share (%) and BPS Analysis by Region, 2024 to 2034

Figure 8: Global Market Y-o-Y Growth (%) Projections by Region, 2024 to 2034

Figure 9: Global Market Value (US$ Million) Analysis by Materials, 2019 to 2034

Figure 10: Global Market Volume (Tons) Analysis by Materials, 2019 to 2034

Figure 11: Global Market Value Share (%) and BPS Analysis by Materials, 2024 to 2034

Figure 12: Global Market Y-o-Y Growth (%) Projections by Materials, 2024 to 2034

Figure 13: Global Market Value (US$ Million) Analysis by Product Type, 2019 to 2034

Figure 14: Global Market Volume (Tons) Analysis by Product Type, 2019 to 2034

Figure 15: Global Market Value Share (%) and BPS Analysis by Product Type, 2024 to 2034

Figure 16: Global Market Y-o-Y Growth (%) Projections by Product Type, 2024 to 2034

Figure 17: Global Market Value (US$ Million) Analysis by End Use, 2019 to 2034

Figure 18: Global Market Volume (Tons) Analysis by End Use, 2019 to 2034

Figure 19: Global Market Value Share (%) and BPS Analysis by End Use, 2024 to 2034

Figure 20: Global Market Y-o-Y Growth (%) Projections by End Use, 2024 to 2034

Figure 21: Global Market Attractiveness by Materials, 2024 to 2034

Figure 22: Global Market Attractiveness by Product Type, 2024 to 2034

Figure 23: Global Market Attractiveness by End Use, 2024 to 2034

Figure 24: Global Market Attractiveness by Region, 2024 to 2034

Figure 25: North America Market Value (US$ Million) by Materials, 2024 to 2034

Figure 26: North America Market Value (US$ Million) by Product Type, 2024 to 2034

Figure 27: North America Market Value (US$ Million) by End Use, 2024 to 2034

Figure 28: North America Market Value (US$ Million) by Country, 2024 to 2034

Figure 29: North America Market Value (US$ Million) Analysis by Country, 2019 to 2034

Figure 30: North America Market Volume (Tons) Analysis by Country, 2019 to 2034

Figure 31: North America Market Value Share (%) and BPS Analysis by Country, 2024 to 2034

Figure 32: North America Market Y-o-Y Growth (%) Projections by Country, 2024 to 2034

Figure 33: North America Market Value (US$ Million) Analysis by Materials, 2019 to 2034

Figure 34: North America Market Volume (Tons) Analysis by Materials, 2019 to 2034

Figure 35: North America Market Value Share (%) and BPS Analysis by Materials, 2024 to 2034

Figure 36: North America Market Y-o-Y Growth (%) Projections by Materials, 2024 to 2034

Figure 37: North America Market Value (US$ Million) Analysis by Product Type, 2019 to 2034

Figure 38: North America Market Volume (Tons) Analysis by Product Type, 2019 to 2034

Figure 39: North America Market Value Share (%) and BPS Analysis by Product Type, 2024 to 2034

Figure 40: North America Market Y-o-Y Growth (%) Projections by Product Type, 2024 to 2034

Figure 41: North America Market Value (US$ Million) Analysis by End Use, 2019 to 2034

Figure 42: North America Market Volume (Tons) Analysis by End Use, 2019 to 2034

Figure 43: North America Market Value Share (%) and BPS Analysis by End Use, 2024 to 2034

Figure 44: North America Market Y-o-Y Growth (%) Projections by End Use, 2024 to 2034

Figure 45: North America Market Attractiveness by Materials, 2024 to 2034

Figure 46: North America Market Attractiveness by Product Type, 2024 to 2034

Figure 47: North America Market Attractiveness by End Use, 2024 to 2034

Figure 48: North America Market Attractiveness by Country, 2024 to 2034

Figure 49: Latin America Market Value (US$ Million) by Materials, 2024 to 2034

Figure 50: Latin America Market Value (US$ Million) by Product Type, 2024 to 2034

Figure 51: Latin America Market Value (US$ Million) by End Use, 2024 to 2034

Figure 52: Latin America Market Value (US$ Million) by Country, 2024 to 2034

Figure 53: Latin America Market Value (US$ Million) Analysis by Country, 2019 to 2034

Figure 54: Latin America Market Volume (Tons) Analysis by Country, 2019 to 2034

Figure 55: Latin America Market Value Share (%) and BPS Analysis by Country, 2024 to 2034

Figure 56: Latin America Market Y-o-Y Growth (%) Projections by Country, 2024 to 2034

Figure 57: Latin America Market Value (US$ Million) Analysis by Materials, 2019 to 2034

Figure 58: Latin America Market Volume (Tons) Analysis by Materials, 2019 to 2034

Figure 59: Latin America Market Value Share (%) and BPS Analysis by Materials, 2024 to 2034

Figure 60: Latin America Market Y-o-Y Growth (%) Projections by Materials, 2024 to 2034

Figure 61: Latin America Market Value (US$ Million) Analysis by Product Type, 2019 to 2034

Figure 62: Latin America Market Volume (Tons) Analysis by Product Type, 2019 to 2034

Figure 63: Latin America Market Value Share (%) and BPS Analysis by Product Type, 2024 to 2034

Figure 64: Latin America Market Y-o-Y Growth (%) Projections by Product Type, 2024 to 2034

Figure 65: Latin America Market Value (US$ Million) Analysis by End Use, 2019 to 2034

Figure 66: Latin America Market Volume (Tons) Analysis by End Use, 2019 to 2034

Figure 67: Latin America Market Value Share (%) and BPS Analysis by End Use, 2024 to 2034

Figure 68: Latin America Market Y-o-Y Growth (%) Projections by End Use, 2024 to 2034

Figure 69: Latin America Market Attractiveness by Materials, 2024 to 2034

Figure 70: Latin America Market Attractiveness by Product Type, 2024 to 2034

Figure 71: Latin America Market Attractiveness by End Use, 2024 to 2034

Figure 72: Latin America Market Attractiveness by Country, 2024 to 2034

Figure 73: Europe Market Value (US$ Million) by Materials, 2024 to 2034

Figure 74: Europe Market Value (US$ Million) by Product Type, 2024 to 2034

Figure 75: Europe Market Value (US$ Million) by End Use, 2024 to 2034

Figure 76: Europe Market Value (US$ Million) by Country, 2024 to 2034

Figure 77: Europe Market Value (US$ Million) Analysis by Country, 2019 to 2034

Figure 78: Europe Market Volume (Tons) Analysis by Country, 2019 to 2034

Figure 79: Europe Market Value Share (%) and BPS Analysis by Country, 2024 to 2034

Figure 80: Europe Market Y-o-Y Growth (%) Projections by Country, 2024 to 2034

Figure 81: Europe Market Value (US$ Million) Analysis by Materials, 2019 to 2034

Figure 82: Europe Market Volume (Tons) Analysis by Materials, 2019 to 2034

Figure 83: Europe Market Value Share (%) and BPS Analysis by Materials, 2024 to 2034

Figure 84: Europe Market Y-o-Y Growth (%) Projections by Materials, 2024 to 2034

Figure 85: Europe Market Value (US$ Million) Analysis by Product Type, 2019 to 2034

Figure 86: Europe Market Volume (Tons) Analysis by Product Type, 2019 to 2034

Figure 87: Europe Market Value Share (%) and BPS Analysis by Product Type, 2024 to 2034

Figure 88: Europe Market Y-o-Y Growth (%) Projections by Product Type, 2024 to 2034

Figure 89: Europe Market Value (US$ Million) Analysis by End Use, 2019 to 2034

Figure 90: Europe Market Volume (Tons) Analysis by End Use, 2019 to 2034

Figure 91: Europe Market Value Share (%) and BPS Analysis by End Use, 2024 to 2034

Figure 92: Europe Market Y-o-Y Growth (%) Projections by End Use, 2024 to 2034

Figure 93: Europe Market Attractiveness by Materials, 2024 to 2034

Figure 94: Europe Market Attractiveness by Product Type, 2024 to 2034

Figure 95: Europe Market Attractiveness by End Use, 2024 to 2034

Figure 96: Europe Market Attractiveness by Country, 2024 to 2034

Figure 97: East Asia Market Value (US$ Million) by Materials, 2024 to 2034

Figure 98: East Asia Market Value (US$ Million) by Product Type, 2024 to 2034

Figure 99: East Asia Market Value (US$ Million) by End Use, 2024 to 2034

Figure 100: East Asia Market Value (US$ Million) by Country, 2024 to 2034

Figure 101: East Asia Market Value (US$ Million) Analysis by Country, 2019 to 2034

Figure 102: East Asia Market Volume (Tons) Analysis by Country, 2019 to 2034

Figure 103: East Asia Market Value Share (%) and BPS Analysis by Country, 2024 to 2034

Figure 104: East Asia Market Y-o-Y Growth (%) Projections by Country, 2024 to 2034

Figure 105: East Asia Market Value (US$ Million) Analysis by Materials, 2019 to 2034

Figure 106: East Asia Market Volume (Tons) Analysis by Materials, 2019 to 2034

Figure 107: East Asia Market Value Share (%) and BPS Analysis by Materials, 2024 to 2034

Figure 108: East Asia Market Y-o-Y Growth (%) Projections by Materials, 2024 to 2034

Figure 109: East Asia Market Value (US$ Million) Analysis by Product Type, 2019 to 2034

Figure 110: East Asia Market Volume (Tons) Analysis by Product Type, 2019 to 2034

Figure 111: East Asia Market Value Share (%) and BPS Analysis by Product Type, 2024 to 2034

Figure 112: East Asia Market Y-o-Y Growth (%) Projections by Product Type, 2024 to 2034

Figure 113: East Asia Market Value (US$ Million) Analysis by End Use, 2019 to 2034

Figure 114: East Asia Market Volume (Tons) Analysis by End Use, 2019 to 2034

Figure 115: East Asia Market Value Share (%) and BPS Analysis by End Use, 2024 to 2034

Figure 116: East Asia Market Y-o-Y Growth (%) Projections by End Use, 2024 to 2034

Figure 117: East Asia Market Attractiveness by Materials, 2024 to 2034

Figure 118: East Asia Market Attractiveness by Product Type, 2024 to 2034

Figure 119: East Asia Market Attractiveness by End Use, 2024 to 2034

Figure 120: East Asia Market Attractiveness by Country, 2024 to 2034

Figure 121: South Asia Market Value (US$ Million) by Materials, 2024 to 2034

Figure 122: South Asia Market Value (US$ Million) by Product Type, 2024 to 2034

Figure 123: South Asia Market Value (US$ Million) by End Use, 2024 to 2034

Figure 124: South Asia Market Value (US$ Million) by Country, 2024 to 2034

Figure 125: South Asia Market Value (US$ Million) Analysis by Country, 2019 to 2034

Figure 126: South Asia Market Volume (Tons) Analysis by Country, 2019 to 2034

Figure 127: South Asia Market Value Share (%) and BPS Analysis by Country, 2024 to 2034

Figure 128: South Asia Market Y-o-Y Growth (%) Projections by Country, 2024 to 2034

Figure 129: South Asia Market Value (US$ Million) Analysis by Materials, 2019 to 2034

Figure 130: South Asia Market Volume (Tons) Analysis by Materials, 2019 to 2034

Figure 131: South Asia Market Value Share (%) and BPS Analysis by Materials, 2024 to 2034

Figure 132: South Asia Market Y-o-Y Growth (%) Projections by Materials, 2024 to 2034

Figure 133: South Asia Market Value (US$ Million) Analysis by Product Type, 2019 to 2034

Figure 134: South Asia Market Volume (Tons) Analysis by Product Type, 2019 to 2034

Figure 135: South Asia Market Value Share (%) and BPS Analysis by Product Type, 2024 to 2034

Figure 136: South Asia Market Y-o-Y Growth (%) Projections by Product Type, 2024 to 2034

Figure 137: South Asia Market Value (US$ Million) Analysis by End Use, 2019 to 2034

Figure 138: South Asia Market Volume (Tons) Analysis by End Use, 2019 to 2034

Figure 139: South Asia Market Value Share (%) and BPS Analysis by End Use, 2024 to 2034

Figure 140: South Asia Market Y-o-Y Growth (%) Projections by End Use, 2024 to 2034

Figure 141: South Asia Market Attractiveness by Materials, 2024 to 2034

Figure 142: South Asia Market Attractiveness by Product Type, 2024 to 2034

Figure 143: South Asia Market Attractiveness by End Use, 2024 to 2034

Figure 144: South Asia Market Attractiveness by Country, 2024 to 2034

Figure 145: Oceania Market Value (US$ Million) by Materials, 2024 to 2034

Figure 146: Oceania Market Value (US$ Million) by Product Type, 2024 to 2034

Figure 147: Oceania Market Value (US$ Million) by End Use, 2024 to 2034

Figure 148: Oceania Market Value (US$ Million) by Country, 2024 to 2034

Figure 149: Oceania Market Value (US$ Million) Analysis by Country, 2019 to 2034

Figure 150: Oceania Market Volume (Tons) Analysis by Country, 2019 to 2034

Figure 151: Oceania Market Value Share (%) and BPS Analysis by Country, 2024 to 2034

Figure 152: Oceania Market Y-o-Y Growth (%) Projections by Country, 2024 to 2034

Figure 153: Oceania Market Value (US$ Million) Analysis by Materials, 2019 to 2034

Figure 154: Oceania Market Volume (Tons) Analysis by Materials, 2019 to 2034

Figure 155: Oceania Market Value Share (%) and BPS Analysis by Materials, 2024 to 2034

Figure 156: Oceania Market Y-o-Y Growth (%) Projections by Materials, 2024 to 2034

Figure 157: Oceania Market Value (US$ Million) Analysis by Product Type, 2019 to 2034

Figure 158: Oceania Market Volume (Tons) Analysis by Product Type, 2019 to 2034

Figure 159: Oceania Market Value Share (%) and BPS Analysis by Product Type, 2024 to 2034

Figure 160: Oceania Market Y-o-Y Growth (%) Projections by Product Type, 2024 to 2034

Figure 161: Oceania Market Value (US$ Million) Analysis by End Use, 2019 to 2034

Figure 162: Oceania Market Volume (Tons) Analysis by End Use, 2019 to 2034

Figure 163: Oceania Market Value Share (%) and BPS Analysis by End Use, 2024 to 2034

Figure 164: Oceania Market Y-o-Y Growth (%) Projections by End Use, 2024 to 2034

Figure 165: Oceania Market Attractiveness by Materials, 2024 to 2034

Figure 166: Oceania Market Attractiveness by Product Type, 2024 to 2034

Figure 167: Oceania Market Attractiveness by End Use, 2024 to 2034

Figure 168: Oceania Market Attractiveness by Country, 2024 to 2034

Figure 169: MEA Market Value (US$ Million) by Materials, 2024 to 2034

Figure 170: MEA Market Value (US$ Million) by Product Type, 2024 to 2034

Figure 171: MEA Market Value (US$ Million) by End Use, 2024 to 2034

Figure 172: MEA Market Value (US$ Million) by Country, 2024 to 2034

Figure 173: MEA Market Value (US$ Million) Analysis by Country, 2019 to 2034

Figure 174: MEA Market Volume (Tons) Analysis by Country, 2019 to 2034

Figure 175: MEA Market Value Share (%) and BPS Analysis by Country, 2024 to 2034

Figure 176: MEA Market Y-o-Y Growth (%) Projections by Country, 2024 to 2034

Figure 177: MEA Market Value (US$ Million) Analysis by Materials, 2019 to 2034

Figure 178: MEA Market Volume (Tons) Analysis by Materials, 2019 to 2034

Figure 179: MEA Market Value Share (%) and BPS Analysis by Materials, 2024 to 2034

Figure 180: MEA Market Y-o-Y Growth (%) Projections by Materials, 2024 to 2034

Figure 181: MEA Market Value (US$ Million) Analysis by Product Type, 2019 to 2034

Figure 182: MEA Market Volume (Tons) Analysis by Product Type, 2019 to 2034

Figure 183: MEA Market Value Share (%) and BPS Analysis by Product Type, 2024 to 2034

Figure 184: MEA Market Y-o-Y Growth (%) Projections by Product Type, 2024 to 2034

Figure 185: MEA Market Value (US$ Million) Analysis by End Use, 2019 to 2034

Figure 186: MEA Market Volume (Tons) Analysis by End Use, 2019 to 2034

Figure 187: MEA Market Value Share (%) and BPS Analysis by End Use, 2024 to 2034

Figure 188: MEA Market Y-o-Y Growth (%) Projections by End Use, 2024 to 2034

Figure 189: MEA Market Attractiveness by Materials, 2024 to 2034

Figure 190: MEA Market Attractiveness by Product Type, 2024 to 2034

Figure 191: MEA Market Attractiveness by End Use, 2024 to 2034

Figure 192: MEA Market Attractiveness by Country, 2024 to 2034

Recommendations

Packaging

Vacuum Packaging Market

Published : September 2022

Packaging

Vacuum Sealing Machine Market

Published : July 2022

Explore Packaging Insights

View Reports

Vacuum-Sealed Packaging Market