Intelligent Packaging Market
Market Insights on Intelligent Packaging covering sales outlook, demand forecast & up-to-date key trends
Intelligent Packaging Market By Technology (Interactive Packaging/Data Carriers, Active Packaging, Indicators), Level of Packaging (Primary Packaging, Secondary Packaging, Tertiary Packaging) & Region - Forecast 2021 - 2031
Intelligent Packaging Market Snapshot
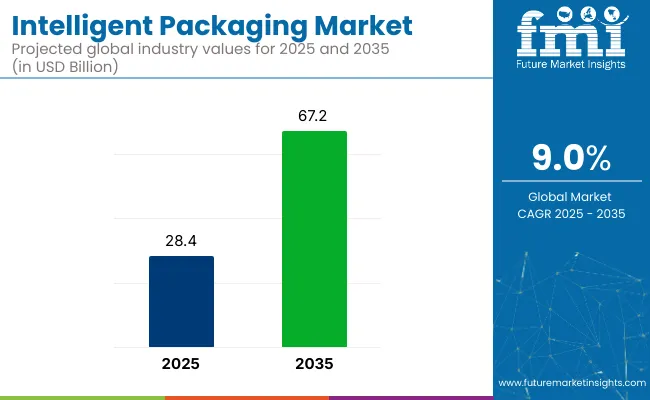
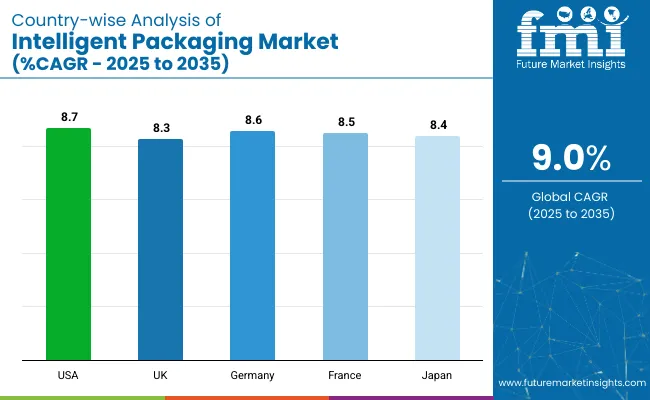
[300 Pages Report] The intelligent packaging market revenue totaled US$ 17.8 Bn in 2020, according to Future Market Insights. The overall market is expected to reach US$ 46.7 Bn by 2031, expanding at a CAGR of 9.0% for 2021-31.
Worldwide sales of intelligent packaging is expected to grow by 10.5% in 2021. Surging demand for interactive packaging/ data carriers will remain a chief growth driver through the assessment period.
The global intelligent packaging market constituted around 2.0% of the US$ 900 billion worth of global packaging market in 2020 and it is estimated to be above 5% by the end of 2030.
Attribute |
Details |
Market Size Value in 2020 |
US$ 17.8 Bn |
Market Forecast Value in 2031 |
US$ 46.7 Bn |
Global Growth Rate |
9% |
Let us know your requirement to get
100% FREE customization
2015-2020 Intelligent Packaging Market Outlook Compared to 2021-2031 Forecast
Majorly driven by the rising demand for interactive, smart, and connected packaging solutions to ensure safety, and prevent the risk of counterfeiting, the global market for smart and intelligent packaging is anticipated to rise at 9.0% CAGR from 2021 to 2031 in comparison to the 6.3% CAGR registered during 2015 to 2020.
Packaging solutions that are smart, connected, interactive are considered under the umbrella of intelligent packaging. These solutions are designed to perform intelligent functions such as tracing, tracking, recording, detecting, and help in improving the quality of product, providing information, ensuring safety, and increasing product shelf life.
Intelligent packaging is been adopted by various brands among food, beverages, healthcare, cosmetic, logistics & transport, consumer electronics, consumer goods, personal care & home care industries.
The rising demand for interactive packaging in various end use industries is intended to drive customer engagement. Also, the increasing need for monitoring customer satisfaction and loyalty to gain business opportunity will fuel the demand in the market.
Intelligent packaging solutions allow brands to analyze and monitor the number of customers who scanned QR codes attached to their product. This will help them to gauge prevalent purchase pattern, creating scope for companies to offer a higher degree of customer satisfaction and capitalize on their loyalty.
Temperature control is a highly sought-after attribute that food, healthcare, and other industries seek in their packaging. They are exploring options that will allow them to protect & preserve products and extend their shelf life.
On the backdrop of this, the demand for time-temperature indicators, sensors, and active packaging solutions is on the rise. Technology-based packaging helps in reducing the sales of counterfeit products as it provides the product with a unique identity that protects the product from counterfeiting.
These factors are expected to steer growth in the intelligent packaging market over the coming years.
Intelligent Packaging Sales to Grow as Brands Focus on Smart, yet Eco-friendly Packaging Solutions
Several brands are adopting intelligent packaging solutions to cater the need for smart, connected, interactive, user-friendly, and eco-friendly packaging solutions among the customers. Some of the examples are as followed:
- Leading food and beverage company Nestlé is using SIG’s QR code closure solution called “One Cap, One Code” in Vietnam which helps in appealing the Gen Z customers along with strengthening brand loyalty.
- In 2020, a global healthcare company named Fresenius Kabi introduced RFID smart labels for a range of its essential medications.
- A British multinational confectionery company named Cadbury used smart packaging to help its customer make connections. The company used a MaXQ QR code on its milk tray packaging.
Will Track & Trace Packaging Emerge as Game Changer?
Globally, manufacturers, logistical partners, and various stakeholders are ensuring smooth flow of packaged food & beverages by producing, supplying, and delivering product to final consumers.
Major global brands face huge losses due to the presence of duplicate products in the market. To overcome such drawbacks of traditional packaging, heavy expenditure is incurred by key packaging industry players in the development of innovative and next-generation packaging solutions.
Latest intelligent packaging solutions are witnessing increased market acceptance by both domestic and international players within the food & beverage industry. For instance, a leading beverage brand, Coca-Cola, has shifted to intelligent packaging by offering electronically printed NFC (Near Field Communication) labels on its bottles.
The global demand for different technology-based packaging solutions is rising as more brands, especially fresh food and the FMCG sectors adopt intelligent packaging.
Find your sweet spots for generating winning opportunities in this market.
Talk to AnalystFuture of Intelligent Packaging in Healthcare Industry
Stringent packaging and transport norms of healthcare drugs and supplies are augmenting the demand for intelligent packaging. As a result of the growing geriatric population and the increasing prevalence of various chronic diseases, the demand for OTC (over the counter) drugs has increased. Developments in medical science and the result of numerous research & development efforts by pharmaceutical giants have increased the availability of drugs in the market.
Logistical problems that accompany advanced medicinal drugs and equipment are proving to be challenging for manufacturers and supply chain partners. All modern life-saving drugs and vaccines require specific packaging and temperature-controlled transportation.
Upgraded transportation laws by the World Health Organization for various medicinal drugs and supplies make it mandatory for manufacturers and logistical partners to adopt intelligent packaging. The usage of advanced intelligent packaging makes the risk-free movement of complex medicinal supplies across the globe easier.
Integration of Advanced Technologies on Card
Intelligent packaging solutions are gradually becoming mainstream. In turn, competition prevalent in the market is expected to get fiercer. To gain a competitive edge, more companies are integrating advanced technologies to make packaging smarter. For instance, some are investing in the integration of augmented reality.
Consumers can see beyond the box with Augmented Reality, which gives them a greater understanding of the product and brand identity. Tetra Pak along with digital experiences studio has revealed a milk carton, which uses augmented reality (AR) via smart packaging, encouraging customers to lead a healthier lifestyle.
The increasing trend towards knowing the product feature and information just through scanning the QR code, using a mobile phone is fuelling the demand for intelligent packaging. Tyson Foods has added a QR code on its meat products which will help the customers know the place of the meat’s origin or when it entered the store.

An unified Market Research Subscription Platform, built for today’s disparate research needs.
How Big is the Opportunity for Intelligent Packaging in e-Commerce?
The global e-commerce industry is expanding with the emergence of intelligent packaging. It is used in all the stages of e-commerce for shipment purposes. Intelligent packaging offers various advanced features, which include easy tracking of the product from the manufacturer’s facility, warehouse, shipper’s warehouse, delivery partner and till the final consumer.
These attributes are unlike traditional packaging where the producer, seller, and shipper were required to maintain complete records of the packaging from the very beginning of the supply chain.
The evolution of intelligent packaging has simplified the process of tracking packaged products, especially in the e-commerce industry. The online shopping is exponentially growing in the fast-paced developing and underdeveloped regions. Along with this, the growing population of educated consumers is anticipated to contribute to the demand for user-friendly packaging and solutions. The adoption of intelligent packaging transforms the whole supply chain. Driven by this, the demand in the market is expected to increase in the coming years.
Will Nanotechnology Boost Adoption of Intelligent Packaging?
Recent developments in the foodservice industry have resulted in the introduction of a number of ready-to-eat meals and packaged foods. Food and beverages are being packaged in a way that consumers can consume them at their convenience.
The adoption of various packaging techniques in the food industry has resulted in higher popularity of intelligent packaging solutions such as anti-microbial packaging. Anti-microbial packaging is made of packaging materials, which possess biological properties that restrict the growth of harmful bacteria inside the package. Anti-microbial packaging prevents the consumables from spoiling.
Furthermore, the introduction of nanotechnology in food packaging has enabled major players in the food & beverage industry to pack their offerings in high-barrier packaging materials. Nanotechnology also enables better detection of contaminants in packages. The export of eatables by major market players across the globe (to cater to the rising demand for pre-cooked foods) acts as a much-needed boost for the expansion of intelligent packaging.
How are Food Delivery Companies Benefiting from Smart & Connected Packaging?
Food delivery companies such as Swiggy and Zomato are investing heavily in intelligent packaging. They also are using artificial intelligence which helps them to improve the customer experience. Using AI, Swiggy differentiates and classifies food dishes and provides customized interface to cater the specific need of the customer.
In 2019, Swiggy announced the acquisition of Kint.io, the Bengaluru-based AI startup. Swiggy also has its marketplace program called Swiggy Packaging Assist which helps in enabling the packaging solution to various restaurants. Besides this, Zomato has acquired a Lucknow-based startup named TechEagle Innovations in 2019 which will help to establish a drone-based delivery network.
What is the Impact of COVID-19 Pandemic on the Global Market for Intelligent Packaging Market?
Overall, the packaging market had experienced a negative slope in demand due to various factors such as a slowdown in production activity among the various end use industries, improper supply chain & logistics, stringent restriction on trade, imbalance in the supply of raw material, and other factors.
The intelligent packaging market as well faced the adverse impact of COVID-19 which resulted in a decrease in sales. However, the market is expected to recover as leading end-use industries resume operations. Industries already have begun operations following roll out of vaccination in 2021.
Coupled with this higher focus on decontaminating packages and products inside will make intelligent packaging imperative across certain industries such as food and beverages, cosmetics and personal care, and pharmaceutical.
Country-wise Insights
Why is the United States Considered the Most Lucrative Market for Intelligent Packaging?
North America remains the second-leading region in the global market, exhibiting high demand for intelligent packaging. The North America market for intelligent packaging is estimated to hold around 26.0% value share, by the end of 2031.
According to the FMI analysis, the United States is projected to hold nearly 85% of the total North America market for intelligent packaging during the forecast years.
Focus on reducing food wastage will remain a chief growth driver in the U.S. According to the Food and Drug Administration (FDA), around 30-40% of the food supply is estimated to be food wasted every year in the United States due to the reasons such as spoilage, damage, and others.
The time-temperature indicators or sensors integrated in intelligent packaging can help to avoid food wastage. Therefore, focus on advanced solutions to prevent food wastage will drive the sales of intelligent packaging solutions in the U.S.
Why is the Demand for Intelligent Packaging increasing in Germany?
Germany is anticipated to remain the leading country for intelligent packaging sales in Europe. Germany is anticipated to hold around 1/5th of demand for intelligent packaging in the regional market.
The demand for intelligent packaging is rising in the healthcare industry to preserve temperature-sensitive drugs. The essential step in the healthcare industry is monitoring the drug temperature and managing the cold chain to ensure safe distribution.
According to the European Federation of Pharmaceutical Industries and Associations (EFPIA), Germany is one of the leading manufacturers of pharmaceutical products. The increasing pharmaceutical production results in high demand for proper time-temperature indicators & sensors to preserve the drug during its storage and transit. Therefore, the rising production of pharmaceutical products in Germany is anticipated to drive the demand for intelligent packaging.
What is Driving Intelligent Packaging Sales in India?
In South Asia, India will hold a market share of around 45% by the end of 2031. The increasing demand for smart and connected packaging along with the adoption of a QR code among the food & beverage industry in India will create growth opportunities for intelligent packaging market in India.
The trend of connected packaging is increasing in India especially in the food & beverage industry. According to India Brand Equity Foundation (IBEF), the Indian food industry is expanding at a CAGR of 11%. The food sector has been registering increasing adoption of connected packaging to ensure customer engagement along with providing product information just by scanning the QR code.
For instance, in 2019, Karnataka Milk Federation (KMF) and CavinKare were among the first few brands to pilot the connected packaging in India. Overall, the rising adoption of connected packaging among the Indian food & beverage industry is estimated to create market growth opportunities for intelligent packaging in India.
Category-wise Insights
Why is Demand in Interactive Packaging/Data Carriers Segment Rising?
Based on the technology, the interactive packaging/data carriers segment is anticipated to remain the most lucrative one among the other technology-based segments. The interactive packaging/data carriers segment is projected to hold around 44% of the market share by 2031.
The reason behind the same is the increasing preference towards technology-based packaging among various end use industries to ensure traceability, safety, and interactive packaging solution.
Who are the Leading End Users of Intelligent Packaging?
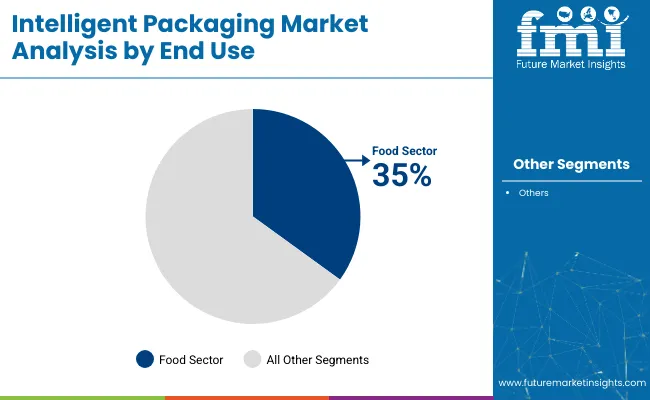
In terms of end use, the food segment followed by the healthcare segment and beverage segment is estimated to hold the leading share in the market. These segments are forecast to hold around 69% of the market by the end of 2031. Strict norms for storing and transporting various food and healthcare products will propel the demand for next generation packaging.
The food segment generates a major portion of the demand for intelligent packaging followed by the healthcare segment and beverage segment. These industries are expected to register high demand for smart, connected, interactive, user-friendly and eco-friendly packaging solutions.
Which Level of Packaging is More Preferred?
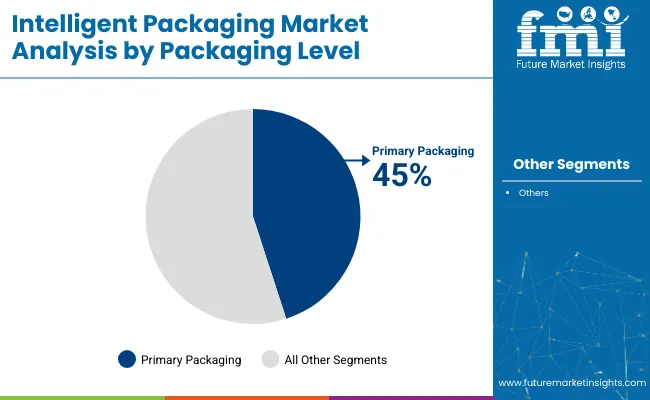
Based on the level of packaging, the primary packaging segment is anticipated to remain the dominant. Leading companies are focusing on making primary packaging more interactive as it gives the first impression about product, which helps customers in reaching their final purchase decision. The primary packaging segment is projected to register a CAGR of 9.6% during the forecast period.
Competitive Landscape
Key players manufacturing next-generation packaging are trying to focus on innovation by launching new products along with adopting advanced technologies. Through this, they intend to cater the demand registered across various industries. Also, the players are expanding their production capacity to meet the demand for smart, connected, and intelligent packaging across the globe.
- In September 2021, Timestrip UK Ltd. introduced a new temperature indicator for vaccines. The indicators will help in avoiding the wastage of vaccine supplies.
- In 2021, JRI Company announced the expansion of its capacity by introducing full integration of the Labguard 3D equipment into the JRI-MySirius solution.
- In December 2020, DeltaTrak Inc. announced the launch of customized vaccine temperature monitoring solutions that are compatible with the three temperature profiles required for the transport, storage, and handling of COVID-19 vaccines.
Some of the leading packaging manufacturers have integrated advanced technologies into their traditional packaging solutions. Besides this, there is high focus on strategic collaborations and product launches:
- In March 2021, Amcor announced a collaboration with JD Farm to jointly launch NFC (near field communication)-enabled packaging that will ensure more effective and interactive consumer engagement.
- In September 2021, Avery Dennison Corporation launched its AD Maxdura® Tire Tag for the tire industry. The new product enables track and trace through the logistic chain and also makes it easier to identify tires at warehouses and dealerships.
- In April 2021, Stora Enso introduced the world’s first sustainable RFID for microwave-safe use. It helps in item-level tagging and ready-made meals.
- In October 2018, Huhtamäki Global announced the launch of its specialty cup range of single wall hot cups and paper vending cups available in a brand new, modern design with a QR code and a message to ‘please recycle this cup’; this is to increase cup recycling in the UK.
Scope of Report
Attribute |
Details |
Forecast Period |
2021-2031 |
Historical Data Available for |
2015-2020 |
Market Analysis |
US$ Million for Value and Units for Volume |
Key Regions Covered |
North America, Latin America, Europe, South Asia, East Asia, Oceania, and the Middle East & Africa |
Key Countries Covered |
US, Canada, Brazil, Mexico, Germany, Italy, France, U.K., Spain, Russia, GCC Countries, Japan, India, China, and Australia |
Key Segments Covered |
Technology, Level of Packaging, Application, End Use, and Region |
Key Companies Profiled |
Material Providers
Packaging Manufacturers
Technology Providers
Brand Owners
|
Report Coverage |
Market Forecast, Company Share Analysis, Competition Intelligence, DROT Analysis, Market Dynamics and Challenges, and Strategic Growth Initiatives |
Customization & Pricing |
Available upon Request |
Intelligent Packaging Market by Category
By Technology:
- Indicators
- Time-Temperature Indicators
- Gas & Integrity Indicators
- Freshness Indicators
- Sensors
- Interactive Packaging/Data Carriers
- Quick-response (QR Codes)
- Barcodes
- Radio Frequency Identification (RFIDs)
- Near Field Communications (NFCs)
- Bluetooth Low Energy (BLE)
- Active Packaging
- Oxygen Scavengers
- Ethylene Absorbers
- Moisture Scavengers
- Anti-microbial Packaging
By Level of Packaging:
- Primary Packaging
- Secondary Packaging
- Tertiary Packaging
By Application:
- Bottles and Jars
- Blisters
- Trays & Clamshells
- Cans
- Boxes & Cartons
- Vials, Ampoules, & Prefilled Syringes
- Bags & Pouches
- Films & Wraps
- Mailers
- Labels, Tapes, & Tags
- Others
By End Use:
- Food
- Meat, Poultry, & Seafood
- Fruits & Vegetables
- Dairy Products
- Bakery & Confectionary
- Processed Food
- Ready to Eat Food
- Others
- Beverage
- Healthcare
- Medical Devices
- Medical Supplies
- Pharmaceuticals
- Cosmetics
- Logistics & Transport
- Consumer Electronics
- Consumer Goods
- Personal Care & Homecare
- Others
By Region:
- North America
- Latin America
- Europe
- South Asia
- East Asia
- Oceania
- Middle East and Africa (MEA)
Frequently Asked Questions
The market valuation of intelligent packaging is expected to be US$ 19.7 Bn by 2021.
The global market for intelligent packaging exhibited steady growth at 6.3% CAGR in the last five years from 2015 to 2020.
The global market for intelligent packaging will experience a rise in demand after the decrease in sales due to the COVID-19 in 2020. As per FMI, the market will expand at a CAGR of 9.0% during 2021 and 2031.
The rising adoption of interactive and connected packaging among Gen Z consumers drives the demand for intelligent packaging. Also, trend of contactless purchase and contactless delivery will augment the sales of intelligent packaging. Overall, the rising need for smart, connected, interactive, eco-friendly, and user-friendly packaging solutions among the various end-use industries will boost the demand for intelligent packaging.
Rising demand for track and trace solutions along with safe packaging will drive the sales of intelligent packaging across the globe. Moreover, higher inclination among consumers to know about various product information will aid the expansion of the market.
Europe and North America hold the leading share in the global market for intelligent packaging. The Europe and North America market will collectively hold around 55% of the market share in 2031.
As per the FMI analysis, the market for intelligent packaging in South Asia is projected to exhibit a CAGR of 11.0 % between 2021 and 2031.
The U.S., Japan, South Korea, Germany, U.K., Italy, Canada, and China are among the leading markets for intelligent packaging, exhibiting consistently high demand.
As per FMI, the Japan intelligent packaging market is expected to rise at 11.2% CAGR between 2021 and 2031.
Table of Content
1. Executive Summary
1.1. Global Market Outlook
1.2. Market Analysis
1.3. Analysis and Recommendations
2. Market Overview
2.1. Market Coverage / Taxonomy
2.2. Market Definition
3. Key Market Trends
3.1. Key Trends Impacting the Market
3.2. Recent Developments by the Key Players
3.2.1. Product Level
3.2.2. Technology Level
3.2.3. Business Level
3.3. R&D Activities by the Key Players for Future Intelligent Packaging
4. Key Success Factors
4.1. Product Adoption/Usage Analysis
4.2. Product USPs / Features
5. Global Intelligent Packaging Market Demand Analysis 2015-2020 and Forecast, 2021-2031
5.1. Historical Market Volume (Units) Analysis, 2015-2020
5.2. Current and Future Market Volume (Units) Projections, 2021-2031
5.3. Y-o-Y Growth Trend Analysis
6. Global Intelligent Packaging Market - Pricing Analysis
6.1. Regional Pricing Analysis
6.2. Global Average Pricing Analysis Benchmark
7. Global Intelligent Packaging Market Demand (in Value or Size in US$ Mn) Analysis 2015-2020 and Forecast, 2021-2031
7.1. Historical Market Value (US$ Mn) Analysis, 2015-2020
7.2. Current and Future Market Value (US$ Mn) Projections, 2021-2031
7.2.1. Y-o-Y Growth Trend Analysis
7.2.2. Absolute $ Opportunity Analysis
8. Market Background
8.1. Global Packaging Market Outlook
8.2. Global Flexible Packaging Market Outlook
8.3. Global Rigid Packaging Market Outlook
8.4. Consumer Sentiment Analysis
8.5. Key Industry Perspective: What Industry Leaders are saying?
8.6. Key Regulations for Packaging
8.7. Cost Tier Down Structure
8.7.1. Raw Material Cost
8.7.2. Labour Cost
8.7.3. Manufacturing Overheads
8.7.4. Non-Manufacturing Overheads
8.7.5. Others
8.8. Macro-Economic Factors
8.8.1. Global GDP Growth Outlook
8.8.2. GDP Per Capita
8.8.3. Manufacturing Value Added
8.8.4. Industrial Production
8.9. Forecast Factors - Relevance & Impact
8.9.1. Industrial Sector Growth
8.9.2. E-Commerce Industry Growth
8.9.3. Organized Retail Industry Growth
8.9.4. Regional Manufacturing Value Added Growth
8.9.5. Segmental Revenue Growth of Key Players
8.9.6. Top Companies Historical Revenue Growth
8.9.7. Technology Spending
8.10. Value Chain Analysis
8.10.1. Key Participants
8.10.1.1. Raw Material Suppliers
8.10.1.2. Intelligent Packaging Manufacturers
8.10.1.3. Co-packers
8.10.1.4. End-users/Brand Owners
8.10.2. Profitability Margin
8.11. Market Dynamics
8.11.1. Drivers
8.11.2. Restraints
8.11.3. Opportunity Analysis
8.12. Impact of COVID-19
8.12.1. Current Statistics and Probable Future Impact
8.12.2. Impact of COVID-19 on Intelligent Packaging Market
8.13. Intelligent Packaging Initiatives by Brand Owners
9. Global Intelligent Packaging Market Analysis 2015-2020 and Forecast 2021-2031, By Technology
9.1. Historical Market Size (US$ Mn) and Volume (Units) Analysis, by Technology, 2015-2020
9.2. Current and Future Market Size (US$ Mn) and Volume (Units) Analysis and Forecast, by Technology, 2021-2031
9.2.1. Indicators
9.2.1.1. Time-Temperature Indicators
9.2.1.2. Gas & Integrity Indicators
9.2.1.3. Freshness Indicators
9.2.2. Sensors
9.2.3. Interactive Packaging/Data Carriers
9.2.3.1. Quick-response (QR Codes)
9.2.3.2. Barcodes
9.2.3.3. Radio Frequency Identification (RFIDs)
9.2.3.4. Near Field Communications (NFCs)
9.2.3.5. Bluetooth Low Energy (BLE)
9.2.4. Active Packaging
9.2.4.1. Oxygen Scavengers
9.2.4.2. Ethylene Absorbers
9.2.4.3. Moisture Scavengers
9.2.4.4. Anti-microbial Packaging
9.3. Market Attractiveness Analysis, by Technology
10. Global Intelligent Packaging Market Analysis 2015-2020 and Forecast 2021-2031, By Level of Packaging
10.1. Historical Market Size (US$ Mn) and Volume (Units) Analysis, by Level of Packaging, 2015-2020
10.2. Current and Future Market Size (US$ Mn) and Volume (Units) Analysis and Forecast, by Level of Packaging, 2021-2031
10.2.1. Primary Packaging
10.2.2. Secondary Packaging
10.2.3. Tertiary Packaging
10.3. Market Attractiveness Analysis, by Level of Packaging
11. Global Intelligent Packaging Market Analysis 2015-2020 and Forecast 2021-2031, by Application
11.1. Historical Market Size (US$ Mn) and Volume (Units) Analysis, by Application, 2015-2020
11.2. Current and Future Market Size (US$ Mn) and Volume (Units) Analysis and Forecast, by Application, 2021-2031
11.2.1. Bottles & Jars
11.2.2. Blisters
11.2.3. Trays & Clamshells
11.2.4. Cans
11.2.5. Boxes & Cartons
11.2.6. Vials, Ampoules, & Prefilled Syringes
11.2.7. Bags & Pouches
11.2.8. Films & Wraps
11.2.9. Mailers
11.2.10. Labels, Tapes, & Tags
11.2.11. Others
11.3. Market Attractiveness Analysis, by Application
12. Global Intelligent Packaging Market Analysis 2015-2020 and Forecast 2021-2031, by End Use
12.1. Historical Market Size (US$ Mn) and Volume (Units) Analysis, by End Use, 2015-2020
12.2. Current and Future Market Size (US$ Mn) and Volume (Units) Analysis and Forecast, by End Use, 2021-2031
12.2.1. Food
12.2.1.1. Meat, Poultry, & Seafood
12.2.1.2. Fruits & Vegetables
12.2.1.3. Dairy Products
12.2.1.4. Bakery & Confectionary
12.2.1.5. Processed Food
12.2.1.6. Ready to Eat Food
12.2.1.7. Others
12.2.2. Beverage
12.2.3. Healthcare
12.2.3.1. Medical Devices
12.2.3.2. Medical Supplies
12.2.3.3. Pharmaceuticals
12.2.4. Cosmetics
12.2.5. Logistics & Transport
12.2.6. Consumer Electronics
12.2.7. Consumer Goods
12.2.8. Personal Care & Homecare
12.2.9. Others
12.3. Market Attractiveness Analysis, by End Use
13. Global Intelligent Packaging Market Analysis 2015-2020 and Forecast 2021-2031, by Region
13.1. Historical Market Size (US$ Mn) and Volume (Units) Analysis, by Region, 2015-2020
13.2. Current and Future Market Size (US$ Mn) and Volume (Units) Analysis and Forecast, by Region, 2021-2031
13.2.1. North America
13.2.2. Latin America
13.2.3. Europe
13.2.4. South Asia
13.2.5. East Asia
13.2.6. Oceania
13.2.7. Middle East and Africa (MEA)
13.3. Market Attractiveness Analysis, by Region
14. North America Intelligent Packaging Market Analysis 2015-2020 and Forecast 2021-2031
14.1. Introduction
14.2. Historical Market Size (US$ Mn) and Volume (Units) Trend Analysis, by Market Taxonomy, 2015-2020
14.3. Market Size (US$ Mn) and Volume (Units) Forecast, by Market Taxonomy, 2021-2031
14.3.1. By Country
14.3.1.1. U.S.
14.3.1.2. Canada
14.3.2. By Technology
14.3.3. By Level of Packaging
14.3.4. By Application
14.3.5. By End Use
14.4. Market Attractiveness Analysis
14.4.1. By Country
14.4.2. By Technology
14.4.3. By Level of Packaging
14.4.4. By Application
14.4.5. By End Use
14.5. Impact on Driver and Restraint
14.6. Intensity Mapping – by Key Players
15. Latin America Intelligent Packaging Market Analysis 2015-2020 and Forecast 2021-2031
15.1. Introduction
15.2. Historical Market Size (US$ Mn) and Volume (Units) Trend Analysis, by Market Taxonomy, 2015-2020
15.3. Market Size (US$ Mn) and Volume (Units) Forecast, by Market Taxonomy, 2021-2031
15.3.1. By Country
15.3.1.1. Brazil
15.3.1.2. Mexico
15.3.1.3. Argentina
15.3.1.4. Rest of Latin America
15.3.2. By Technology
15.3.3. By Level of Packaging
15.3.4. By Application
15.3.5. By End Use
15.4. Market Attractiveness Analysis
15.4.1. By Country
15.4.2. By Technology
15.4.3. By Level of Packaging
15.4.4. By Application
15.4.5. By End Use
15.5. Impact on Driver and Restraint
15.6. Intensity Mapping – by Key Players
16. Europe Intelligent Packaging Market Analysis 2015-2020 and Forecast 2021-2031
16.1. Introduction
16.2. Historical Market Size (US$ Mn) and Volume (Units) Trend Analysis, by Market Taxonomy, 2015-2020
16.3. Market Size (US$ Mn) and Volume (Units) Forecast, by Market Taxonomy, 2021-2031
16.3.1. By Country
16.3.1.1. Germany
16.3.1.2. Italy
16.3.1.3. France
16.3.1.4. U.K.
16.3.1.5. Spain
16.3.1.6. BENELUX
16.3.1.7. Nordics
16.3.1.8. Russia
16.3.1.9. Poland
16.3.1.10. Rest of Europe
16.3.2. By Technology
16.3.3. By Level of Packaging
16.3.4. By Application
16.3.5. By End Use
16.4. Market Attractiveness Analysis
16.4.1. By Country
16.4.2. By Technology
16.4.3. By Level of Packaging
16.4.4. By Application
16.4.5. By End Use
16.5. Impact on Driver and Restraint
16.6. Intensity Mapping – by Key Players
17. South Asia Intelligent Packaging Market Analysis 2015-2020 and Forecast 2021-2031
17.1. Introduction
17.2. Historical Market Size (US$ Mn) and Volume (Units) Trend Analysis, by Market Taxonomy, 2015-2020
17.3. Market Size (US$ Mn) and Volume (Units) Forecast, by Market Taxonomy, 2021-2031
17.3.1. By Country
17.3.1.1. India
17.3.1.2. Thailand
17.3.1.3. Indonesia
17.3.1.4. Malaysia
17.3.1.5. Rest of South Asia
17.3.2. By Technology
17.3.3. By Level of Packaging
17.3.4. By Application
17.3.5. By End Use
17.4. Market Attractiveness Analysis
17.4.1. By Country
17.4.2. By Technology
17.4.3. By Level of Packaging
17.4.4. By Application
17.4.5. By End Use
17.5. Impact on Driver and Restraint
17.6. Intensity Mapping – by Key Players
18. East Asia Intelligent Packaging Market Analysis 2015-2020 and Forecast 2021-2031
18.1. Introduction
18.2. Historical Market Size (US$ Mn) and Volume (Units) Trend Analysis, by Market Taxonomy, 2015-2020
18.3. Market Size (US$ Mn) and Volume (Units) Forecast, by Market Taxonomy, 2021-2031
18.3.1. By Country
18.3.1.1. China
18.3.1.2. Japan
18.3.1.3. South Korea
18.3.2. By Technology
18.3.3. By Level of Packaging
18.3.4. By Application
18.3.5. By End Use
18.4. Market Attractiveness Analysis
18.4.1. By Country
18.4.2. By Technology
18.4.3. By Level of Packaging
18.4.4. By Application
18.4.5. By End Use
18.5. Impact on Driver and Restraint
18.6. Intensity Mapping – by Key Players
19. Oceania Intelligent Packaging Market Analysis 2015-2020 and Forecast 2021-2031
19.1. Introduction
19.2. Historical Market Size (US$ Mn) and Volume (Units) Trend Analysis, by Market Taxonomy, 2015-2020
19.3. Market Size (US$ Mn) and Volume (Units) Forecast, by Market Taxonomy, 2021-2031
19.3.1. By Country
19.3.1.1. Australia
19.3.1.2. New Zealand
19.3.2. By Technology
19.3.3. By Level of Packaging
19.3.4. By Application
19.3.5. By End Use
19.4. Market Attractiveness Analysis
19.4.1. By Country
19.4.2. By Technology
19.4.3. By Level of Packaging
19.4.4. By Application
19.4.5. By End Use
19.5. Impact on Driver and Restraint
19.6. Intensity Mapping – by Key Players
20. Middle East and Africa Intelligent Packaging Market Analysis 2015-2020 and Forecast 2021-2031
20.1. Introduction
20.2. Historical Market Size (US$ Mn) and Volume (Units) Trend Analysis, by Market Taxonomy, 2015-2020
20.3. Market Size (US$ Mn) and Volume (Units) Forecast, by Market Taxonomy, 2021-2031
20.3.1. By Country
20.3.1.1. GCC Countries
20.3.1.2. Turkey
20.3.1.3. Northern Africa
20.3.1.4. South Africa
20.3.1.5. Rest of Middle East and Africa
20.3.2. By Technology
20.3.3. By Level of Packaging
20.3.4. By Application
20.3.5. By End Use
20.4. Market Attractiveness Analysis
20.4.1. By Country
20.4.2. By Technology
20.4.3. By Level of Packaging
20.4.4. By Application
20.4.5. By End Use
20.5. Impact on Driver and Restraint
20.6. Intensity Mapping – by Key Players
21. Intelligent Packaging Market Country wise Analysis 2021 & 2031
21.1. U.S. Intelligent Packaging Market Analysis
21.1.1. Market Volume (Units) and Value (US$ Mn) Analysis and Forecast, by Market Taxonomy
21.1.1.1. By Technology
21.1.1.2. By Level of Packaging
21.1.1.3. By Application
21.1.1.4. By End Use
21.2. Canada Intelligent Packaging Market Analysis
21.2.1. Market Volume (Units) and Value (US$ Mn) Analysis and Forecast, by Market Taxonomy
21.2.1.1. By Technology
21.2.1.2. By Level of Packaging
21.2.1.3. By Application
21.2.1.4. By End Use
21.3. Brazil Intelligent Packaging Market Analysis
21.3.1. Market Volume (Units) and Value (US$ Mn) Analysis and Forecast, by Market Taxonomy
21.3.1.1. By Technology
21.3.1.2. By Level of Packaging
21.3.1.3. By Application
21.3.1.4. By End Use
21.4. Mexico Intelligent Packaging Market Analysis
21.4.1. Market Volume (Units) and Value (US$ Mn) Analysis and Forecast, by Market Taxonomy
21.4.1.1. By Technology
21.4.1.2. By Level of Packaging
21.4.1.3. By Application
21.4.1.4. By End Use
21.5. Germany Intelligent Packaging Market Analysis
21.5.1. Market Volume (Units) and Value (US$ Mn) Analysis and Forecast, by Market Taxonomy
21.5.1.1. By Technology
21.5.1.2. By Level of Packaging
21.5.1.3. By Application
21.5.1.4. By End Use
21.6. Italy Intelligent Packaging Market Analysis
21.6.1. Market Volume (Units) and Value (US$ Mn) Analysis and Forecast, by Market Taxonomy
21.6.1.1. By Technology
21.6.1.2. By Level of Packaging
21.6.1.3. By Application
21.6.1.4. By End Use
21.7. France Intelligent Packaging Market Analysis
21.7.1. Market Volume (Units) and Value (US$ Mn) Analysis and Forecast, by Market Taxonomy
21.7.1.1. By Technology
21.7.1.2. By Level of Packaging
21.7.1.3. By Application
21.7.1.4. By End Use
21.8. U.K. Intelligent Packaging Market Analysis
21.8.1. Market Volume (Units) and Value (US$ Mn) Analysis and Forecast, by Market Taxonomy
21.8.1.1. By Technology
21.8.1.2. By Level of Packaging
21.8.1.3. By Application
21.8.1.4. By End Use
21.9. Spain Intelligent Packaging Market Analysis
21.9.1. Market Volume (Units) and Value (US$ Mn) Analysis and Forecast, by Market Taxonomy
21.9.1.1. By Technology
21.9.1.2. By Level of Packaging
21.9.1.3. By Application
21.9.1.4. By End Use
21.10. Russia Intelligent Packaging Market Analysis
21.10.1. Market Volume (Units) and Value (US$ Mn) Analysis and Forecast, by Market Taxonomy
21.10.1.1. By Technology
21.10.1.2. By Level of Packaging
21.10.1.3. By Application
21.10.1.4. By End Use
21.11. GCC Countries Intelligent Packaging Market Analysis
21.11.1. Market Volume (Units) and Value (US$ Mn) Analysis and Forecast, by Market Taxonomy
21.11.1.1. By Technology
21.11.1.2. By Level of Packaging
21.11.1.3. By Application
21.11.1.4. By End Use
21.12. Japan Intelligent Packaging Market Analysis
21.12.1. Market Volume (Units) and Value (US$ Mn) Analysis and Forecast, by Market Taxonomy
21.12.1.1. By Technology
21.12.1.2. By Level of Packaging
21.12.1.3. By Application
21.12.1.4. By End Use
21.13. India Intelligent Packaging Market Analysis
21.13.1. Market Volume (Units) and Value (US$ Mn) Analysis and Forecast, by Market Taxonomy
21.13.1.1. By Technology
21.13.1.2. By Level of Packaging
21.13.1.3. By Application
21.13.1.4. By End Use
21.14. China Intelligent Packaging Market Analysis
21.14.1. Market Volume (Units) and Value (US$ Mn) Analysis and Forecast, by Market Taxonomy
21.14.1.1. By Technology
21.14.1.2. By Level of Packaging
21.14.1.3. By Application
21.14.1.4. By End Use
21.15. Australia Intelligent Packaging Market Analysis
21.15.1. Market Volume (Units) and Value (US$ Mn) Analysis and Forecast, by Market Taxonomy
21.15.1.1. By Technology
21.15.1.2. By Level of Packaging
21.15.1.3. By Application
21.15.1.4. By End Use
22. Market Structure Analysis
22.1. Market Analysis, by Tier of Intelligent Packaging Companies
22.2. Market Concentration
22.3. Market Share Analysis of Top Players
22.4. Market Presence Analysis
23. Competition Analysis
23.1. Competition Dashboard
23.2. Competition Benchmarking
23.3. Competition Deep Dive
(Packaging Manufacturers)
23.3.1. Amcor plc.
23.3.1.1. Overview
23.3.1.2. Product Portfolio
23.3.1.3. Profitability by Market Segments
23.3.1.4. Sales Footprint
23.3.1.5. Strategy Overview
23.3.1.5.1. Marketing Strategy
23.3.1.5.2. Product Strategy
23.3.1.5.3. Channel Strategy
23.3.2. Crown Holding Inc.
23.3.2.1. Overview
23.3.2.2. Product Portfolio
23.3.2.3. Profitability by Market Segments
23.3.2.4. Sales Footprint
23.3.2.5. Strategy Overview
23.3.2.5.1. Marketing Strategy
23.3.2.5.2. Product Strategy
23.3.2.5.3. Channel Strategy
23.3.3. 3M Company
23.3.3.1. Overview
23.3.3.2. Product Portfolio
23.3.3.3. Profitability by Market Segments
23.3.3.4. Sales Footprint
23.3.3.5. Strategy Overview
23.3.3.5.1. Marketing Strategy
23.3.3.5.2. Product Strategy
23.3.3.5.3. Channel Strategy
23.3.4. CCL Industries Inc.
23.3.4.1. Overview
23.3.4.2. Product Portfolio
23.3.4.3. Profitability by Market Segments
23.3.4.4. Sales Footprint
23.3.4.5. Strategy Overview
23.3.4.5.1. Marketing Strategy
23.3.4.5.2. Product Strategy
23.3.4.5.3. Channel Strategy
23.3.5. Huhtamaki Global
23.3.5.1. Overview
23.3.5.2. Product Portfolio
23.3.5.3. Profitability by Market Segments
23.3.5.4. Sales Footprint
23.3.5.5. Strategy Overview
23.3.5.5.1. Marketing Strategy
23.3.5.5.2. Product Strategy
23.3.5.5.3. Channel Strategy
23.3.6. DS Smith
23.3.6.1. Overview
23.3.6.2. Product Portfolio
23.3.6.3. Profitability by Market Segments
23.3.6.4. Sales Footprint
23.3.6.5. Strategy Overview
23.3.6.5.1. Marketing Strategy
23.3.6.5.2. Product Strategy
23.3.6.5.3. Channel Strategy
23.3.7. Avery Dennison Corporation
23.3.7.1. Overview
23.3.7.2. Product Portfolio
23.3.7.3. Profitability by Market Segments
23.3.7.4. Sales Footprint
23.3.7.5. Strategy Overview
23.3.7.5.1. Marketing Strategy
23.3.7.5.2. Product Strategy
23.3.7.5.3. Channel Strategy
23.3.8. Honeywell International Inc.
23.3.8.1. Overview
23.3.8.2. Product Portfolio
23.3.8.3. Profitability by Market Segments
23.3.8.4. Sales Footprint
23.3.8.5. Strategy Overview
23.3.8.5.1. Marketing Strategy
23.3.8.5.2. Product Strategy
23.3.8.5.3. Channel Strategy
23.3.9. Tetra Pak International S.A.
23.3.9.1. Overview
23.3.9.2. Product Portfolio
23.3.9.3. Profitability by Market Segments
23.3.9.4. Sales Footprint
23.3.9.5. Strategy Overview
23.3.9.5.1. Marketing Strategy
23.3.9.5.2. Product Strategy
23.3.9.5.3. Channel Strategy
23.3.10. Sealed Air Corporation
23.3.10.1. Overview
23.3.10.2. Product Portfolio
23.3.10.3. Profitability by Market Segments
23.3.10.4. Sales Footprint
23.3.10.5. Strategy Overview
23.3.10.5.1. Marketing Strategy
23.3.10.5.2. Product Strategy
23.3.10.5.3. Channel Strategy
23.3.11. Stora Enso
23.3.11.1. Overview
23.3.11.2. Product Portfolio
23.3.11.3. Profitability by Market Segments
23.3.11.4. Sales Footprint
23.3.11.5. Strategy Overview
23.3.11.5.1. Marketing Strategy
23.3.11.5.2. Product Strategy
23.3.11.5.3. Channel Strategy
23.3.12. WestRock Company
23.3.12.1. Overview
23.3.12.2. Product Portfolio
23.3.12.3. Profitability by Market Segments
23.3.12.4. Sales Footprint
23.3.12.5. Strategy Overview
23.3.12.5.1. Marketing Strategy
23.3.12.5.2. Product Strategy
23.3.12.5.3. Channel Strategy
23.3.13. Ball Corporation
23.3.13.1. Overview
23.3.13.2. Product Portfolio
23.3.13.3. Profitability by Market Segments
23.3.13.4. Sales Footprint
23.3.13.5. Strategy Overview
23.3.13.5.1. Marketing Strategy
23.3.13.5.2. Product Strategy
23.3.13.5.3. Channel Strategy
23.3.14. Mondi Plc.
23.3.14.1. Overview
23.3.14.2. Product Portfolio
23.3.14.3. Profitability by Market Segments
23.3.14.4. Sales Footprint
23.3.14.5. Strategy Overview
23.3.14.5.1. Marketing Strategy
23.3.14.5.2. Product Strategy
23.3.14.5.3. Channel Strategy
23.3.15. International Paper Company
23.3.15.1. Overview
23.3.15.2. Product Portfolio
23.3.15.3. Profitability by Market Segments
23.3.15.4. Sales Footprint
23.3.15.5. Strategy Overview
23.3.15.5.1. Marketing Strategy
23.3.15.5.2. Product Strategy
23.3.15.5.3. Channel Strategy
23.3.16. Georgia-Pacific LLC
23.3.16.1. Overview
23.3.16.2. Product Portfolio
23.3.16.3. Profitability by Market Segments
23.3.16.4. Sales Footprint
23.3.16.5. Strategy Overview
23.3.16.5.1. Marketing Strategy
23.3.16.5.2. Product Strategy
23.3.16.5.3. Channel Strategy
23.3.17. UPM-Kymmene Oyj
23.3.17.1. Overview
23.3.17.2. Product Portfolio
23.3.17.3. Profitability by Market Segments
23.3.17.4. Sales Footprint
23.3.17.5. Strategy Overview
23.3.17.5.1. Marketing Strategy
23.3.17.5.2. Product Strategy
23.3.17.5.3. Channel Strategy
23.3.18. Coveris Holdings S.A.
23.3.18.1. Overview
23.3.18.2. Product Portfolio
23.3.18.3. Profitability by Market Segments
23.3.18.4. Sales Footprint
23.3.18.5. Strategy Overview
23.3.18.5.1. Marketing Strategy
23.3.18.5.2. Product Strategy
23.3.18.5.3. Channel Strategy
23.3.19. DuPont Teijin Films US
23.3.19.1. Overview
23.3.19.2. Product Portfolio
23.3.19.3. Profitability by Market Segments
23.3.19.4. Sales Footprint
23.3.19.5. Strategy Overview
23.3.19.5.1. Marketing Strategy
23.3.19.5.2. Product Strategy
23.3.19.5.3. Channel Strategy
23.3.20. Sigma Plastics Group
23.3.20.1. Overview
23.3.20.2. Product Portfolio
23.3.20.3. Profitability by Market Segments
23.3.20.4. Sales Footprint
23.3.20.5. Strategy Overview
23.3.20.5.1. Marketing Strategy
23.3.20.5.2. Product Strategy
23.3.20.5.3. Channel Strategy
(Technology Providers)
23.3.21. Timestrip UK Ltd
23.3.21.1. Overview
23.3.21.2. Product Portfolio
23.3.21.3. Profitability by Market Segments
23.3.21.4. Sales Footprint
23.3.21.5. Strategy Overview
23.3.21.5.1. Marketing Strategy
23.3.21.5.2. Product Strategy
23.3.21.5.3. Channel Strategy
23.3.22. Varcode, Ltd.
23.3.22.1. Overview
23.3.22.2. Product Portfolio
23.3.22.3. Profitability by Market Segments
23.3.22.4. Sales Footprint
23.3.22.5. Strategy Overview
23.3.22.5.1. Marketing Strategy
23.3.22.5.2. Product Strategy
23.3.22.5.3. Channel Strategy
23.3.23. Temptime Corporation
23.3.23.1. Overview
23.3.23.2. Product Portfolio
23.3.23.3. Profitability by Market Segments
23.3.23.4. Sales Footprint
23.3.23.5. Strategy Overview
23.3.23.5.1. Marketing Strategy
23.3.23.5.2. Product Strategy
23.3.23.5.3. Channel Strategy
23.3.24. DeltaTrak, Inc.
23.3.24.1. Overview
23.3.24.2. Product Portfolio
23.3.24.3. Profitability by Market Segments
23.3.24.4. Sales Footprint
23.3.24.5. Strategy Overview
23.3.24.5.1. Marketing Strategy
23.3.24.5.2. Product Strategy
23.3.24.5.3. Channel Strategy
23.3.25. EVIGENCE SENSORS
23.3.25.1. Overview
23.3.25.2. Product Portfolio
23.3.25.3. Profitability by Market Segments
23.3.25.4. Sales Footprint
23.3.25.5. Strategy Overview
23.3.25.5.1. Marketing Strategy
23.3.25.5.2. Product Strategy
23.3.25.5.3. Channel Strategy
23.3.26. JRI Company
23.3.26.1. Overview
23.3.26.2. Product Portfolio
23.3.26.3. Profitability by Market Segments
23.3.26.4. Sales Footprint
23.3.26.5. Strategy Overview
23.3.26.5.1. Marketing Strategy
23.3.26.5.2. Product Strategy
23.3.26.5.3. Channel Strategy
23.3.27. Vitsab International AB
23.3.27.1. Overview
23.3.27.2. Product Portfolio
23.3.27.3. Profitability by Market Segments
23.3.27.4. Sales Footprint
23.3.27.5. Strategy Overview
23.3.27.5.1. Marketing Strategy
23.3.27.5.2. Product Strategy
23.3.27.5.3. Channel Strategy
23.3.28. LAXCEN TECHNOLOGY INC.
23.3.28.1. Overview
23.3.28.2. Product Portfolio
23.3.28.3. Profitability by Market Segments
23.3.28.4. Sales Footprint
23.3.28.5. Strategy Overview
23.3.28.5.1. Marketing Strategy
23.3.28.5.2. Product Strategy
23.3.28.5.3. Channel Strategy
23.3.29. APK-ID
23.3.29.1. Overview
23.3.29.2. Product Portfolio
23.3.29.3. Profitability by Market Segments
23.3.29.4. Sales Footprint
23.3.29.5. Strategy Overview
23.3.29.5.1. Marketing Strategy
23.3.29.5.2. Product Strategy
23.3.29.5.3. Channel Strategy
23.3.30. STARNFC Technologies Ltd.
23.3.30.1. Overview
23.3.30.2. Product Portfolio
23.3.30.3. Profitability by Market Segments
23.3.30.4. Sales Footprint
23.3.30.5. Strategy Overview
23.3.30.5.1. Marketing Strategy
23.3.30.5.2. Product Strategy
23.3.30.5.3. Channel Strategy
(Material Providers)
23.3.31. Dow Chemical Company
23.3.31.1. Overview
23.3.31.2. Product Portfolio
23.3.31.3. Profitability by Market Segments
23.3.31.4. Sales Footprint
23.3.31.5. Strategy Overview
23.3.31.5.1. Marketing Strategy
23.3.31.5.2. Product Strategy
23.3.31.5.3. Channel Strategy
23.3.32. LyondellBasell Industries N.V
23.3.32.1. Overview
23.3.32.2. Product Portfolio
23.3.32.3. Profitability by Market Segments
23.3.32.4. Sales Footprint
23.3.32.5. Strategy Overview
23.3.32.5.1. Marketing Strategy
23.3.32.5.2. Product Strategy
23.3.32.5.3. Channel Strategy
23.3.33. BASF SE
23.3.33.1. Overview
23.3.33.2. Product Portfolio
23.3.33.3. Profitability by Market Segments
23.3.33.4. Sales Footprint
23.3.33.5. Strategy Overview
23.3.33.5.1. Marketing Strategy
23.3.33.5.2. Product Strategy
23.3.33.5.3. Channel Strategy
23.3.34. Exxon Mobil Corporation
23.3.34.1. Overview
23.3.34.2. Product Portfolio
23.3.34.3. Profitability by Market Segments
23.3.34.4. Sales Footprint
23.3.34.5. Strategy Overview
23.3.34.5.1. Marketing Strategy
23.3.34.5.2. Product Strategy
23.3.34.5.3. Channel Strategy
23.3.35. Saudi Basic Industries Corporation
23.3.35.1. Overview
23.3.35.2. Product Portfolio
23.3.35.3. Profitability by Market Segments
23.3.35.4. Sales Footprint
23.3.35.5. Strategy Overview
23.3.35.5.1. Marketing Strategy
23.3.35.5.2. Product Strategy
23.3.35.5.3. Channel Strategy
23.3.36. Ineos Group Limited
23.3.36.1. Overview
23.3.36.2. Product Portfolio
23.3.36.3. Profitability by Market Segments
23.3.36.4. Sales Footprint
23.3.36.5. Strategy Overview
23.3.36.5.1. Marketing Strategy
23.3.36.5.2. Product Strategy
23.3.36.5.3. Channel Strategy
23.3.37. Eni S.p.A.
23.3.37.1. Overview
23.3.37.2. Product Portfolio
23.3.37.3. Profitability by Market Segments
23.3.37.4. Sales Footprint
23.3.37.5. Strategy Overview
23.3.37.5.1. Marketing Strategy
23.3.37.5.2. Product Strategy
23.3.37.5.3. Channel Strategy
23.3.38. LG Chemical
23.3.38.1. Overview
23.3.38.2. Product Portfolio
23.3.38.3. Profitability by Market Segments
23.3.38.4. Sales Footprint
23.3.38.5. Strategy Overview
23.3.38.5.1. Marketing Strategy
23.3.38.5.2. Product Strategy
23.3.38.5.3. Channel Strategy
23.3.39. Lanxess AG
23.3.39.1. Overview
23.3.39.2. Product Portfolio
23.3.39.3. Profitability by Market Segments
23.3.39.4. Sales Footprint
23.3.39.5. Strategy Overview
23.3.39.5.1. Marketing Strategy
23.3.39.5.2. Product Strategy
23.3.39.5.3. Channel Strategy
23.3.40. Chevron Phillips Chemical Company, LLC
23.3.40.1. Overview
23.3.40.2. Product Portfolio
23.3.40.3. Profitability by Market Segments
23.3.40.4. Sales Footprint
23.3.40.5. Strategy Overview
23.3.40.5.1. Marketing Strategy
23.3.40.5.2. Product Strategy
23.3.40.5.3. Channel Strategy
24. Assumptions and Acronyms Used
25. Research Methodology
Let us know your requirement to get
100% FREE customization
List of Tables
Table 01: Global Intelligent Packaging Market Volume (Units) Analysis and Forecast, By Technology, 2015(H)-2031(F)
Table 02: Global Intelligent Packaging Market Value (US$ Mn) Analysis and Forecast, By Technology, 2015(H)-2031(F)
Table 03: Global Intelligent Packaging Market Volume (Units) Analysis and Forecast, By Level of Packaging, 2015(H)-2031(F)
Table 04: Global Intelligent Packaging Market Value (US$ Mn) Analysis and Forecast, By Level of Packaging, 2015(H)-2031(F)
Table 05: Global Intelligent Packaging Market Volume (Units) Analysis and Forecast, By Application, 2015(H)-2031(F)
Table 06: Global Intelligent Packaging Market Value (US$ Mn) Analysis and Forecast, By Application, 2015(H)-2031(F)
Table 07: Global Intelligent Packaging Market Volume (Units) Analysis and Forecast, By End Use, 2015(H)-2031(F)
Table 08: Global Intelligent Packaging Market Value (US$ Mn) Analysis and Forecast, By End Use, 2015(H)-2031(F)
Table 09: Global Intelligent Packaging Market Volume (Units) Analysis and Forecast, By Region, 2015(H)-2031(F)
Table 10: Global Intelligent Packaging Market Value (US$ Mn) Analysis and Forecast, By Region, 2015(H)-2031(F)
Table 11: North America Intelligent Packaging Market Volume (Units) Analysis and Forecast, By Technology, 2015(H)-2031(F)
Table 12: North America Intelligent Packaging Market Value (US$ Mn) Analysis and Forecast, By Technology, 2015(H)-2031(F)
Table 13: North America Intelligent Packaging Market Volume (Units) Analysis and Forecast, By Level of Packaging, 2015(H)-2031(F)
Table 14: North America Intelligent Packaging Market Value (US$ Mn) Analysis and Forecast, By Level of Packaging, 2015(H)-2031(F)
Table 15: North America Intelligent Packaging Market Volume (Units) Analysis and Forecast, By Application, 2015(H)-2031(F)
Table 16: North America Intelligent Packaging Market Value (US$ Mn) Analysis and Forecast, By Application, 2015(H)-2031(F)
Table 17: North America Intelligent Packaging Market Volume (Units) Analysis and Forecast, By End Use, 2015(H)-2031(F)
Table 18: North America Intelligent Packaging Market Value (US$ Mn) Analysis and Forecast, By End Use, 2015(H)-2031(F)
Table 19: North America Intelligent Packaging Market Volume (Units) Analysis and Forecast, By Country, 2015(H)-2031(F)
Table 20: North America Intelligent Packaging Market Value (US$ Mn) Analysis and Forecast, By Country, 2015(H)-2031(F)
Table 21: Latin America Intelligent Packaging Market Volume (Units) Analysis and Forecast, By Technology, 2015(H)-2031(F)
Table 22: Latin America Intelligent Packaging Market Value (US$ Mn) Analysis and Forecast, By Technology, 2015(H)-2031(F)
Table 23: Latin America Intelligent Packaging Market Volume (Units) Analysis and Forecast, By Level of Packaging, 2015(H)-2031(F)
Table 24: Latin America Intelligent Packaging Market Value (US$ Mn) Analysis and Forecast, By Level of Packaging, 2015(H)-2031(F)
Table 25: Latin America Intelligent Packaging Market Volume (Units) Analysis and Forecast, By Application, 2015(H)-2031(F)
Table 26: Latin America Intelligent Packaging Market Value (US$ Mn) Analysis and Forecast, By Application, 2015(H)-2031(F)
Table 27: Latin America Intelligent Packaging Market Volume (Units) Analysis and Forecast, By End Use, 2015(H)-2031(F)
Table 28: Latin America Intelligent Packaging Market Value (US$ Mn) Analysis and Forecast, By End Use, 2015(H)-2031(F)
Table 29: Latin America Intelligent Packaging Market Volume (Units) Analysis and Forecast, By Country, 2015(H)-2031(F)
Table 30: Latin America Intelligent Packaging Market Value (US$ Mn) Analysis and Forecast, By Country, 2015(H)-2031(F)
Table 31: Europe Intelligent Packaging Market Volume (Units) Analysis and Forecast, By Technology, 2015(H)-2031(F)
Table 32: Europe Intelligent Packaging Market Value (US$ Mn) Analysis and Forecast, By Technology, 2015(H)-2031(F)
Table 33: Europe Intelligent Packaging Market Volume (Units) Analysis and Forecast, By Level of Packaging, 2015(H)-2031(F)
Table 34: Europe Intelligent Packaging Market Value (US$ Mn) Analysis and Forecast, By Level of Packaging, 2015(H)-2031(F)
Table 35: Europe Intelligent Packaging Market Volume (Units) Analysis and Forecast, By Application, 2015(H)-2031(F)
Table 36: Europe Intelligent Packaging Market Value (US$ Mn) Analysis and Forecast, By Application, 2015(H)-2031(F)
Table 37: Europe Intelligent Packaging Market Volume (Units) Analysis and Forecast, By End Use, 2015(H)-2031(F)
Table 38: Europe Intelligent Packaging Market Value (US$ Mn) Analysis and Forecast, By End Use, 2015(H)-2031(F)
Table 39: Europe Intelligent Packaging Market Volume (Units) Analysis and Forecast, By Country, 2015(H)-2031(F)
Table 40: Europe Intelligent Packaging Market Value (US$ Mn) Analysis and Forecast, By Country, 2015(H)-2031(F)
Table 41: South Asia Intelligent Packaging Market Volume (Units) Analysis and Forecast, By Technology, 2015(H)-2031(F)
Table 42: South Asia Intelligent Packaging Market Value (US$ Mn) Analysis and Forecast, By Technology, 2015(H)-2031(F)
Table 43: South Asia Intelligent Packaging Market Volume (Units) Analysis and Forecast, By Level of Packaging, 2015(H)-2031(F)
Table 44: South Asia Intelligent Packaging Market Value (US$ Mn) Analysis and Forecast, By Level of Packaging, 2015(H)-2031(F)
Table 45: South Asia Intelligent Packaging Market Volume (Units) Analysis and Forecast, By Application, 2015(H)-2031(F)
Table 46: South Asia Intelligent Packaging Market Value (US$ Mn) Analysis and Forecast, By Application, 2015(H)-2031(F)
Table 47: South Asia Intelligent Packaging Market Volume (Units) Analysis and Forecast, By End Use, 2015(H)-2031(F)
Table 48: South Asia Intelligent Packaging Market Value (US$ Mn) Analysis and Forecast, By End Use, 2015(H)-2031(F)
Table 49: South Asia Intelligent Packaging Market Volume (Units) Analysis and Forecast, By Country, 2015(H)-2031(F)
Table 50: South Asia Intelligent Packaging Market Value (US$ Mn) Analysis and Forecast, By Country, 2015(H)-2031(F)
Table 51: East Asia Intelligent Packaging Market Volume (Units) Analysis and Forecast, By Technology, 2015(H)-2031(F)
Table 52: East Asia Intelligent Packaging Market Value (US$ Mn) Analysis and Forecast, By Technology, 2015(H)-2031(F)
Table 53: East Asia Intelligent Packaging Market Volume (Units) Analysis and Forecast, By Level of Packaging, 2015(H)-2031(F)
Table 54: East Asia Intelligent Packaging Market Value (US$ Mn) Analysis and Forecast, By Level of Packaging, 2015(H)-2031(F)
Table 55: East Asia Intelligent Packaging Market Volume (Units) Analysis and Forecast, By Application, 2015(H)-2031(F)
Table 56: East Asia Intelligent Packaging Market Value (US$ Mn) Analysis and Forecast, By Application, 2015(H)-2031(F)
Table 57: East Asia Intelligent Packaging Market Volume (Units) Analysis and Forecast, By End Use, 2015(H)-2031(F)
Table 58: East Asia Intelligent Packaging Market Value (US$ Mn) Analysis and Forecast, By End Use, 2015(H)-2031(F)
Table 59: East Asia Intelligent Packaging Market Volume (Units) Analysis and Forecast, By Country, 2015(H)-2031(F)
Table 60: East Asia Intelligent Packaging Market Value (US$ Mn) Analysis and Forecast, By Country, 2015(H)-2031(F)
Table 61: Oceania Intelligent Packaging Market Volume (Units) Analysis and Forecast, By Technology, 2015(H)-2031(F)
Table 62: Oceania Intelligent Packaging Market Value (US$ Mn) Analysis and Forecast, By Technology, 2015(H)-2031(F)
Table 63: Oceania Intelligent Packaging Market Volume (Units) Analysis and Forecast, By Level of Packaging, 2015(H)-2031(F)
Table 64: Oceania Intelligent Packaging Market Value (US$ Mn) Analysis and Forecast, By Level of Packaging, 2015(H)-2031(F)
Table 65: Oceania Intelligent Packaging Market Volume (Units) Analysis and Forecast, By Application, 2015(H)-2031(F)
Table 66: Oceania Intelligent Packaging Market Value (US$ Mn) Analysis and Forecast, By Application, 2015(H)-2031(F)
Table 67: Oceania Intelligent Packaging Market Volume (Units) Analysis and Forecast, By End Use, 2015(H)-2031(F)
Table 68: Oceania Intelligent Packaging Market Value (US$ Mn) Analysis and Forecast, By End Use, 2015(H)-2031(F)
Table 69: Oceania Intelligent Packaging Market Volume (Units) Analysis and Forecast, By Country, 2015(H)-2031(F)
Table 70: Oceania Intelligent Packaging Market Value (US$ Mn) Analysis and Forecast, By Country, 2015(H)-2031(F)
Table 71: MEA Intelligent Packaging Market Volume (Units) Analysis and Forecast, By Technology, 2015(H)-2031(F)
Table 72: MEA Intelligent Packaging Market Value (US$ Mn) Analysis and Forecast, By Technology, 2015(H)-2031(F)
Table 73: MEA Intelligent Packaging Market Volume (Units) Analysis and Forecast, By Level of Packaging, 2015(H)-2031(F)
Table 74: MEA Intelligent Packaging Market Value (US$ Mn) Analysis and Forecast, By Level of Packaging, 2015(H)-2031(F)
Table 75: MEA Intelligent Packaging Market Volume (Units) Analysis and Forecast, By Application, 2015(H)-2031(F)
Table 76: MEA Intelligent Packaging Market Value (US$ Mn) Analysis and Forecast, By Application, 2015(H)-2031(F)
Table 77: MEA Intelligent Packaging Market Volume (Units) Analysis and Forecast, By End Use, 2015(H)-2031(F)
Table 78: MEA Intelligent Packaging Market Value (US$ Mn) Analysis and Forecast, By End Use, 2015(H)-2031(F)
Table 79: MEA Intelligent Packaging Market Volume (Units) Analysis and Forecast, By Country, 2015(H)-2031(F)
Table 80: MEA Intelligent Packaging Market Value (US$ Mn) Analysis and Forecast, By Country, 2015(H)-2031(F)
Find your sweet spots for generating winning opportunities in this market.
Talk to AnalystList of Charts
Figure 01: Global Intelligent Packaging Market Value Share Analysis, By Technology, 2015(H) & 2031(F)
Figure 02: Global Intelligent Packaging Market Y-o-Y Analysis, By Technology, 2019(H)-2031(F)
Figure 03: Global Intelligent Packaging Market Attractiveness Analysis, By Technology, 2021(E)-2031(F)
Figure 04: Global Intelligent Packaging Market Value Share Analysis, By Level of Packaging, 2015(H) & 2031(F)
Figure 05: Global Intelligent Packaging Market Y-o-Y Analysis, By Level of Packaging, 2019(H)-2031(F)
Figure 06: Global Intelligent Packaging Market Attractiveness Analysis, By Level of Packaging, 2021(E)-2031(F)
Figure 07: Global Intelligent Packaging Market Value Share Analysis, By Application, 2015(H) & 2031(F)
Figure 08: Global Intelligent Packaging Market Y-o-Y Analysis, By Application, 2019(H)-2031(F)
Figure 09: Global Intelligent Packaging Market Attractiveness Analysis, By Application, 2021(E)-2031(F)
Figure 10: Global Intelligent Packaging Market Value Share Analysis, By End Use, 2015(H) & 2031(F)
Figure 11: Global Intelligent Packaging Market Y-o-Y Analysis, By End Use, 2019(H)-2031(F)
Figure 12: Global Intelligent Packaging Market Attractiveness Analysis, By End Use, 2021(E)-2031(F)
Figure 13: Global Intelligent Packaging Market Value Share Analysis, By Region, 2015(H) & 2031(F)
Figure 14: Global Intelligent Packaging Market Y-o-Y Analysis, By Region, 2019(H)-2031(F)
Figure 15: Global Intelligent Packaging Market Attractiveness Analysis, By Region, 2021(E)-2031(F)
Figure 16: North America Intelligent Packaging Market Value Share Analysis, By Technology, 2015(H) & 2031(F)
Figure 17: North America Intelligent Packaging Market Y-o-Y Analysis, By Level of Packaging, 2019(H)-2031(F)
Figure 18: North America Intelligent Packaging Market Attractiveness Analysis, By Application, 2021(E)-2031(F)
Figure 19: North America Intelligent Packaging Market Y-o-Y Analysis, By End-Use, 2019(H)-2031(F)
Figure 20: North America Intelligent Packaging Market Value Share Analysis, By Country, 2015(H) & 2031(F)
Figure 21: Latin America Intelligent Packaging Market Value Share Analysis, By Technology, 2015(H) & 2031(F)
Figure 22: Latin America Intelligent Packaging Market Y-o-Y Analysis, By Level of Packaging, 2019(H)-2031(F)
Figure 23: Latin America Intelligent Packaging Market Attractiveness Analysis, By Application, 2021(E)-2031(F)
Figure 24: Latin America Intelligent Packaging Market Y-o-Y Analysis, By End-Use, 2019(H)-2031(F)
Figure 25: Latin America Intelligent Packaging Market Value Share Analysis, By Country, 2015(H) & 2031(F)
Figure 26: Europe Intelligent Packaging Market Value Share Analysis, By Technology, 2015(H) & 2031(F)
Figure 27: Europe Intelligent Packaging Market Y-o-Y Analysis, By Level of Packaging, 2019(H)-2031(F)
Figure 28: Europe Intelligent Packaging Market Attractiveness Analysis, By Application, 2021(E)-2031(F)
Figure 29: Europe Intelligent Packaging Market Y-o-Y Analysis, By End-Use, 2019(H)-2031(F)
Figure 30: Europe Intelligent Packaging Market Value Share Analysis, By Country, 2015(H) & 2031(F)
Figure 31: South Asia Intelligent Packaging Market Value Share Analysis, By Technology, 2015(H) & 2031(F)
Figure 32: South Asia Intelligent Packaging Market Y-o-Y Analysis, By Level of Packaging, 2019(H)-2031(F)
Figure 33: South Asia Intelligent Packaging Market Attractiveness Analysis, By Application, 2021(E)-2031(F)
Figure 34: South Asia Intelligent Packaging Market Y-o-Y Analysis, By End-Use, 2019(H)-2031(F)
Figure 35: South Asia Intelligent Packaging Market Value Share Analysis, By Country, 2015(H) & 2031(F)
Figure 36: East Asia Intelligent Packaging Market Value Share Analysis, By Technology, 2015(H) & 2031(F)
Figure 37: East Asia Intelligent Packaging Market Y-o-Y Analysis, By Level of Packaging, 2019(H)-2031(F)
Figure 38: East Asia Intelligent Packaging Market Attractiveness Analysis, By Application, 2021(E)-2031(F)
Figure 39: East Asia Intelligent Packaging Market Y-o-Y Analysis, By End-Use, 2019(H)-2031(F)
Figure 40: East Asia Intelligent Packaging Market Value Share Analysis, By Country, 2015(H) & 2031(F)
Figure 41: Oceania Intelligent Packaging Market Value Share Analysis, By Technology, 2015(H) & 2031(F)
Figure 42: Oceania Intelligent Packaging Market Y-o-Y Analysis, By Level of Packaging, 2019(H)-2031(F)
Figure 43: Oceania Intelligent Packaging Market Attractiveness Analysis, By Application, 2021(E)-2031(F)
Figure 44: Oceania Intelligent Packaging Market Y-o-Y Analysis, By End-Use, 2019(H)-2031(F)
Figure 45: Oceania Intelligent Packaging Market Value Share Analysis, By Country, 2015(H) & 2031(F)
Figure 46: MEA Intelligent Packaging Market Value Share Analysis, By Technology, 2015(H) & 2031(F)
Figure 47: MEA Intelligent Packaging Market Y-o-Y Analysis, By Level of Packaging, 2019(H)-2031(F)
Figure 48: MEA Intelligent Packaging Market Attractiveness Analysis, By Application, 2021(E)-2031(F)
Figure 49: MEA Intelligent Packaging Market Y-o-Y Analysis, By End-Use, 2019(H)-2031(F)
Figure 50: MEA Intelligent Packaging Market Value Share Analysis, By Country, 2015(H) & 2031(F)
Figure 51: U.S. Intelligent Packaging Market Value Share Analysis, By Technology, 2021(E) & 2031(F)
Figure 52: U.S. Intelligent Packaging Market Value Share Analysis, By Level of Packaging, 2021(E) & 2031(F)
Figure 53: U.S. Intelligent Packaging Market Value Share Analysis, By Application, 2021(E) & 2031(F)
Figure 54: U.S. Intelligent Packaging Market Value Share Analysis, By End-Use, 2021(E) & 2031(F)
Figure 55: Canada Intelligent Packaging Market Value Share Analysis, By Technology, 2021(E) & 2031(F)
Figure 56: Canada Intelligent Packaging Market Value Share Analysis, By Level of Packaging, 2021(E) & 2031(F)
Figure 57: Canada Intelligent Packaging Market Value Share Analysis, By Application, 2021(E) & 2031(F)
Figure 58: Canada Intelligent Packaging Market Value Share Analysis, By End-Use, 2021(E) & 2031(F)
Figure 59: Brazil Intelligent Packaging Market Value Share Analysis, By Technology, 2021(E) & 2031(F)
Figure 60: Brazil Intelligent Packaging Market Value Share Analysis, By Level of Packaging, 2021(E) & 2031(F)
Figure 61: Brazil Intelligent Packaging Market Value Share Analysis, By Application, 2021(E) & 2031(F)
Figure 62: Brazil Intelligent Packaging Market Value Share Analysis, By End-Use, 2021(E) & 2031(F)
Figure 63: Mexico Intelligent Packaging Market Value Share Analysis, By Technology, 2021(E) & 2031(F)
Figure 64: Mexico Intelligent Packaging Market Value Share Analysis, By Level of Packaging, 2021(E) & 2031(F)
Figure 65: Mexico Intelligent Packaging Market Value Share Analysis, By Application, 2021(E) & 2031(F)
Figure 66: Mexico Intelligent Packaging Market Value Share Analysis, By End-Use, 2021(E) & 2031(F)
Figure 67: Germany Intelligent Packaging Market Value Share Analysis, By Technology, 2021(E) & 2031(F)
Figure 68: Germany Intelligent Packaging Market Value Share Analysis, By Level of Packaging, 2021(E) & 2031(F)
Figure 69: Germany Intelligent Packaging Market Value Share Analysis, By Application, 2021(E) & 2031(F)
Figure 70: Germany Intelligent Packaging Market Value Share Analysis, By End-Use, 2021(E) & 2031(F)
Figure 71: Italy Intelligent Packaging Market Value Share Analysis, By Technology, 2021(E) & 2031(F)
Figure 72: Italy Intelligent Packaging Market Value Share Analysis, By Level of Packaging, 2021(E) & 2031(F)
Figure 73: Italy Intelligent Packaging Market Value Share Analysis, By Application, 2021(E) & 2031(F)
Figure 74: Italy Intelligent Packaging Market Value Share Analysis, By End-Use, 2021(E) & 2031(F)
Figure 75: France Intelligent Packaging Market Value Share Analysis, By Technology, 2021(E) & 2031(F)
Figure 76: France Intelligent Packaging Market Value Share Analysis, By Level of Packaging, 2021(E) & 2031(F)
Figure 77: France Intelligent Packaging Market Value Share Analysis, By Application, 2021(E) & 2031(F)
Figure 78: France Intelligent Packaging Market Value Share Analysis, By End-Use, 2021(E) & 2031(F)
Figure 79: U.K. Intelligent Packaging Market Value Share Analysis, By Technology, 2021(E) & 2031(F)
Figure 80: U.K. Intelligent Packaging Market Value Share Analysis, By Level of Packaging, 2021(E) & 2031(F)
Figure 81: U.K. Intelligent Packaging Market Value Share Analysis, By Application, 2021(E) & 2031(F)
Figure 82: U.K. Intelligent Packaging Market Value Share Analysis, By End-Use, 2021(E) & 2031(F)
Figure 83: Spain Intelligent Packaging Market Value Share Analysis, By Technology, 2021(E) & 2031(F)
Figure 84: Spain Intelligent Packaging Market Value Share Analysis, By Level of Packaging, 2021(E) & 2031(F)
Figure 85: Spain Intelligent Packaging Market Value Share Analysis, By Application, 2021(E) & 2031(F)
Figure 86: Spain Intelligent Packaging Market Value Share Analysis, By End-Use, 2021(E) & 2031(F)
Figure 87: Russia Intelligent Packaging Market Value Share Analysis, By Technology, 2021(E) & 2031(F)
Figure 88: Russia Intelligent Packaging Market Value Share Analysis, By Level of Packaging, 2021(E) & 2031(F)
Figure 89: Russia Intelligent Packaging Market Value Share Analysis, By Application, 2021(E) & 2031(F)
Figure 90: Russia Intelligent Packaging Market Value Share Analysis, By End-Use, 2021(E) & 2031(F)
Figure 91: GCC Countries Intelligent Packaging Market Value Share Analysis, By Technology, 2021(E) & 2031(F)
Figure 92: GCC Countries Intelligent Packaging Market Value Share Analysis, By Level of Packaging, 2021(E) & 2031(F)
Figure 93: GCC Countries Intelligent Packaging Market Value Share Analysis, By Application, 2021(E) & 2031(F)
Figure 94: GCC Countries Intelligent Packaging Market Value Share Analysis, By End-Use, 2021(E) & 2031(F)
Figure 95: Japan Intelligent Packaging Market Value Share Analysis, By Technology, 2021(E) & 2031(F)
Figure 96: Japan Intelligent Packaging Market Value Share Analysis, By Level of Packaging, 2021(E) & 2031(F)
Figure 97: Japan Intelligent Packaging Market Value Share Analysis, By Application, 2021(E) & 2031(F)
Figure 98: Japan Intelligent Packaging Market Value Share Analysis, By End-Use, 2021(E) & 2031(F)
Figure 99: India Intelligent Packaging Market Value Share Analysis, By Technology, 2021(E) & 2031(F)
Figure 100: India Intelligent Packaging Market Value Share Analysis, By Level of Packaging, 2021(E) & 2031(F)
Figure 101: India Intelligent Packaging Market Value Share Analysis, By Application, 2021(E) & 2031(F)
Figure 102: India Intelligent Packaging Market Value Share Analysis, By End-Use, 2021(E) & 2031(F)
Figure 103: China Intelligent Packaging Market Value Share Analysis, By Technology, 2021(E) & 2031(F)
Figure 104: China Intelligent Packaging Market Value Share Analysis, By Level of Packaging, 2021(E) & 2031(F)
Figure 105: China Intelligent Packaging Market Value Share Analysis, By Application, 2021(E) & 2031(F)
Figure 106: China Intelligent Packaging Market Value Share Analysis, By End-Use, 2021(E) & 2031(F)
Figure 103: Australia Intelligent Packaging Market Value Share Analysis, By Technology, 2021(E) & 2031(F)
Figure 104: Australia Intelligent Packaging Market Value Share Analysis, By Level of Packaging, 2021(E) & 2031(F)
Figure 105: Australia Intelligent Packaging Market Value Share Analysis, By Application, 2021(E) & 2031(F)
Figure 106: Australia Intelligent Packaging Market Value Share Analysis, By End-Use, 2021(E) & 2031(F)
Need specific information?
Request CustomizationExplore Packaging Insights
View Reports