Intelligent Completion Market Outlook from 2024 to 2034

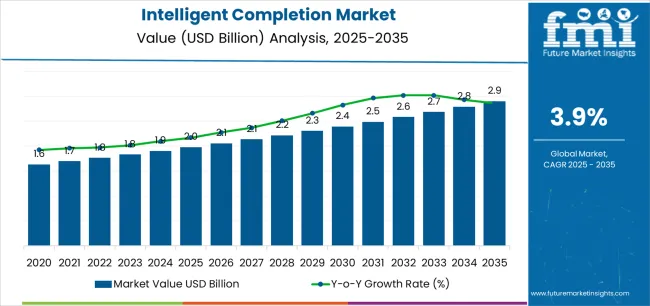
The intelligent completion market is projected to be valued at US$ 1.9 billion by 2024 and increase to US$ 2.8 billion by 2034. The intelligent completions are predicted to rise at a sluggish CAGR of 4.1% from 2024 to 2034.

Attributes Key Insights
Estimated Market Size in 2024 US$ 1.9 billion
Projected Market Value in 2034 US$ 2.8 billion
Value-based CAGR from 2024 to 2034 4.1%

Don't pay for what you don't need

Customize your report by selecting specific countries or regions and save 30%!

Key Trends and Highlights

  • Increasing adoption of intelligent completion systems in oil and gas wells due to their ability to enhance reservoir productivity and optimize production operations.
  • Growing demand for real-time monitoring and control capabilities in well completions to improve operational efficiency and maximize hydrocarbon recovery.
  • Advancements in sensor technology, data analytics, and automation driving innovation in intelligent completion systems, enabling operators to gather and analyze reservoir data more effectively.

2019 to 2023 Historical Analysis vs. 2024 to 2034 Market Forecast Projections

From 2019 to 2023, the intelligent completion market rose with a historical CAGR of 5.6%. This period witnessed increasing adoption of intelligent completion systems in oil and gas wells, driven by the industrial focus on enhancing reservoir productivity and optimizing production operations.

Advancements in sensor technology and data analytics played a significant role in fueling this growth, enabling operators to gather and analyze reservoir data more effectively, leading to improved operational efficiency and hydrocarbon recovery.

From 2024 to 2034, the market is projected to continue its expansion, albeit at a slightly slower pace, with a forecasted CAGR of 4.1%. This phase is expected to be characterized by sustained demand for real-time monitoring and control capabilities in well completions, alongside increasing investments in research and development to address challenges related to reliability and interoperability.

Integrating artificial intelligence and machine learning algorithms into intelligent completion systems is anticipated to drive innovation further, enabling predictive analytics and autonomous operation, thus enhancing reservoir management and production optimization capabilities in the coming years.

Historical CAGR 2019 to 2023 5.6%
Forecast CAGR 2024 to 2034 4.1%
Sudip Saha
Sudip Saha

Principal Consultant

Talk to Analyst

Find your sweet spots for generating winning opportunities in this market.

Intelligent Completion Market Drivers

  • Expansion of intelligent completion applications to include unconventional resources like shale gas and tight oil reservoirs.
  • Rising investments in research and development aimed at improving the reliability and interoperability of intelligent completion systems.
  • Regulatory support and industry standards promoting the adoption of intelligent completion technologies.

Intelligent Completion Market Challenges

  • Need for skilled personnel to operate and maintain intelligent completion systems effectively.
  • Environmental and regulatory concerns surrounding the deployment of intelligent completion technologies.
  • Potential cybersecurity risks associated with integrating digital technologies into oil and gas operations.

Get the data you need at a Fraction of the cost

Personalize your report by choosing insights you need
and save 40%!

Comparative View of Adjacent Markets

Future Market Insights has compared three markets, namely the intelligent transport system market and the intelligent lighting control market are below. As more people move into urban areas, there is a growing strain on existing transportation infrastructure.

With rising energy costs and growing environmental awareness, businesses and municipalities are seeking ways to reduce energy consumption.

Intelligent Completion Market:

Attributes Intelligent Completion Market
CAGR from 2024 to 2034 4.1%
Key Trend A key trend in the intelligent transport system market is the widespread adoption of connected vehicle technology.
Growth Factor The increasing focus on operational efficiency is a significant growth factor driving the intelligent completion market.

Intelligent Transport Systems (ITS) Market:

Attributes Intelligent Transport Systems (ITS) Market
CAGR from 2022 to 2032 11%
Key Trend A key trend in the intelligent transport system market is the widespread adoption of connected vehicle technology.
Growth Factor Urbanization and the resulting increase in traffic congestion are significant growth factors for the intelligent transport system market.

Intelligent Lighting Control Market:

Attributes Intelligent Lighting Control Market
CAGR from 2022 to 2032 16.5%
Key Trends One key trend in the intelligent lighting control market is the emergence of smart cities.
Growth Factor Energy efficiency regulations play a significant role in driving growth in the intelligent lighting control market.

Country-wise Analysis

The provided table illustrates the top five countries in terms of revenue, with the United Kingdom holding a prominent position in the market.

The United Kingdom leads the intelligent completion market with advanced expertise in offshore drilling technologies, particularly in the North Sea. Leveraging its extensive experience in oil and gas exploration, the United Kingdom develops and deploys cutting-edge intelligent completion systems to maximize hydrocarbon recovery from offshore reservoirs.

Stringent regulatory standards and a strong focus on safety and environmental sustainability contribute to the leadership position in the global market.

Countries Forecast CAGRs from 2024 to 2034
The United States 4.4%
The United Kingdom 5.5%
Japan 5.3%
China 4.7%
South Korea 2%

Oil and Gas Industry Utilization in the United States

In the United States, the market is significantly utilized within the oil and gas industry. With vast reserves and substantial energy production from these resources, there is a strong demand for technologies like Intelligent Completion systems.

These systems are deployed across various states, such as Texas, Oklahoma, and North Dakota, to optimize production operations, enhance reservoir productivity, and improve operational efficiency.

North Sea Offshore Fields Surges the United Kingdom Market

The market finds significant application in the North Sea offshore oil and gas fields. As one of the largest oil producers in Europe, the United Kingdom relies heavily on technologies like Intelligent Completion systems to maximize hydrocarbon recovery from offshore reservoirs.

The systems are crucial in monitoring and controlling well completions in harsh offshore environments, ensuring safe and efficient production operations while meeting stringent regulatory standards.
Boom of Technology Development and Innovation in Japan

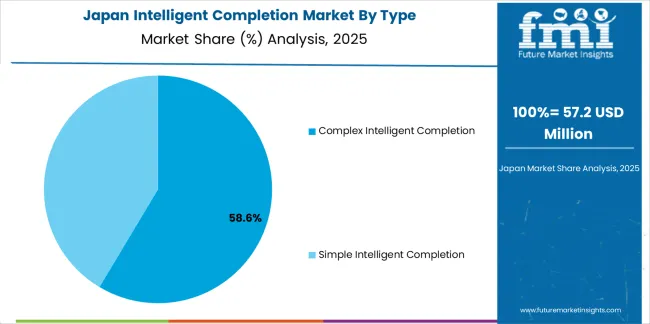
The market is notable in technology development and innovation. The companies are researching and developing advanced completion technologies, including intelligent completion systems. These technologies are utilized domestically and exported globally, contributing to position in the global market.
Oil and Gas Exploration and Production Boosts China Market

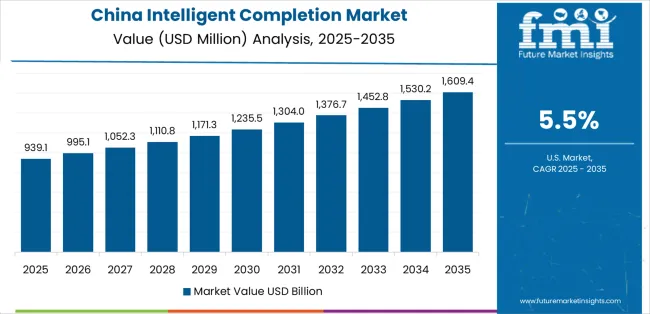
Extensive oil and gas exploration and production activities primarily drive the market in China. As one of the largest energy consumers globally, China relies on domestic oil and gas production to meet its demand.

Intelligent completion systems are widely deployed in oil and gas fields to enhance reservoir management, production efficiency, and hydrocarbon recovery from conventional and unconventional reservoirs.
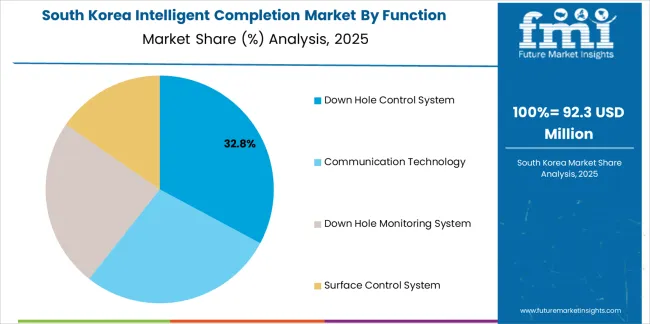
Investments in Overseas Projects Drive the Market Growth in South Korea

The utilization of Intelligent Completion technology predominantly centers around its investments in overseas oil and gas projects. Despite limited domestic reserves, the companies actively participate in exploration and production activities worldwide.

Intelligent completion systems are employed in these international projects to improve operational efficiency, monitor reservoir performance, and maximize production yields, contributing to the presence in the global energy market.Top of Form

Category-wise Insights

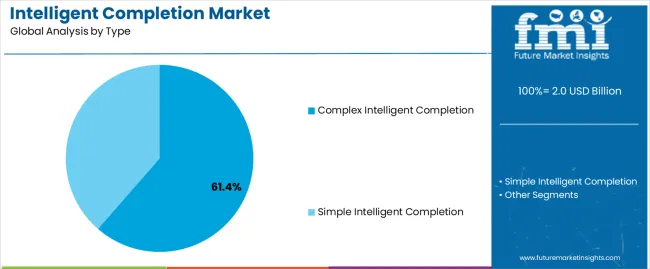
The below section shows the leading segment. Based on type, the complex intelligent completion segment is registered at a CAGR of 3.9% by 2034. Based on the function, the communication technology segment is anticipated to expand at a CAGR of 3.7% by 2034.

Complex intelligent completion systems are designed to maximize hydrocarbon recovery and improve reservoir performance, addressing the industrial need for enhanced productivity and efficiency in oil and gas production.

The primary driver for the adoption of communication technology in intelligent completion systems is the demand for real-time monitoring and control capabilities.

Category CAGR from 2024 to 2034
Complex Intelligent Completion 3.9%
Communication Technology 3.7%

Complex Intelligent Completion to Hold a Significant Share in the Market

The complex intelligent completion segment, categorized by its intricate design and advanced features, is projected to rise at a CAGR of 3.9% by 2034. This segment encompasses sophisticated completion systems tailored for challenging reservoir conditions, such as high-pressure, high-temperature environments or complex geological formations.

Complex intelligent completion solutions integrate components, including downhole sensors, control valves, and monitoring systems, to optimize reservoir performance and enhance production efficiency.

With increasing demand for improved reservoir management and production optimization capabilities, particularly in mature oil and gas fields, adopting complex intelligent completion systems is expected to witness steady growth over the forecast period.

Communication Technology to Hold a Dominant Share in the Market

The communication technology segment within the intelligent completion market is poised to expand at a CAGR of 3.7% by 2034. This segment focuses on developing and integrating communication technologies within completion systems, enabling real-time data transmission and remote monitoring capabilities.

Communication technology facilitates seamless communication between downhole sensors, surface equipment, and control centers, allowing operators to monitor reservoir conditions and control production operations remotely. With the growing emphasis on digitalization and connectivity in the oil and gas industry, the demand for advanced communication technologies in intelligent completion systems is expected to rise, driving the growth of this segment in the coming years.

Competitive Landscape

The competitive landscape of the intelligent completion market is characterized by a diverse range of players, including major oilfield service providers, technology companies, and specialized completion solution providers. Key players compete on technological innovation, product reliability, and customer service to gain market share.

Partnerships and collaborations between companies are common, facilitating the development of integrated solutions that meet the evolving needs of oil and gas operators. With increasing demand for enhanced reservoir management and production optimization capabilities, competition in the market is expected to intensify, driving further innovation and market growth.

Some of the key developments

  • In April 2022, Halliburton unveiled StrataSta, a novel deep azimuthal resistivity service. It offers multilayer visualization to optimize well contact with reservoirs and enhance real-time reserve assessment. The StrataStar service expands Halliburton's iStar intelligent drilling and logging platform.
  • In February 2023, Baker Hughes introduced new software to enhance efficiency and performance while curbing emissions from well-completion processes.

Key Coverage of Intelligent Completion Market Report

  • Adjacent Study on Intelligent Completion Market
  • Intelligent Completion Market Size, Current Insights, and Demographic Trends
  • Global Intelligent Well Completion Market
  • Global Intelligent Completion Market Growth Opportunities
  • Sales Forecast for India Intelligent Completion Market

Report Scope

Attributes Details
Estimated Market Size in 2024 US$ 1.9 billion
Projected Market Valuation in 2034 US$ 2.8 billion
Value-based CAGR 2024 to 2034 4.1%
Forecast Period 2024 to 2034
Historical Data Available for 2019 to 2023
Market Analysis Value in US$ billion
Key Regions Covered
  • North America
  • Latin America
  • Western Europe
  • Eastern Europe
  • South Asia and Pacific
  • East Asia
  • Middle East and Africa
Key Market Segments Covered
  • Type
  • Function
  • Application
  • Components
  • Region
Key Countries Profiled
  • The United States
  • Canada
  • Brazil
  • Mexico
  • Germany
  • The United Kingdom
  • France
  • Spain
  • Italy
  • Russia
  • Poland
  • Czech Republic
  • Romania
  • India
  • Bangladesh
  • Australia
  • New Zealand
  • China
  • Japan
  • South Korea
  • GCC countries
  • South Africa
  • Israel
Key Companies Profiled
  • Omega Well Intervention Ltd.
  • Packers Plus Energy Services
  • OURO Negro
  • Halliburton
  • and National Oilwell Varco
  • Baker
  • Hughes
  • Schlumberger
  • Weatherford
  • Praxis
  • Cisco
  • Nigeria

Intelligent Completion Market - Key Segments

By Type:

  • Complex Intelligent Completion
  • Simple Intelligent Completion

By Function:

  • Communication Technology
  • Down Hole Control System
  • Down Hole Monitoring System
  • Surface Control System

By Application:

  • Offshore
  • Onshore

By Components:

  • Software
  • Hardware

By Region:

  • North America
  • Latin America
  • Western Europe
  • Eastern Europe
  • South Asia and Pacific
  • East Asia
  • Middle East and Africa

Frequently Asked Questions

What is the expected worth of the intelligent completion market in 2024?

As of 2024, the market for intelligent completion is expected to be valued at US$ 1.9 billion.

What is the anticipated market value for the intelligent completion in 2034?

By 2034, the market value of the intelligent completion is expected to reach US$ 2.8 billion.

What is the projected forecast CAGR for the intelligent completion market from 2024 to 2034?

From 2024 to 2034, the intelligent completion market is expected to flourish at a CAGR of 4.1%

Based on type, which segment dominates the intelligent completion market?

The complex intelligent completion segment is registered at a CAGR of 3.9% by 2034.

Which country is likely to dominate the intelligent completion market?

The United Kingdom is likely the top-performing market, with a CAGR of 5.5%.

Table of Content
1. Executive Summary

    1.1. Global Market Outlook

    1.2. Demand-side Trends

    1.3. Supply-side Trends

    1.4. Technology Roadmap Analysis

    1.5. Analysis and Recommendations

2. Market Overview

    2.1. Market Coverage / Taxonomy

    2.2. Market Definition / Scope / Limitations

3. Market Background

    3.1. Market Dynamics

        3.1.1. Drivers

        3.1.2. Restraints

        3.1.3. Opportunity

        3.1.4. Trends

    3.2. Scenario Forecast

        3.2.1. Demand in Optimistic Scenario

        3.2.2. Demand in Likely Scenario

        3.2.3. Demand in Conservative Scenario

    3.3. Opportunity Map Analysis

    3.4. Investment Feasibility Matrix

    3.5. PESTLE and Porter’s Analysis

    3.6. Regulatory Landscape

        3.6.1. By Key Regions

        3.6.2. By Key Countries

    3.7. Regional Parent Market Outlook

4. Global Market Analysis 2019 to 2023 and Forecast, 2024 to 2034

    4.1. Historical Market Size Value (US$ Million) Analysis, 2019 to 2023

    4.2. Current and Future Market Size Value (US$ Million) Projections, 2024 to 2034

        4.2.1. Y-o-Y Growth Trend Analysis

        4.2.2. Absolute $ Opportunity Analysis

5. Global Market Analysis 2019 to 2023 and Forecast 2024 to 2034, By Type

    5.1. Introduction / Key Findings

    5.2. Historical Market Size Value (US$ Million) Analysis By Type, 2019 to 2023

    5.3. Current and Future Market Size Value (US$ Million) Analysis and Forecast By Type, 2024 to 2034

        5.3.1. Complex Intelligent Completion

        5.3.2. Simple Intelligent Completion

    5.4. Y-o-Y Growth Trend Analysis By Type, 2019 to 2023

    5.5. Absolute $ Opportunity Analysis By Type, 2024 to 2034

6. Global Market Analysis 2019 to 2023 and Forecast 2024 to 2034, By Function

    6.1. Introduction / Key Findings

    6.2. Historical Market Size Value (US$ Million) Analysis By Function, 2019 to 2023

    6.3. Current and Future Market Size Value (US$ Million) Analysis and Forecast By Function, 2024 to 2034

        6.3.1. Communication Technology

        6.3.2. Down Hole Control System

        6.3.3. Down Hole Monitoring System

        6.3.4. Surface Control System

    6.4. Y-o-Y Growth Trend Analysis By Function, 2019 to 2023

    6.5. Absolute $ Opportunity Analysis By Function, 2024 to 2034

7. Global Market Analysis 2019 to 2023 and Forecast 2024 to 2034, By Application 

    7.1. Introduction / Key Findings

    7.2. Historical Market Size Value (US$ Million) Analysis By Application, 2019 to 2023

    7.3. Current and Future Market Size Value (US$ Million) Analysis and Forecast By Application, 2024 to 2034

        7.3.1. Offshore

        7.3.2. Onshore

    7.4. Y-o-Y Growth Trend Analysis By Application, 2019 to 2023

    7.5. Absolute $ Opportunity Analysis By Application, 2024 to 2034

8. Global Market Analysis 2019 to 2023 and Forecast 2024 to 2034, By Components

    8.1. Introduction / Key Findings

    8.2. Historical Market Size Value (US$ Million) Analysis By Components, 2019 to 2023

    8.3. Current and Future Market Size Value (US$ Million) Analysis and Forecast By Components, 2024 to 2034

        8.3.1. Software

        8.3.2. Hardware

    8.4. Y-o-Y Growth Trend Analysis By Components, 2019 to 2023

    8.5. Absolute $ Opportunity Analysis By Components, 2024 to 2034

9. Global Market Analysis 2019 to 2023 and Forecast 2024 to 2034, By Region

    9.1. Introduction

    9.2. Historical Market Size Value (US$ Million) Analysis By Region, 2019 to 2023

    9.3. Current Market Size Value (US$ Million) Analysis and Forecast By Region, 2024 to 2034

        9.3.1. North America

        9.3.2. Latin America

        9.3.3. Western Europe

        9.3.4. Eastern Europe

        9.3.5. South Asia and Pacific

        9.3.6. East Asia

        9.3.7. Middle East and Africa

    9.4. Market Attractiveness Analysis By Region

10. North America Market Analysis 2019 to 2023 and Forecast 2024 to 2034, By Country

    10.1. Historical Market Size Value (US$ Million) Trend Analysis By Market Taxonomy, 2019 to 2023

    10.2. Market Size Value (US$ Million) Forecast By Market Taxonomy, 2024 to 2034

        10.2.1. By Country

            10.2.1.1. USA

            10.2.1.2. Canada

        10.2.2. By Type

        10.2.3. By Function

        10.2.4. By Application

        10.2.5. By Components

    10.3. Market Attractiveness Analysis

        10.3.1. By Country

        10.3.2. By Type

        10.3.3. By Function

        10.3.4. By Application

        10.3.5. By Components

    10.4. Key Takeaways

11. Latin America Market Analysis 2019 to 2023 and Forecast 2024 to 2034, By Country

    11.1. Historical Market Size Value (US$ Million) Trend Analysis By Market Taxonomy, 2019 to 2023

    11.2. Market Size Value (US$ Million) Forecast By Market Taxonomy, 2024 to 2034

        11.2.1. By Country

            11.2.1.1. Brazil

            11.2.1.2. Mexico

            11.2.1.3. Rest of Latin America

        11.2.2. By Type

        11.2.3. By Function

        11.2.4. By Application

        11.2.5. By Components

    11.3. Market Attractiveness Analysis

        11.3.1. By Country

        11.3.2. By Type

        11.3.3. By Function

        11.3.4. By Application

        11.3.5. By Components

    11.4. Key Takeaways

12. Western Europe Market Analysis 2019 to 2023 and Forecast 2024 to 2034, By Country

    12.1. Historical Market Size Value (US$ Million) Trend Analysis By Market Taxonomy, 2019 to 2023

    12.2. Market Size Value (US$ Million) Forecast By Market Taxonomy, 2024 to 2034

        12.2.1. By Country

            12.2.1.1. Germany

            12.2.1.2. UK

            12.2.1.3. France

            12.2.1.4. Spain

            12.2.1.5. Italy

            12.2.1.6. Rest of Western Europe

        12.2.2. By Type

        12.2.3. By Function

        12.2.4. By Application

        12.2.5. By Components

    12.3. Market Attractiveness Analysis

        12.3.1. By Country

        12.3.2. By Type

        12.3.3. By Function

        12.3.4. By Application

        12.3.5. By Components

    12.4. Key Takeaways

13. Eastern Europe Market Analysis 2019 to 2023 and Forecast 2024 to 2034, By Country

    13.1. Historical Market Size Value (US$ Million) Trend Analysis By Market Taxonomy, 2019 to 2023

    13.2. Market Size Value (US$ Million) Forecast By Market Taxonomy, 2024 to 2034

        13.2.1. By Country

            13.2.1.1. Poland

            13.2.1.2. Russia

            13.2.1.3. Czech Republic

            13.2.1.4. Romania

            13.2.1.5. Rest of Eastern Europe

        13.2.2. By Type

        13.2.3. By Function

        13.2.4. By Application

        13.2.5. By Components

    13.3. Market Attractiveness Analysis

        13.3.1. By Country

        13.3.2. By Type

        13.3.3. By Function

        13.3.4. By Application

        13.3.5. By Components

    13.4. Key Takeaways

14. South Asia and Pacific Market Analysis 2019 to 2023 and Forecast 2024 to 2034, By Country

    14.1. Historical Market Size Value (US$ Million) Trend Analysis By Market Taxonomy, 2019 to 2023

    14.2. Market Size Value (US$ Million) Forecast By Market Taxonomy, 2024 to 2034

        14.2.1. By Country

            14.2.1.1. India

            14.2.1.2. Bangladesh

            14.2.1.3. Australia

            14.2.1.4. New Zealand

            14.2.1.5. Rest of South Asia and Pacific

        14.2.2. By Type

        14.2.3. By Function

        14.2.4. By Application

        14.2.5. By Components

    14.3. Market Attractiveness Analysis

        14.3.1. By Country

        14.3.2. By Type

        14.3.3. By Function

        14.3.4. By Application

        14.3.5. By Components

    14.4. Key Takeaways

15. East Asia Market Analysis 2019 to 2023 and Forecast 2024 to 2034, By Country

    15.1. Historical Market Size Value (US$ Million) Trend Analysis By Market Taxonomy, 2019 to 2023

    15.2. Market Size Value (US$ Million) Forecast By Market Taxonomy, 2024 to 2034

        15.2.1. By Country

            15.2.1.1. China

            15.2.1.2. Japan

            15.2.1.3. South Korea

        15.2.2. By Type

        15.2.3. By Function

        15.2.4. By Application

        15.2.5. By Components

    15.3. Market Attractiveness Analysis

        15.3.1. By Country

        15.3.2. By Type

        15.3.3. By Function

        15.3.4. By Application

        15.3.5. By Components

    15.4. Key Takeaways

16. Middle East and Africa Market Analysis 2019 to 2023 and Forecast 2024 to 2034, By Country

    16.1. Historical Market Size Value (US$ Million) Trend Analysis By Market Taxonomy, 2019 to 2023

    16.2. Market Size Value (US$ Million) Forecast By Market Taxonomy, 2024 to 2034

        16.2.1. By Country

            16.2.1.1. GCC Countries

            16.2.1.2. South Africa

            16.2.1.3. Israel

            16.2.1.4. Rest of MEA

        16.2.2. By Type

        16.2.3. By Function

        16.2.4. By Application

        16.2.5. By Components

    16.3. Market Attractiveness Analysis

        16.3.1. By Country

        16.3.2. By Type

        16.3.3. By Function

        16.3.4. By Application

        16.3.5. By Components

    16.4. Key Takeaways

17. Key Countries Market Analysis

    17.1. USA

        17.1.1. Pricing Analysis

        17.1.2. Market Share Analysis, 2023

            17.1.2.1. By Type

            17.1.2.2. By Function

            17.1.2.3. By Application

            17.1.2.4. By Components

    17.2. Canada

        17.2.1. Pricing Analysis

        17.2.2. Market Share Analysis, 2023

            17.2.2.1. By Type

            17.2.2.2. By Function

            17.2.2.3. By Application

            17.2.2.4. By Components

    17.3. Brazil

        17.3.1. Pricing Analysis

        17.3.2. Market Share Analysis, 2023

            17.3.2.1. By Type

            17.3.2.2. By Function

            17.3.2.3. By Application

            17.3.2.4. By Components

    17.4. Mexico

        17.4.1. Pricing Analysis

        17.4.2. Market Share Analysis, 2023

            17.4.2.1. By Type

            17.4.2.2. By Function

            17.4.2.3. By Application

            17.4.2.4. By Components

    17.5. Germany

        17.5.1. Pricing Analysis

        17.5.2. Market Share Analysis, 2023

            17.5.2.1. By Type

            17.5.2.2. By Function

            17.5.2.3. By Application

            17.5.2.4. By Components

    17.6. UK

        17.6.1. Pricing Analysis

        17.6.2. Market Share Analysis, 2023

            17.6.2.1. By Type

            17.6.2.2. By Function

            17.6.2.3. By Application

            17.6.2.4. By Components

    17.7. France

        17.7.1. Pricing Analysis

        17.7.2. Market Share Analysis, 2023

            17.7.2.1. By Type

            17.7.2.2. By Function

            17.7.2.3. By Application

            17.7.2.4. By Components

    17.8. Spain

        17.8.1. Pricing Analysis

        17.8.2. Market Share Analysis, 2023

            17.8.2.1. By Type

            17.8.2.2. By Function

            17.8.2.3. By Application

            17.8.2.4. By Components

    17.9. Italy

        17.9.1. Pricing Analysis

        17.9.2. Market Share Analysis, 2023

            17.9.2.1. By Type

            17.9.2.2. By Function

            17.9.2.3. By Application

            17.9.2.4. By Components

    17.10. Poland

        17.10.1. Pricing Analysis

        17.10.2. Market Share Analysis, 2023

            17.10.2.1. By Type

            17.10.2.2. By Function

            17.10.2.3. By Application

            17.10.2.4. By Components

    17.11. Russia

        17.11.1. Pricing Analysis

        17.11.2. Market Share Analysis, 2023

            17.11.2.1. By Type

            17.11.2.2. By Function

            17.11.2.3. By Application

            17.11.2.4. By Components

    17.12. Czech Republic

        17.12.1. Pricing Analysis

        17.12.2. Market Share Analysis, 2023

            17.12.2.1. By Type

            17.12.2.2. By Function

            17.12.2.3. By Application

            17.12.2.4. By Components

    17.13. Romania

        17.13.1. Pricing Analysis

        17.13.2. Market Share Analysis, 2023

            17.13.2.1. By Type

            17.13.2.2. By Function

            17.13.2.3. By Application

            17.13.2.4. By Components

    17.14. India

        17.14.1. Pricing Analysis

        17.14.2. Market Share Analysis, 2023

            17.14.2.1. By Type

            17.14.2.2. By Function

            17.14.2.3. By Application

            17.14.2.4. By Components

    17.15. Bangladesh

        17.15.1. Pricing Analysis

        17.15.2. Market Share Analysis, 2023

            17.15.2.1. By Type

            17.15.2.2. By Function

            17.15.2.3. By Application

            17.15.2.4. By Components

    17.16. Australia

        17.16.1. Pricing Analysis

        17.16.2. Market Share Analysis, 2023

            17.16.2.1. By Type

            17.16.2.2. By Function

            17.16.2.3. By Application

            17.16.2.4. By Components

    17.17. New Zealand

        17.17.1. Pricing Analysis

        17.17.2. Market Share Analysis, 2023

            17.17.2.1. By Type

            17.17.2.2. By Function

            17.17.2.3. By Application

            17.17.2.4. By Components

    17.18. China

        17.18.1. Pricing Analysis

        17.18.2. Market Share Analysis, 2023

            17.18.2.1. By Type

            17.18.2.2. By Function

            17.18.2.3. By Application

            17.18.2.4. By Components

    17.19. Japan

        17.19.1. Pricing Analysis

        17.19.2. Market Share Analysis, 2023

            17.19.2.1. By Type

            17.19.2.2. By Function

            17.19.2.3. By Application

            17.19.2.4. By Components

    17.20. South Korea

        17.20.1. Pricing Analysis

        17.20.2. Market Share Analysis, 2023

            17.20.2.1. By Type

            17.20.2.2. By Function

            17.20.2.3. By Application

            17.20.2.4. By Components

    17.21. GCC Countries

        17.21.1. Pricing Analysis

        17.21.2. Market Share Analysis, 2023

            17.21.2.1. By Type

            17.21.2.2. By Function

            17.21.2.3. By Application

            17.21.2.4. By Components

    17.22. South Africa

        17.22.1. Pricing Analysis

        17.22.2. Market Share Analysis, 2023

            17.22.2.1. By Type

            17.22.2.2. By Function

            17.22.2.3. By Application

            17.22.2.4. By Components

    17.23. Israel

        17.23.1. Pricing Analysis

        17.23.2. Market Share Analysis, 2023

            17.23.2.1. By Type

            17.23.2.2. By Function

            17.23.2.3. By Application

            17.23.2.4. By Components

18. Market Structure Analysis

    18.1. Competition Dashboard

    18.2. Competition Benchmarking

    18.3. Market Share Analysis of Top Players

        18.3.1. By Regional

        18.3.2. By Type

        18.3.3. By Function

        18.3.4. By Application

        18.3.5. By Components

19. Competition Analysis

    19.1. Competition Deep Dive

        19.1.1. Omega Well Intervention Ltd.

            19.1.1.1. Overview

            19.1.1.2. Product Portfolio

            19.1.1.3. Profitability by Market Segments

            19.1.1.4. Sales Footprint

            19.1.1.5. Strategy Overview

                19.1.1.5.1. Marketing Strategy

        19.1.2. Packers Plus Energy Services

            19.1.2.1. Overview

            19.1.2.2. Product Portfolio

            19.1.2.3. Profitability by Market Segments

            19.1.2.4. Sales Footprint

            19.1.2.5. Strategy Overview

                19.1.2.5.1. Marketing Strategy

        19.1.3. OURO Negro

            19.1.3.1. Overview

            19.1.3.2. Product Portfolio

            19.1.3.3. Profitability by Market Segments

            19.1.3.4. Sales Footprint

            19.1.3.5. Strategy Overview

                19.1.3.5.1. Marketing Strategy

        19.1.4. Halliburton

            19.1.4.1. Overview

            19.1.4.2. Product Portfolio

            19.1.4.3. Profitability by Market Segments

            19.1.4.4. Sales Footprint

            19.1.4.5. Strategy Overview

                19.1.4.5.1. Marketing Strategy

        19.1.5. and National Oilwell Varco

            19.1.5.1. Overview

            19.1.5.2. Product Portfolio

            19.1.5.3. Profitability by Market Segments

            19.1.5.4. Sales Footprint

            19.1.5.5. Strategy Overview

                19.1.5.5.1. Marketing Strategy

        19.1.6. Baker

            19.1.6.1. Overview

            19.1.6.2. Product Portfolio

            19.1.6.3. Profitability by Market Segments

            19.1.6.4. Sales Footprint

            19.1.6.5. Strategy Overview

                19.1.6.5.1. Marketing Strategy

        19.1.7. Hughes

            19.1.7.1. Overview

            19.1.7.2. Product Portfolio

            19.1.7.3. Profitability by Market Segments

            19.1.7.4. Sales Footprint

            19.1.7.5. Strategy Overview

                19.1.7.5.1. Marketing Strategy

        19.1.8. Schlumberger

            19.1.8.1. Overview

            19.1.8.2. Product Portfolio

            19.1.8.3. Profitability by Market Segments

            19.1.8.4. Sales Footprint

            19.1.8.5. Strategy Overview

                19.1.8.5.1. Marketing Strategy

        19.1.9. Weatherford

            19.1.9.1. Overview

            19.1.9.2. Product Portfolio

            19.1.9.3. Profitability by Market Segments

            19.1.9.4. Sales Footprint

            19.1.9.5. Strategy Overview

                19.1.9.5.1. Marketing Strategy

        19.1.10. Praxis

            19.1.10.1. Overview

            19.1.10.2. Product Portfolio

            19.1.10.3. Profitability by Market Segments

            19.1.10.4. Sales Footprint

            19.1.10.5. Strategy Overview

                19.1.10.5.1. Marketing Strategy

        19.1.11. Cisco

            19.1.11.1. Overview

            19.1.11.2. Product Portfolio

            19.1.11.3. Profitability by Market Segments

            19.1.11.4. Sales Footprint

            19.1.11.5. Strategy Overview

                19.1.11.5.1. Marketing Strategy

        19.1.12. Nigeria

            19.1.12.1. Overview

            19.1.12.2. Product Portfolio

            19.1.12.3. Profitability by Market Segments

            19.1.12.4. Sales Footprint

            19.1.12.5. Strategy Overview

                19.1.12.5.1. Marketing Strategy

20. Assumptions & Acronyms Used

21. Research Methodology
Recommendations

Technology

Intelligent Virtual Store Design Solution Market

September 2024

REP-GB-1646

Upcoming

Oil and Gas

Intelligent Pigging Services Market

October 2019

REP-GB-390

180 pages

Explore Technology Insights

View Reports
Future Market Insights

Intelligent Completion Market