The Intelligent Enterprise Data Capture Software Industry Analysis in Japan is estimated to be valued at USD 0.5 billion in 2025 and is projected to reach USD 1.7 billion by 2035, registering a compound annual growth rate (CAGR) of 12.1% over the forecast period.
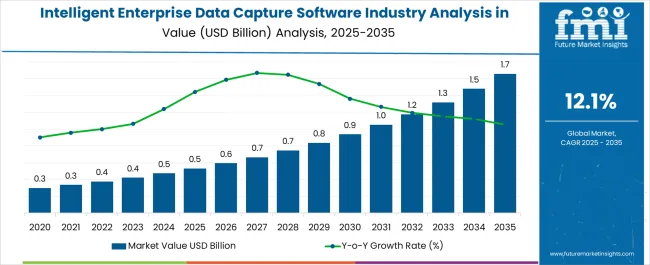
| Metric | Value |
|---|---|
| Intelligent Enterprise Data Capture Software Industry Analysis in Japan Estimated Value in (2025 E) | USD 0.5 billion |
| Intelligent Enterprise Data Capture Software Industry Analysis in Japan Forecast Value in (2035 F) | USD 1.7 billion |
| Forecast CAGR (2025 to 2035) | 12.1% |
The intelligent enterprise data capture software industry in Japan is advancing steadily as organizations prioritize automation, compliance, and operational efficiency in data management. Current dynamics are defined by increasing digitization of workflows, heightened data security requirements, and integration of artificial intelligence for advanced recognition and analytics. Enterprises across sectors are modernizing legacy systems to handle rising data volumes with higher accuracy and reduced manual intervention.
The market outlook is supported by government-led digital transformation initiatives and strong adoption across regulated industries such as finance, healthcare, and manufacturing. Growth rationale is built upon the critical role of data capture solutions in ensuring business continuity, regulatory adherence, and real-time insights.
Demand for scalability and integration with enterprise resource planning and content management systems is reinforcing market adoption As organizations expand their digital strategies, sustained investment in intelligent data capture tools is expected to underpin market growth and strengthen Japan’s positioning as a hub for enterprise automation solutions.
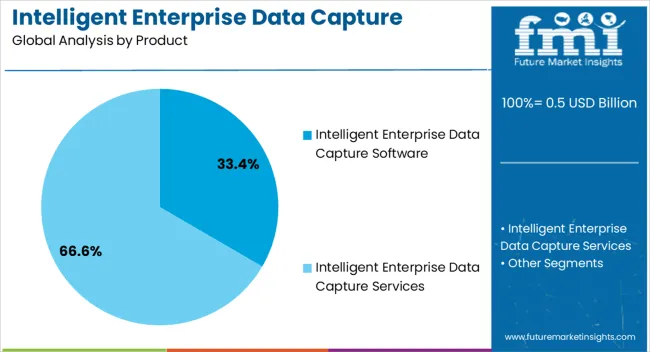
The intelligent enterprise data capture software product segment, holding 33.4% of the product category, has maintained leadership due to its ability to streamline unstructured and structured data processing across multiple enterprise functions. Adoption has been reinforced by the growing need for accuracy, compliance, and efficiency in document handling.
The segment has been driven by integration capabilities with existing enterprise systems and the flexibility to adapt to industry-specific requirements. Enhanced optical character recognition and machine learning algorithms have improved automation performance, reducing manual dependency and error rates.
Market confidence has been strengthened by consistent vendor investments in security features and localization for the Japanese market Continued focus on user-friendly interfaces, interoperability, and compliance with evolving regulations is expected to sustain segment leadership and drive broader penetration across industries.
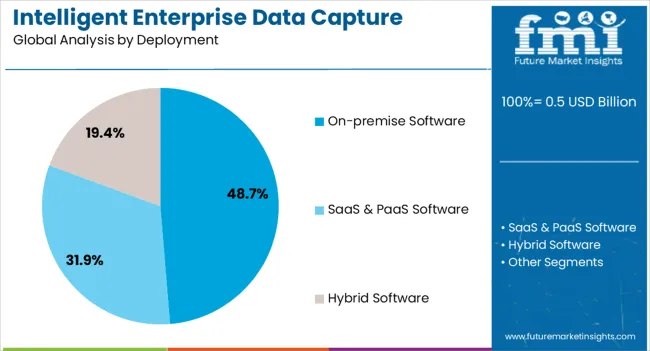
The on-premise software segment, accounting for 48.7% of the deployment category, has been leading due to stringent data privacy requirements in Japan and the preference of enterprises for direct control over sensitive information. Adoption has been supported by established IT infrastructure within large organizations and the ability of on-premise solutions to offer customization aligned with business processes.
High reliability, system ownership, and integration with in-house data centers have reinforced segment growth. Despite the rise of cloud deployment models, resistance due to regulatory and compliance risks has preserved the dominance of on-premise systems.
Investments in security upgrades and hybrid deployment capabilities are enabling gradual modernization while maintaining operational resilience This balance between control and innovation is expected to sustain the strong position of the on-premise segment.
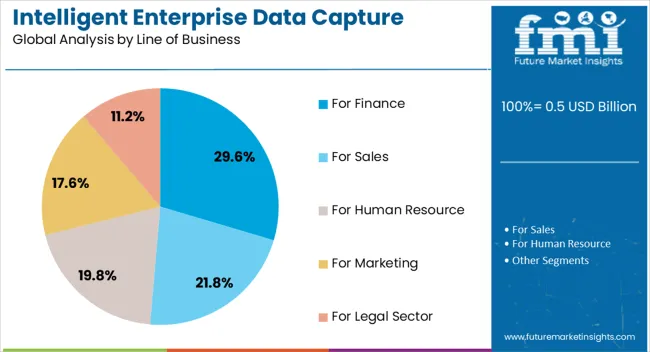
The finance line of business segment, representing 29.6% of the category, has remained at the forefront due to the high volume of transactional data and stringent regulatory frameworks governing financial institutions in Japan. Adoption has been reinforced by the need for accurate, secure, and auditable data capture in banking, insurance, and investment services.
The segment’s strength lies in its ability to streamline compliance reporting, risk management, and client servicing. Integration with financial information systems and advanced analytics tools has enabled efficiency improvements and real-time insights.
Market confidence has been bolstered by consistent product innovation and alignment with industry standards for data protection Continued emphasis on digital transformation in the Japanese financial sector is expected to maintain this segment’s share and expand adoption of intelligent data capture solutions across both large institutions and mid-tier financial organizations.
Intelligent enterprise data capture software now manages corporate operations in Japan, including advertising, staff administration, stock management, as well as manufacturing for major organizations. As businesses are proliferating in the country, followed by rapid economic development in Asia, the adoption of this software is anticipated to increase.
The development of administrative modules has also spurred the demand for intelligent enterprise data capture software in Japan. For the automation of management processes in commercial procedures, the use of such software has also expanded in government and educational sectors.
The ability to deliver dependable services and improved data security without an internet connection is contributing to the rising popularity of intelligent enterprise data capture software in Japan. The development of intelligent enterprise data capture software for on-premise deployment now also provides users with flexible system access without compromising data transfer speed.
Intelligent enterprise software has integrated CRM capabilities to help firms increase their revenue and enhance customer satisfaction. With more companies in Japan grappling with massive amounts of data, they are turning to big data capture and analytics technologies.
Utilizing business software demands time, money, and expertise, and enterprise software is also expensive, in part because of this lengthy implementation process. Moreover, the high installation cost and necessary arrangements require substantial investment, which limits its adoption in smaller enterprises in Japan.
In terms of revenue, the intelligent enterprise data capture software for the sales management category accounts for 28.0% of the industry in 2025. This category comprises a complex network of businesses and individuals, including producers, distributors, and providers of raw materials, buyers, and consumers. The expansion of the marketing segment is expected to be lucrative through 2035, driven by the growing demand for increased operational efficiency in the coming years.
| Intelligent Enterprise Data Capture Software in Japan based on Line of Business | Sales |
|---|---|
| Total Share (2025) | 28.0% |
The software segment, with a revenue share of around 64.8%, is the leading product type segment in Japan in 2025. Enterprise software has long been utilized by both small and large firms in the country to maintain business quality. With the advent of intelligent software for data collection and analysis, propelled by advancements in AI and machine learning, businesses have gained unprecedented insights and efficiency in their operations.
The emergence of intelligent software has witnessed a significant surge in adoption, reflecting a growing recognition of its transformative potential within the current industry landscape in Japan.
| Intelligent Enterprise Data Capture Software in Japan based on Product Type | Software |
|---|---|
| Total Share (2025) | 64.8% |
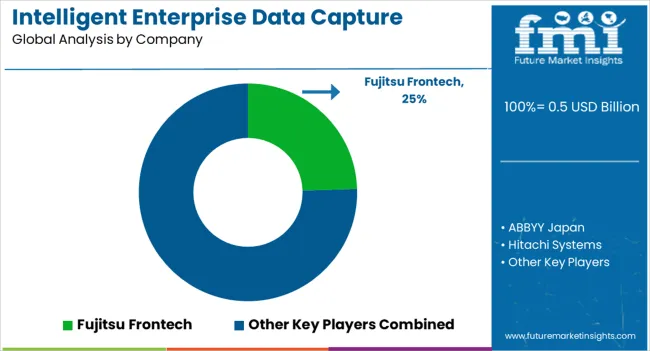
Software developers in Japan provide multiple solutions for intelligent enterprise data capture, such as optical character recognition (OCR) and intelligent document processing (IDP). Data capture powered by machine learning (ML) is a rapidly emerging trend that could potentially reshape the competitive landscape of the industry in Japan. Software developers are also releasing solutions driven by artificial intelligence (AI) to enhance the analytical capabilities of enterprise data.
In recent years, to bolster their business, software providers in Japan have focused on creating affordable, SME-specific enterprise software. Consequently, in the near future, we may witness a surge in the emergence of startups entering the business software development sector in the country. This could ultimately have a positive impact on the overall development of intelligent enterprise data capture software and increase competition in Japan.
Digitalization is sweeping across industries in Japan, and businesses are adopting modern technologies as they transition from conventional to digital production methods. Given the way industrial IoT technology is revolutionizing manufacturing, construction, and other sectors, authorities in Japan are actively supporting regional players.
Recent Developments in Intelligent Enterprise Data Capture Software in Japan
Fujitsu Laboratories in Japan developed a management system in December 2024 that leverages artificial intelligence (AI). With potential applications in medical, marketing, manufacturing, and various other areas, it is acclaimed as the top cutting-edge intelligent enterprise software in Japan. The developers claim it can identify typical cause-and-effect correlations within various sets of data related to people and objects across a wide range of domains.
Hitachi announced the transformation of its existing data storage portfolio with the introduction of Hitachi Virtual Storage Platform One in October 2025. This single hybrid cloud data platform was introduced by Hitachi Vantara, a subsidiary of Hitachi, in response to the crucial challenges facing IT leaders. It could be particularly useful for intelligent enterprise software users seeking to scale data and modernize applications across complex, distributed hybrid and multi-cloud infrastructures.
| Attribute | Details |
|---|---|
| Estimated Industry Size in 2025 | USD 0.5 billion |
| Projected Industry Size by 2035 | USD 1.7 billion |
| Anticipated CAGR between 2025 to 2035 | 12.1% CAGR |
| Historical Analysis of Demand for Intelligent Enterprise Data Capture Software in Japan | 2020 to 2025 |
| Demand Forecast for Intelligent Enterprise Data Capture Software in Japan | 2025 to 2035 |
| Report Coverage | Industry Size, Industry Trends, Analysis of key factors influencing Intelligent Enterprise Data Capture Software in Japan, Insights on Global Players and their Industry Strategy in Japan, Ecosystem Analysis of Local and Japan Providers |
| Key Cities Profiled | Kanto, Chubu, Kinki, Kyushu & Okinawa, Tohoku, Rest of Japan |
| Key Companies Profiled | ABBYY Japan; Fujitsu Frontech; Hitachi Systems; NEC; NTT Data; Ricoh; ScanSnap; Square Enix; Toshiba TEC |
The global intelligent enterprise data capture software industry analysis in japan is estimated to be valued at USD 0.5 billion in 2025.
The market size for the intelligent enterprise data capture software industry analysis in japan is projected to reach USD 1.7 billion by 2035.
The intelligent enterprise data capture software industry analysis in japan is expected to grow at a 12.1% CAGR between 2025 and 2035.
The key product types in intelligent enterprise data capture software industry analysis in japan are intelligent enterprise data capture software, handwriting recognition, optical character recognition, intelligent document recognition, intelligent enterprise data capture services, consulting, trAIning and implementation & support.
In terms of deployment, on-premise software segment to command 48.7% share in the intelligent enterprise data capture software industry analysis in japan in 2025.


Full Research Suite comprises of:
Market outlook & trends analysis
Interviews & case studies
Strategic recommendations
Vendor profiles & capabilities analysis
5-year forecasts
8 regions and 60+ country-level data splits
Market segment data splits
12 months of continuous data updates
DELIVERED AS:
PDF EXCEL ONLINE
Intelligent Road Test Instruments Market Size and Share Forecast Outlook 2025 to 2035
Intelligent Driving Technology Solution Market Size and Share Forecast Outlook 2025 to 2035
Intelligent Completion Market Size and Share Market Forecast and Outlook 2025 to 2035
Intelligent Rubber Tracks Market Size and Share Forecast Outlook 2025 to 2035
Intelligent Cervical Massager Market Size and Share Forecast Outlook 2025 to 2035
Intelligent Garment Hanging Conveyor System Market Size and Share Forecast Outlook 2025 to 2035
Intelligent Rotary Kiln Monitoring Systems Market Size and Share Forecast Outlook 2025 to 2035
Intelligent Multifunctional Laser Bird Repeller Market Size and Share Forecast Outlook 2025 to 2035
Intelligent Platform Management Interface (IPMI) Market Size and Share Forecast Outlook 2025 to 2035
Intelligent Flow Meter Market Size and Share Forecast Outlook 2025 to 2035
Intelligent Lighting Control Market Size and Share Forecast Outlook 2025 to 2035
Intelligent Vending Machine Market Insights – Demand, Size & Industry Trends 2025–2035
Intelligent Transportation System Market Analysis - Size, Share, and Forecast Outlook 2025 to 2035
Intelligent Virtual Store Design Solution Market Size and Share Forecast Outlook 2025 to 2035
Intelligent Fencing Market Size and Share Forecast Outlook 2025 to 2035
Intelligent Packaging Market Analysis - Size, Share, and Forecast Outlook 2025 to 2035
Intelligent Power Module Market Trends - Growth & Forecast 2025 to 2035
Intelligent Prosthetics Market Analysis - Size, Share, and Forecast 2025 to 2035
Intelligent Traffic Management Market Trends – Growth & Forecast 2024 to 2034
Intelligent Motor Control Market

Thank you!
You will receive an email from our Business Development Manager. Please be sure to check your SPAM/JUNK folder too.
Chat With
MaRIA