Reports

- Global Locations -

Headquarters

Future Market Insights, Inc.

Christiana Corporate, 200
Continental Drive, Suite 401,
Newark, Delaware - 19713,
United States

T: +1-845-579-5705

Americas

Future Market Insights, Inc.

616 Corporate Way, Suite 2-9018,
Valley Cottage, NY 10989, United States

T: +1-347-918-3531

MEA

Future Market Insights

1602-6 Jumeirah Bay X2 Tower, Plot No: JLT-PH2-X2A,
Jumeirah Lakes Towers, Dubai,
United Arab Emirates

Europe

Future Market Insights

3rd Floor, 207 Regent Street,
W1B 3HH London
United Kingdom

T: + 44 (0) 20 8123 9659
D: +44 (0) 20 3287 4268

Asia Pacific

Future Market Insights

IndiaLand Global Tech Park, Unit UG-1, Behind Grand HighStreet, Phase 1, Hinjawadi, MH, Pune – 411057, India

Intelligent Fencing Market Snapshot (2022 to 2032)

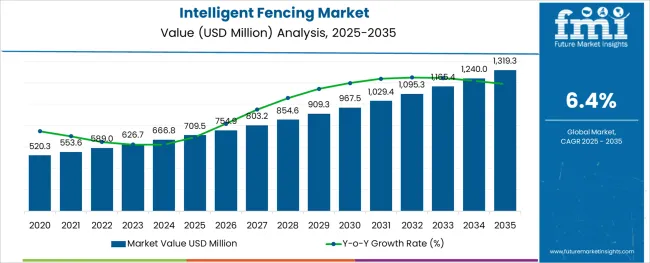
Global Intelligent Fencing demand is anticipated to be valued at US$ 589.0 Million in 2022, forecast to grow at a CAGR of 6.4% to be valued at US$ 1,100.0 Million from 2022 to 2032. Growth is attributed to the rise in safety and security concerns.

Report Attribute Details
Growth Rate (2016 to 2021) 5.2% CAGR
Expected Market Value (2022) US$ 589.0 Million
Anticipated Forecast Value (2032) US$ 1,100.0 Million
Projected Growth Rate (2022 to 2032) 6.4% CAGR

Intelligent fencing is an electric fence security system that is attached to the existing perimeter wall or fence of the property to detect and prevent intrusion into the perimeter. Intelligent fencing is the first line of defense against unauthorized access, and it provides the physical barrier that delays the intrusion time, thus giving more time to respond to alarm/alert messages.

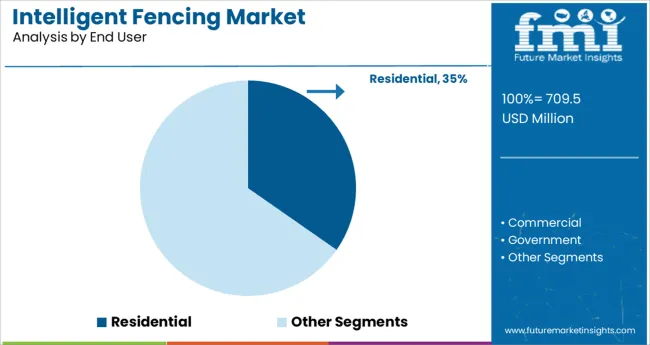
Intelligent fencing is widely used to isolate and protect public and private places such as airports, military bases, and power stations against unauthorized access. In addition, various residential, commercial, and government organizations are adopting intelligent fencing to protect the property which makes it difficult and risky for criminals to penetrate.

The intelligent fencing market is growing significantly due to the increase in the number of crimes such as burglary, robbery, and, vandalism. The growing demand for intelligent security solutions across residential, commercial, and government sectors is one of the major factors which are fueling the growth of the intelligent fencing market.

On the contrary, the high cost of intelligent fencing is one of the major factors that is expected to hamper the growth of the Intelligent Fencing Market over the analysis period.

Don't pay for what you don't need

Customize your report by selecting specific countries or regions and save 30%!

Which are Some Prominent Drivers Spearheading Intelligent Fencing Market Growth?

The increasing demand for intelligent fencing systems for warehouse storage centers, security, and farmland security is one of the major factors that is expected to propel the growth of the intelligent fencing market over the analysis period.

Another major factor responsible for the market growth includes the rise in safety and security concerns and spending carried out for commercial and government constructions.

Various advantages of intelligent fencing over alarm systems and CCTV surveillance are boosting the growth of the intelligent fencing market. The intelligent fencing market is witnessing high growth due to the increase in government spending for enhancing public places, and government premises.

The usage of intelligent fencing by armed forces to seal international borders is another factor that is expected to accelerate the growth of the intelligent fencing market in the forthcoming years. Moreover, the increasing adoption of the product from farm owners to secure land from wild animals by creating a barrier that keeps farms safe from any intrusion is anticipated to fuel market growth in the near future.

What are the Challenges Faced by the Intelligent Fencing Industry?

One of the critical challenges in the Intelligent Fencing market is the vulnerability to cyber-attacks. In addition, device and system compatibility is also a major challenge that is expected to impede the growth of the Intelligent Fencing market during the forecast period.

The high cost of intelligent fencing and maintenance associated with replacing the intelligent fencing is expected to hinder the growth of the Intelligent Fencing Market. The high maintenance cost is associated with the requirement to spreading fences across international borders and maintain regular inspections to ensure optimum usability. Owing to the high maintenance costs, the end-users are looking for other alternatives such as unmanned systems which is another factor challenging the market growth.
Sudip Saha
Sudip Saha

Principal Consultant

Talk to Analyst

Find your sweet spots for generating winning opportunities in this market.

Why is North America Emerging as an Opportunistic Intelligent Fencing Market?

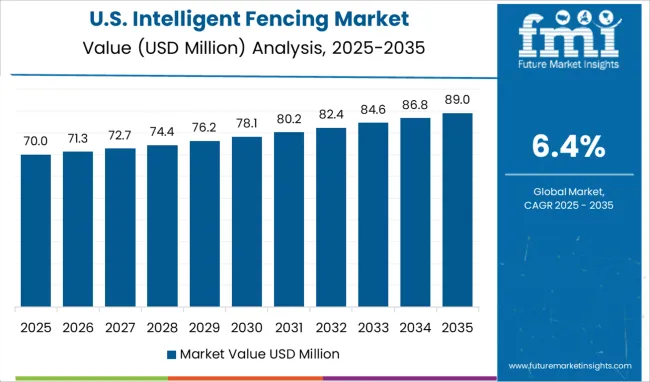
In terms of regional platforms, North America holds the largest market share in the Intelligent Fencing market. The region is expected to surge to over 27.2% share from 2022 to 2032.

North America is expected to fuel the Intelligent Fencing market, attributed to the presence of a large number of electric fence providers along with the large defense spending by the US in the region.
How is Europe Contributing to Growth of the Intelligent Fencing Market?

According to Future Market Insights, Europe is expected to hold significant growth opportunities for Intelligent Fencing and is expected to reach the highest share of 19.9% in 2022.

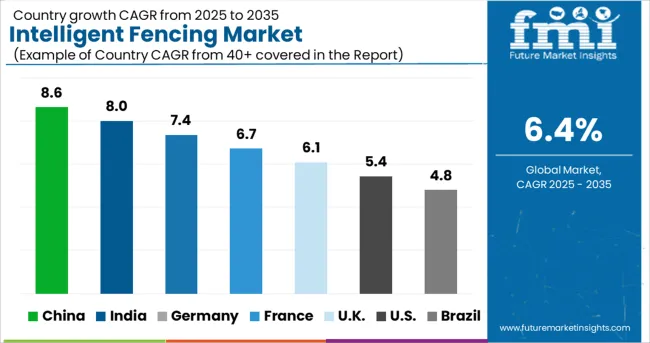
Europe is expected to register a significant share during the forecast period. The increasing adoption of intelligent fencing for homeland security is driving the growth of the market in the region.

Get the data you need at a Fraction of the cost

Personalize your report by choosing insights you need
and save 40%!

Where does Asia-Pacific Region Stand in the Intelligent Fencing Market?

According to Future Market Insights, Asia-Pacific is expected to grow with lucrative growth opportunities for Intelligent Fencing Market and is expected to reach the highest share of 19.4% in 2022.

Asia-Pacific region accounts for a significant share of the Intelligent Fencing Market, attributed to the rising defense budgets from developing economies such as India and China and large agriculture industries in the region, which are anticipated to propel the growth of the market.

How is Middle East & Africa Contributing to Growth of the Intelligent Fencing Market?

According to Future Market Insights, the Middle East & Africa are expected to provide significant growth opportunities for Intelligent Fencing Market and are expected to reach a share of 13.7% in 2022.

The increasing use of fencing for border security to restrain the smuggling of goods and drug activities are likely to fuel the growth of the intelligent fencing market in the Middle East & Africa.

Role of Start-ups in Intelligent Fencing Market

There are many prominent market players in the Intelligent Fencing Market such as Dare Products, High Tech Pet, Kencove, Parker McCrory Mfg Co., PetSafe, Premier1Supplies, Woodstream, Datamars SA, AMAROK, LLC, and Nemtek, among others, that are working hand-in-hand to provide the best-in-class Intelligent Fencing for enhancing the global arena. However, there are many global start-ups in the Intelligent Fencing Market, that are stepping forward in matching the requirements of the Intelligent Fencing domain.
  • In May 2021, Datamars SA partnered with Cabi Group to expand the distribution network of world-renowned Speedrite Intelligent Fencing products in France.
  • In August 2019, JVA Technologies launched the Jumbo (JMB) fence energizer series. The JMB series is used to store 46J of stored energy. The JMB series consists of a JVA Virtual Keypad used to control, monitor, and program the energizer from Wi-Fi-enabled devices such as smartphones, tablets, and laptops.

Market Competition

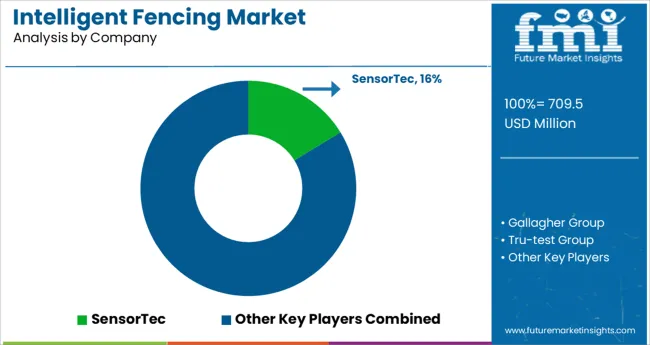
Some of the key participants present in the global Intelligent Fencing market include SensorTec, Gallagher Group, Tru-test Group, Smart Fence integrated Security, Betafence NV, Long Fence, CertainTeed, ST Microelectronics, and NXP semiconductors, among others.

Attributed to the presence of such a high number of participants, the market is highly competitive. While global players such as SensorTec, Gallagher Group, Tru-test Group, and Smart Fence integrated Security account for a considerable market size, several regional-level players are also operating across key growth regions, particularly in North America.

Recent Development:

  • In June 2020, Under the National Agriculture Development Scheme, INR 3 crore were allocated to encourage the use of solar electric fence system for farmlands in Tamil Nadu.
  • In September 2019, Parker McCrory Mfg. Co-launched Model MAG-12-U.O. and MAG-12-SP Models of electric fencing chargers. It can pass electricity of twelve volts for medium to large pastures. They possess low impedance and will shock through weeds and brush and are ideal for cattle, sheep, deer, etc. The MAG-12-U.O. (solar-powered) and MAG-12-SP are used for fencing large animals and larger pastures.
  • In July 2019, Senstar Corporation has published a case study about intelligent lighting systems and LM100 hybrid perimeter intrusion detection systems. These are used to provide electric fence security for USA electrical utility companies. The Senstar Corporation developed LED-based (LM100 hybrid perimeter) lighting, which acts as an initial deterrent if any unauthorized entrant attempts to break through the electric fencing sending an instant alert through a security management system.

Report Scope

Report Attribute Details
Growth Rate CAGR of 6.4% from 2022 to 2032
Market Value in 2022 US$ 589.0 Million
Market Value in 2032 US$ 1,100.0 Million
Base Year for Estimation 2021
Historical Data 2016 to 2021
Forecast Period 2022 to 2032
Quantitative Units Revenue in USD Million and CAGR from 2022 to 2032
Report Coverage Revenue Forecast, Volume Forecast, Company Ranking, Competitive Landscape, Growth Factors, Trends, and Pricing Analysis
Segments Covered
  • Product Type
  • Application
  • Region
Regions Covered
  • North America
  • Latin America
  • Europe
  • Asia Pacific
  • Middle East and Africa
Key Countries Profiled
  • United States of America
  • Canada
  • Brazil
  • Argentina
  • Germany
  • United Kingdom
  • France
  • Spain
  • Italy
  • Nordics
  • Belgium
  • Netherlands
  • Luxembourg
  • Poland
  • Russia
  • Australia & New Zealand
  • China
  • India
  • ASIAN
  • GCC Countries
  • South Africa
Key Companies Profiled SensorTec, Gallagher Group, Tru-test Group, Smart Fence Integrated Security, Betafence NV, Long Fence, CertainTeed, ST Microelectronics, and NXP semiconductors, among others.
Customization Available Upon Request

Key Segments Profiled in the Intelligent Fencing Industry Survey

By Product Type:

  • Cloud-Based
  • On-Premise

By Application:

  • For Commercial Use
  • For Residential Use

By Region:

  • North America
  • Latin America
  • Europe
  • Asia Pacific
  • Middle East and Africa

Frequently Asked Questions

What is the anticipated growth of the Intelligent Fencing market until 2032?

FMI projects the global Intelligent Fencing market to expand at an 6.4% value CAGR by 2032

Which region is forecast to be the most lucrative for Intelligent Fencing market growth?

North America is expected to be the most opportunistic Intelligent Fencing market, expanding at a 27.2% market share

Which are some prominent Intelligent Fencing players?

SensorTec, Gallagher Group, Tru-test Group, and Smart Fence integrated Security are some prominent Intelligent Fencing players

Table of Content

1. Executive Summary | Intelligent Fencing Market

    1.1. Global Market Outlook

    1.2. Demand-side Trends

    1.3. Supply-side Trends

    1.4. Technology Roadmap Analysis

    1.5. Analysis and Recommendations

2. Market Overview

    2.1. Market Coverage / Taxonomy

    2.2. Market Definition / Scope / Limitations

3. Market Background

    3.1. Market Dynamics

        3.1.1. Drivers

        3.1.2. Restraints

        3.1.3. Opportunity

        3.1.4. Trends

    3.2. Scenario Forecast

        3.2.1. Demand in Optimistic Scenario

        3.2.2. Demand in Likely Scenario

        3.2.3. Demand in Conservative Scenario

    3.3. Opportunity Map Analysis

    3.4. Investment Feasibility Matrix

    3.5. PESTLE and Porter’s Analysis

    3.6. Regulatory Landscape

        3.6.1. By Key Regions

        3.6.2. By Key Countries

    3.7. Regional Parent Market Outlook

4. Global Market Analysis 2016 to 2021 and Forecast, 2022 to 2032

    4.1. Historical Market Size Value (US$ Million) Analysis, 2016 to 2021

    4.2. Current and Future Market Size Value (US$ Million) Projections, 2022 to 2032

        4.2.1. Y-o-Y Growth Trend Analysis

        4.2.2. Absolute Opportunity Analysis

5. Global Market Analysis 2016 to 2021 and Forecast 2022 to 2032, By End User

    5.1. Introduction / Key Findings

    5.2. Historical Market Size Value (US$ Million) Analysis By End User, 2016 to 2021

    5.3. Current and Future Market Size Value (US$ Million) Analysis and Forecast By End User, 2022 to 2032

        5.3.1. Residential

        5.3.2. Commercial

        5.3.3. Government

        5.3.4. Others

    5.4. Y-o-Y Growth Trend Analysis By End User, 2016 to 2021

    5.5. Absolute Opportunity Analysis By End User, 2022 to 2032

6. Global Market Analysis 2016 to 2021 and Forecast 2022 to 2032, By Region

    6.1. Introduction

    6.2. Historical Market Size Value (US$ Million) Analysis By Region, 2016 to 2021

    6.3. Current Market Size Value (US$ Million) Analysis and Forecast By Region, 2022 to 2032

        6.3.1. North America

        6.3.2. Latin America

        6.3.3. Europe

        6.3.4. Asia Pacific

        6.3.5. Middle East and Africa

    6.4. Market Attractiveness Analysis By Region

7. North America Market Analysis 2016 to 2021 and Forecast 2022 to 2032, By Country

    7.1. Historical Market Size Value (US$ Million) Trend Analysis By Market Taxonomy, 2016 to 2021

    7.2. Market Size Value (US$ Million) Forecast By Market Taxonomy, 2022 to 2032

        7.2.1. By Country

            7.2.1.1. United States of America

            7.2.1.2. Canada

        7.2.2. By End User

    7.3. Market Attractiveness Analysis

        7.3.1. By Country

        7.3.2. By End User

    7.4. Key Takeaways

8. Latin America Market Analysis 2016 to 2021 and Forecast 2022 to 2032, By Country

    8.1. Historical Market Size Value (US$ Million) Trend Analysis By Market Taxonomy, 2016 to 2021

    8.2. Market Size Value (US$ Million) Forecast By Market Taxonomy, 2022 to 2032

        8.2.1. By Country

            8.2.1.1. Brazil

            8.2.1.2. Mexico

            8.2.1.3. Rest of Latin America

        8.2.2. By End User

    8.3. Market Attractiveness Analysis

        8.3.1. By Country

        8.3.2. By End User

    8.4. Key Takeaways

9. Europe Market Analysis 2016 to 2021 and Forecast 2022 to 2032, By Country

    9.1. Historical Market Size Value (US$ Million) Trend Analysis By Market Taxonomy, 2016 to 2021

    9.2. Market Size Value (US$ Million) Forecast By Market Taxonomy, 2022 to 2032

        9.2.1. By Country

            9.2.1.1. Germany

            9.2.1.2. United Kingdom

            9.2.1.3. France

            9.2.1.4. Spain

            9.2.1.5. Italy

            9.2.1.6. Rest of Europe

        9.2.2. By End User

    9.3. Market Attractiveness Analysis

        9.3.1. By Country

        9.3.2. By End User

    9.4. Key Takeaways

10. Asia Pacific Market Analysis 2016 to 2021 and Forecast 2022 to 2032, By Country

    10.1. Historical Market Size Value (US$ Million) Trend Analysis By Market Taxonomy, 2016 to 2021

    10.2. Market Size Value (US$ Million) Forecast By Market Taxonomy, 2022 to 2032

        10.2.1. By Country

            10.2.1.1. China

            10.2.1.2. Japan

            10.2.1.3. South Korea

            10.2.1.4. Malaysia

            10.2.1.5. Singapore

            10.2.1.6. Australia

            10.2.1.7. Rest of Asia Pacific

        10.2.2. By End User

    10.3. Market Attractiveness Analysis

        10.3.1. By Country

        10.3.2. By End User

    10.4. Key Takeaways

11. Middle East and Africa Market Analysis 2016 to 2021 and Forecast 2022 to 2032, By Country

    11.1. Historical Market Size Value (US$ Million) Trend Analysis By Market Taxonomy, 2016 to 2021

    11.2. Market Size Value (US$ Million) Forecast By Market Taxonomy, 2022 to 2032

        11.2.1. By Country

            11.2.1.1. GCC Countries

            11.2.1.2. South Africa

            11.2.1.3. Israel

            11.2.1.4. Rest of Middle East and Africa

        11.2.2. By End User

    11.3. Market Attractiveness Analysis

        11.3.1. By Country

        11.3.2. By End User

    11.4. Key Takeaways

12. Key Countries Market Analysis

    12.1. United Kingdom

        12.1.1. Pricing Analysis

        12.1.2. Market Share Analysis, 2021

            12.1.2.1. By End User

    12.2. Canada

        12.2.1. Pricing Analysis

        12.2.2. Market Share Analysis, 2021

            12.2.2.1. By End User

    12.3. Brazil

        12.3.1. Pricing Analysis

        12.3.2. Market Share Analysis, 2021

            12.3.2.1. By End User

    12.4. Mexico

        12.4.1. Pricing Analysis

        12.4.2. Market Share Analysis, 2021

            12.4.2.1. By End User

    12.5. Rest of Latin America

        12.5.1. Pricing Analysis

        12.5.2. Market Share Analysis, 2021

            12.5.2.1. By End User

    12.6. Germany

        12.6.1. Pricing Analysis

        12.6.2. Market Share Analysis, 2021

            12.6.2.1. By End User

    12.7. United Kingdom

        12.7.1. Pricing Analysis

        12.7.2. Market Share Analysis, 2021

            12.7.2.1. By End User

    12.8. France

        12.8.1. Pricing Analysis

        12.8.2. Market Share Analysis, 2021

            12.8.2.1. By End User

    12.9. Spain

        12.9.1. Pricing Analysis

        12.9.2. Market Share Analysis, 2021

            12.9.2.1. By End User

    12.10. Italy

        12.10.1. Pricing Analysis

        12.10.2. Market Share Analysis, 2021

            12.10.2.1. By End User

    12.11. Rest of Europe

        12.11.1. Pricing Analysis

        12.11.2. Market Share Analysis, 2021

            12.11.2.1. By End User

    12.12. China

        12.12.1. Pricing Analysis

        12.12.2. Market Share Analysis, 2021

            12.12.2.1. By End User

    12.13. Japan

        12.13.1. Pricing Analysis

        12.13.2. Market Share Analysis, 2021

            12.13.2.1. By End User

    12.14. South Korea

        12.14.1. Pricing Analysis

        12.14.2. Market Share Analysis, 2021

            12.14.2.1. By End User

    12.15. Malaysia

        12.15.1. Pricing Analysis

        12.15.2. Market Share Analysis, 2021

            12.15.2.1. By End User

    12.16. Singapore

        12.16.1. Pricing Analysis

        12.16.2. Market Share Analysis, 2021

            12.16.2.1. By End User

    12.17. Australia

        12.17.1. Pricing Analysis

        12.17.2. Market Share Analysis, 2021

            12.17.2.1. By End User

    12.18. Rest of Asia Pacific

        12.18.1. Pricing Analysis

        12.18.2. Market Share Analysis, 2021

            12.18.2.1. By End User

    12.19. GCC Countries

        12.19.1. Pricing Analysis

        12.19.2. Market Share Analysis, 2021

            12.19.2.1. By End User

    12.20. South Africa

        12.20.1. Pricing Analysis

        12.20.2. Market Share Analysis, 2021

            12.20.2.1. By End User

    12.21. Israel

        12.21.1. Pricing Analysis

        12.21.2. Market Share Analysis, 2021

            12.21.2.1. By End User

    12.22. Rest of the Middle East and Africa

        12.22.1. Pricing Analysis

        12.22.2. Market Share Analysis, 2021

            12.22.2.1. By End User

13. Market Structure Analysis

    13.1. Competition Dashboard

    13.2. Competition Benchmarking

    13.3. Market Share Analysis of Top Players

        13.3.1. By Regional

        13.3.2. By End User

14. Competition Analysis

    14.1. Competition Deep Dive

        14.1.1. SensorTec

            14.1.1.1. Overview

            14.1.1.2. Product Portfolio

            14.1.1.3. Profitability by Market Segments

            14.1.1.4. Sales Footprint

            14.1.1.5. Strategy Overview

                14.1.1.5.1. Marketing Strategy

        14.1.2. Gallagher Group

            14.1.2.1. Overview

            14.1.2.2. Product Portfolio

            14.1.2.3. Profitability by Market Segments

            14.1.2.4. Sales Footprint

            14.1.2.5. Strategy Overview

                14.1.2.5.1. Marketing Strategy

        14.1.3. Tru-test Group

            14.1.3.1. Overview

            14.1.3.2. Product Portfolio

            14.1.3.3. Profitability by Market Segments

            14.1.3.4. Sales Footprint

            14.1.3.5. Strategy Overview

                14.1.3.5.1. Marketing Strategy

        14.1.4. Smart Fence Integrated Security

            14.1.4.1. Overview

            14.1.4.2. Product Portfolio

            14.1.4.3. Profitability by Market Segments

            14.1.4.4. Sales Footprint

            14.1.4.5. Strategy Overview

                14.1.4.5.1. Marketing Strategy

        14.1.5. Betafence NV

            14.1.5.1. Overview

            14.1.5.2. Product Portfolio

            14.1.5.3. Profitability by Market Segments

            14.1.5.4. Sales Footprint

            14.1.5.5. Strategy Overview

                14.1.5.5.1. Marketing Strategy

        14.1.6. Long Fence

            14.1.6.1. Overview

            14.1.6.2. Product Portfolio

            14.1.6.3. Profitability by Market Segments

            14.1.6.4. Sales Footprint

            14.1.6.5. Strategy Overview

                14.1.6.5.1. Marketing Strategy

        14.1.7. CertainTeed

            14.1.7.1. Overview

            14.1.7.2. Product Portfolio

            14.1.7.3. Profitability by Market Segments

            14.1.7.4. Sales Footprint

            14.1.7.5. Strategy Overview

                14.1.7.5.1. Marketing Strategy

        14.1.8. ST Microelectronics

            14.1.8.1. Overview

            14.1.8.2. Product Portfolio

            14.1.8.3. Profitability by Market Segments

            14.1.8.4. Sales Footprint

            14.1.8.5. Strategy Overview

                14.1.8.5.1. Marketing Strategy

        14.1.9. NXP Semiconductors

            14.1.9.1. Overview

            14.1.9.2. Product Portfolio

            14.1.9.3. Profitability by Market Segments

            14.1.9.4. Sales Footprint

            14.1.9.5. Strategy Overview

                14.1.9.5.1. Marketing Strategy

        14.1.10. Arteco Global

            14.1.10.1. Overview

            14.1.10.2. Product Portfolio

            14.1.10.3. Profitability by Market Segments

            14.1.10.4. Sales Footprint

            14.1.10.5. Strategy Overview

                14.1.10.5.1. Marketing Strategy

15. Assumptions & Acronyms Used

16. Research Methodology

List of Tables

Table 1: Global Market Value (US$ Million) Forecast by Region, 2016 to 2032

Table 2: Global Market Value (US$ Million) Forecast by End User, 2016 to 2032

Table 3: North America Market Value (US$ Million) Forecast by Country, 2016 to 2032

Table 4: North America Market Value (US$ Million) Forecast by End User, 2016 to 2032

Table 5: Latin America Market Value (US$ Million) Forecast by Country, 2016 to 2032

Table 6: Latin America Market Value (US$ Million) Forecast by End User, 2016 to 2032

Table 7: Europe Market Value (US$ Million) Forecast by Country, 2016 to 2032

Table 8: Europe Market Value (US$ Million) Forecast by End User, 2016 to 2032

Table 9: Asia Pacific Market Value (US$ Million) Forecast by Country, 2016 to 2032

Table 10: Asia Pacific Market Value (US$ Million) Forecast by End User, 2016 to 2032

Table 11: Middle East and Africa Market Value (US$ Million) Forecast by Country, 2016 to 2032

Table 12: Middle East and Africa Market Value (US$ Million) Forecast by End User, 2016 to 2032

List of Charts

Figure 1: Global Market Value (US$ Million) by End User, 2022 to 2032

Figure 2: Global Market Value (US$ Million) by Region, 2022 to 2032

Figure 3: Global Market Value (US$ Million) Analysis by Region, 2016 to 2032

Figure 4: Global Market Value Share (%) and BPS Analysis by Region, 2022 to 2032

Figure 5: Global Market Y-o-Y Growth (%) Projections by Region, 2022 to 2032

Figure 6: Global Market Value (US$ Million) Analysis by End User, 2016 to 2032

Figure 7: Global Market Value Share (%) and BPS Analysis by End User, 2022 to 2032

Figure 8: Global Market Y-o-Y Growth (%) Projections by End User, 2022 to 2032

Figure 9: Global Market Attractiveness by End User, 2022 to 2032

Figure 10: Global Market Attractiveness by Region, 2022 to 2032

Figure 11: North America Market Value (US$ Million) by End User, 2022 to 2032

Figure 12: North America Market Value (US$ Million) by Country, 2022 to 2032

Figure 13: North America Market Value (US$ Million) Analysis by Country, 2016 to 2032

Figure 14: North America Market Value Share (%) and BPS Analysis by Country, 2022 to 2032

Figure 15: North America Market Y-o-Y Growth (%) Projections by Country, 2022 to 2032

Figure 16: North America Market Value (US$ Million) Analysis by End User, 2016 to 2032

Figure 17: North America Market Value Share (%) and BPS Analysis by End User, 2022 to 2032

Figure 18: North America Market Y-o-Y Growth (%) Projections by End User, 2022 to 2032

Figure 19: North America Market Attractiveness by End User, 2022 to 2032

Figure 20: North America Market Attractiveness by Country, 2022 to 2032

Figure 21: Latin America Market Value (US$ Million) by End User, 2022 to 2032

Figure 22: Latin America Market Value (US$ Million) by Country, 2022 to 2032

Figure 23: Latin America Market Value (US$ Million) Analysis by Country, 2016 to 2032

Figure 24: Latin America Market Value Share (%) and BPS Analysis by Country, 2022 to 2032

Figure 25: Latin America Market Y-o-Y Growth (%) Projections by Country, 2022 to 2032

Figure 26: Latin America Market Value (US$ Million) Analysis by End User, 2016 to 2032

Figure 27: Latin America Market Value Share (%) and BPS Analysis by End User, 2022 to 2032

Figure 28: Latin America Market Y-o-Y Growth (%) Projections by End User, 2022 to 2032

Figure 29: Latin America Market Attractiveness by End User, 2022 to 2032

Figure 30: Latin America Market Attractiveness by Country, 2022 to 2032

Figure 31: Europe Market Value (US$ Million) by End User, 2022 to 2032

Figure 32: Europe Market Value (US$ Million) by Country, 2022 to 2032

Figure 33: Europe Market Value (US$ Million) Analysis by Country, 2016 to 2032

Figure 34: Europe Market Value Share (%) and BPS Analysis by Country, 2022 to 2032

Figure 35: Europe Market Y-o-Y Growth (%) Projections by Country, 2022 to 2032

Figure 36: Europe Market Value (US$ Million) Analysis by End User, 2016 to 2032

Figure 37: Europe Market Value Share (%) and BPS Analysis by End User, 2022 to 2032

Figure 38: Europe Market Y-o-Y Growth (%) Projections by End User, 2022 to 2032

Figure 39: Europe Market Attractiveness by End User, 2022 to 2032

Figure 40: Europe Market Attractiveness by Country, 2022 to 2032

Figure 41: Asia Pacific Market Value (US$ Million) by End User, 2022 to 2032

Figure 42: Asia Pacific Market Value (US$ Million) by Country, 2022 to 2032

Figure 43: Asia Pacific Market Value (US$ Million) Analysis by Country, 2016 to 2032

Figure 44: Asia Pacific Market Value Share (%) and BPS Analysis by Country, 2022 to 2032

Figure 45: Asia Pacific Market Y-o-Y Growth (%) Projections by Country, 2022 to 2032

Figure 46: Asia Pacific Market Value (US$ Million) Analysis by End User, 2016 to 2032

Figure 47: Asia Pacific Market Value Share (%) and BPS Analysis by End User, 2022 to 2032

Figure 48: Asia Pacific Market Y-o-Y Growth (%) Projections by End User, 2022 to 2032

Figure 49: Asia Pacific Market Attractiveness by End User, 2022 to 2032

Figure 50: Asia Pacific Market Attractiveness by Country, 2022 to 2032

Figure 51: Middle East and Africa Market Value (US$ Million) by End User, 2022 to 2032

Figure 52: Middle East and Africa Market Value (US$ Million) by Country, 2022 to 2032

Figure 53: Middle East and Africa Market Value (US$ Million) Analysis by Country, 2016 to 2032

Figure 54: Middle East and Africa Market Value Share (%) and BPS Analysis by Country, 2022 to 2032

Figure 55: Middle East and Africa Market Y-o-Y Growth (%) Projections by Country, 2022 to 2032

Figure 56: Middle East and Africa Market Value (US$ Million) Analysis by End User, 2016 to 2032

Figure 57: Middle East and Africa Market Value Share (%) and BPS Analysis by End User, 2022 to 2032

Figure 58: Middle East and Africa Market Y-o-Y Growth (%) Projections by End User, 2022 to 2032

Figure 59: Middle East and Africa Market Attractiveness by End User, 2022 to 2032

Figure 60: Middle East and Africa Market Attractiveness by Country, 2022 to 2032

Recommendations

Industrial Automation

Temporary Fencing Panels Market

Published : June 2023

Technology

Network Access Control (NAC) Market

Published : February 2023

Packaging

Controlled Intelligent Packaging Market

Published : September 2022

Healthcare

Pharmacy Refrigerators Market

Published : July 2022

Explore Technology Insights

View Reports

Intelligent Fencing Market