Active, Smart and Intelligent Packaging Market
Market Survey on Active, Smart and Intelligent Packaging Market Covering Sales Outlook, Up-to-date Key Trends, Market Size and Forecast, Supply and Demand Analysis, Production Capacity, Regulations, Trade Analysis, and Competitor Analysis by Primary and Secondary Packaging Manufacturers
An In-depth Market Insights of Active, Smart and Intelligent Packaging Market including Active Packaging, and Smart and Intelligent Packaging Covering 30+ Countries like United States, United Kingdom, Germany, France, Norway, Sweden, Saudi Arabia, United Arab Emirates, Japan, Korea, Australia, New Zealand, and Others
Active, Smart And Intelligent Packaging Market Snapshot - 2022 – 2027
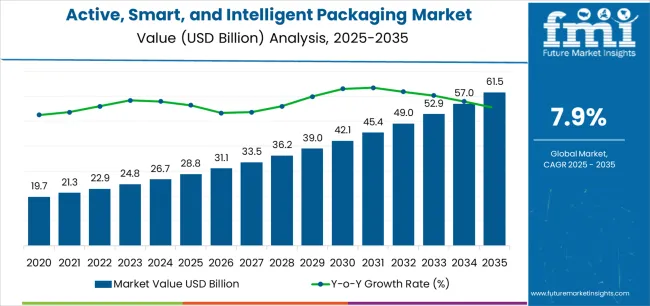
[197 Pages Report] The Global Active, Smart and Intelligent Packaging Market is estimated at US$ 27.1 Bn in 2022 and is projected to reach US$ 43.3 Bn by 2027, at a CAGR of 9.8% from 2022 to 2027.
Market Size 2022 |
US$ 27.1 Bn |
Market Size 2027 |
US$ 43.3 Bn |
Value CAGR (2022-2027) |
9.8% |
Collective Value Share: Top 3 Countries (2022E) |
32% |
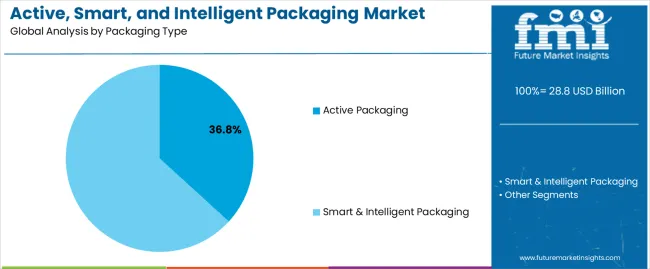
As per the latest industry analysis by FMI, the active packaging type is estimated to be the most used packaging type across the global active, smart & intelligent packaging market with 3/4th of the market share in 2022.
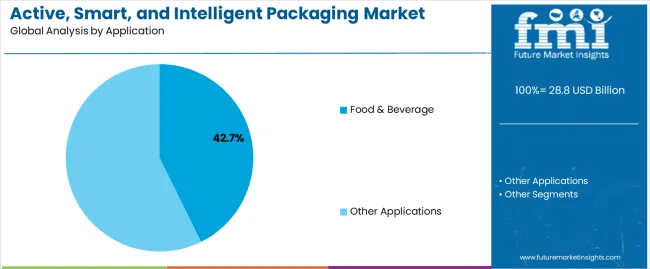
According to the application wise study, almost 50% of the total active, smart and intelligent packaging sold in 2022 across the globe is used across the food & beverage industry. Bolstering demand for preventive packaging among modern-day consumer bases fuels the growth.
The regional consumption survey of active smart & intelligent packaging reveals that Western and Eastern Europe combined are expected to account for US$ 8.7 Bn of sales in 2022 and is projected to reach US$ 12.4 Bn in 2027.
Don't pay for what you don't need
Customize your report by selecting specific countries or regions and save 30%!
How The Market Progressed Till June 2022?
Particulars |
Details |
H1 2021 |
9.1% |
H1 2022 Projected |
9.5% |
H1 2022 Expected |
10.0% |
BPS Change - H1, 2022 (O) – H1, 2022 (P) |
(+) 50 ↑ |
BPS Change – H1, 2022 (O) – H1, 2021 |
(+) 90 ↑ |
Future Market Insights predict a comparison and review analysis of the dynamics of the active, smart & intelligent packaging market, which is principally subjected to an array of industry factors along with a few definite influences regarding high implementation costs on account of huge investments made in R&D is expected to restrain the market growth.
Some new advances that have taken place in the market include the use of smart labels and codes to enhance the interaction between brands and consumers with IoT technologies. In March 2022, Varcode Ltd. partnered with General Data Company, Inc., a leading provider and manufacturer of barcode identification, labelling, packaging, data management, and equipment service products and solutions.
The market for active, smart & intelligent packaging is expected to surge by 90 basis share points (BPS) in H1-2022 (O) against comparison with H1-2021, according to an FMI analysis. However, when comparing the H1-2022 projected and H1-2022 outlook period, a rise in BPS change by 50 BPS has been noticed.
The key reason for this change in growth rate is growing health awareness among consumers, rising concern of food wastage, and supply chain inefficiencies are the factors fueling the growth of the target market.
Despite these prospects, the market growth for active, smart & intelligent packaging is expanding rapidly due to rising consumer demand for ready-to-cook meals, strict food safety laws, and a need for environmentally friendly packaging.
Historic & Forecast Market Outlook For Active, Smart And Intelligent Packaging
The global active smart and intelligent packaging is projected to demonstrate growth at augmenting CAGR of 9.8% over the forecasted period between 2022 and 2027, as compared to a stable CAGR of 7.2% over the historic period between 2012 and 2021.
The average consumer in all parts of the globe has witnessed rising income, which has led to higher expenditure and changes in consumption patterns. Rising awareness regarding hygiene and health has paved way for a new set of consumer preferences in the region. The modern-day consumer is known to have increased spending on health and medical services, and communications, among others.
In addition, due to rapid urbanization in all regions, many consumers have witnessed a shift to a fast-paced lifestyle, where decisions need to be made on the go. Also, in the last decade a surge in the number of modern retail outlets as well as modern trade, further bolstered by the digital revolution. As more and more consumers switched preferences towards e-commerce, a fresh wave of online food retail and delivery services emerged.
All these developments led to an increase in demand for fresh products with extended shelf-life, thus creating the perfect atmosphere for the growth of the active, smart, and intelligent packaging market. Although the active, smart, and intelligent packaging market in the developing regions is yet to grow to its full potential, there have been signs of brands and companies trying to incorporate smart packaging technologies.
How Technological Innovation Driving Competition Fueling Expansion Of Global Active, Smart And Intelligent Packaging Market?
Smart packaging enables brands to increase transparency regarding their products. It enables easy differentiation between authentic products and counterfeits. Smart packaging also enables access to a vast amount of information to the consumer regarding the products, which creates a lasting impression.
Since various forms of active, smart, and intelligent packaging technology make it possible for a brand to provide a complete, unique, and tailored experience to the end-users of that brand, it goes a long way in creating and enhancing brand image.
For instance- La Roche Posay’s My UV Patch by L’Oreal uses Near-field communication (NFC), and augmented reality technologies, supported with a custom mobile application to deliver a personalized consumer experience, which specifically caters to the current consumer lifestyles and behavioural trends.
Similarly, other end-use industries across the regions are also experiencing significant transformation in the ways a product is packaged. Adoption of these technologies can go a long way in ensuring extended shelf life, improved quality, and safety of the product. Hence, it is anticipated that these factors will continue to fuel the growth of the active, smart, and intelligent packaging market in all parts of the world.
What Is The Impact Trends Such As High Preference For Case Ready Meals Augmenting Sales Of Active, Smart & Intelligent Packaging?
Educated and working-class consumers have witnessed a growing preference for case-ready meals in the last decade. According to independent research, the U.K. consumes nearly half of all the ready meals in Europe. This is attributed to the increasing preference among consumers in the region for supermarket offerings, rather than cooking from scratch.
This had paved the way for a new category of consumers who do not mind paying more for chilled dine-in deals rather than the erstwhile popular ‘frozen TV dinner’. Such shifts in consumer preferences create numerous opportunities for growth of the active, smart, and intelligent packaging market across the globe, especially, Modified Atmosphere Packaging (MAP).
Growing awareness among consumers regarding the ingredients used in a dish is expected to help shape the global active, smart, and intelligent packaging market, over the forecast period.
In addition, this has created opportunities for healthier and upmarket dishes containing less fat and salt. Furthermore, the active, smart, and intelligent packaging market across all the regions is expected to be driven by continuous product innovation by domestic and international manufacturers.
How Covid-19 Impacted Global Active, Smart & Intelligent Packaging Market?
The pandemic situation broke out due to the spread of the covid-19 virus, as a result, the federal governments imposed a lockdown to control the further spread of the virus among the people. The lockdown brought a standstill to all the manufacturing works and supply chains, only production of food & beverages along with medicinal supply was permitted.
The food & beverages along with the pharmaceutical sector being the largest consumers of active, smart & intelligent packaging the demand witnessed a minimal negative growth in the year in which the pandemic broke out. Moreover, in the subsequent year due to sharp rise in demand for pharmaceutical vaccines and supplies will ensure the expansion of globally active, smart & intelligent packaging over the forecasted period.
Get the data you need at a Fraction of the cost
Personalize your report by choosing insights you need
and save 40%!
Country-Wise Insights
Why is the U.S. considered as the Largest Market for Active, Smart & Intelligent Packaging across North America?
As per the study, the U.S. accounts for almost 4/5th of the total active, smart & intelligent packaging sold across North America in 2022. The presence of globally renowned packaging manufacturers in the country, along with millions spent by them each year on research & development of advanced packaging products, makes it the largest market across the region.
According to the United States Food Drug & Administration, food waste across the country is estimated to be 30% to 40% of the food supply. Growing awareness regarding eliminating food wastage along with the development of cutting-edge packaging to enhance product safety, along with keeping the freshness of the product intact. Thus, the aforementioned factors are expected to generate sizeable demand for active, smart & intelligent packaging across the U.S. in near future.
What Makes Germany The Largest Market for Active, Smart & Intelligent Packaging in Europe?
As per the European Federation of Pharmaceutical Industries and Association, each year Europe produces more than 1.7 billion vaccines, out of which Germany is the largest producer of pharmaceutical supplies in the region. The burgeoning growth witnessed by pharmaceutical drugs and vaccines produced in Germany fuels the demand for active, smart & intelligent packaging across the country.
The strict sanctions by the government for proper marking labelling of all types of medicinal drugs prevent the counterfeiting of drugs produced by pharmaceutical companies in the country. Thus, Germany is anticipated to hold almost 20% market share across Europe active, smart & intelligent packaging market in 2022.
Category-Wise Insights
What makes Active Packaging the most Popular Packaging Type across Global Active, Smart & Intelligent Packaging Market?
Exponentially rising market popularity of Modified Atmosphere Packaging across the globe, with several food & beverage manufacturers from small to large switching towards it. Along with that increased usage of Oxygen scavenging sachets to maintain the oxygen level in the package till it reaches the final consumer.
In addition to that food & beverage manufacturers from the developing parts of the world accept active packaging solutions as preferred packaging to satisfy the advanced needs of millennials. Thus, the global sales of active packaging products are expected to increase by US$ 7.2 billion between 2022 and 2027.
Why Active, Smart and Intelligent Packaging has Maximum Application across Food & Beverage Industry?
The outpouring demand for meat & poultry products across all parts of the world, along with intrinsic growth witnessed by the global dairy industry makes the food & beverage industry the largest end-use industry of the globally active, smart & intelligent packaging market. Along with that rising international trade of fruits & vegetables boosts the demand for preservative packaging.
The total market valuation of active, smart & intelligent packaging used in the food & beverage industry across the globe is expected to reach US$ 12 billion in 2022 and is anticipated to reach US$ 19.3 billion by 2027.
Why is North America Estimated to be the Largest Market for Active, Smart & Intelligent Packaging?
The globally renowned active, smart and intelligent packaging manufacturers situated in the region are projected to fuel the growth by the launch of innovative packaging solutions targeted to solve a specific problem faced by end-user industries. Along with that large number of manufacturers switching to cost-effective packaging aimed at prolonging the shelf-life of the product.
All the above-mentioned factors along with sales of active, smart & intelligent packaging to witness growth at 10.1% CAGR between 2022 and 2027 across the North American region.
Competitive Landscape
Globally renowned manufacturers across active, smart & intelligent packaging are eyeing to enter into strategic partnerships with major end use industries and focusing upon launching innovative packaging for satisfying modern day packaging needs:-
- In May 2021, Varcode Ltd. announced an agreement with Media Sourcery, Inc. to integrate its Smart Tag™ technology into cold chain solutions.
- In March 2021, Amcor announced a collaboration with JD Farm to jointly launch NFC (near field communication)-enabled packaging that will ensure more effective and interactive consumer engagement.
Scope Of Report
Attribute |
Details |
Forecast Period |
2022-2027 |
Historical Data Available for |
2012-2021 |
Market Analysis |
US$ Million for Value and Tonnes for Volume |
Key Regions Covered |
North America, Latin America, Western Europe, Eastern Europe, Asia Pacific, Middle East & Africa, Japan |
Key Countries Covered |
United States, Canada, Brazil, Mexico, Germany, Italy, France, U.K., Russia, Poland, China, India, Australia & New Zealand, GCC Countries, South Africa |
Key Segments Covered |
Packaging Type, Application and Region |
Key Companies Profiled |
|
Report Coverage |
Market Forecast, Company Share Analysis, Competition Intelligence, DROT Analysis, Market Dynamics and Challenges, and Strategic Growth Initiatives |
Customization & Pricing |
Available upon Request |
Global Active, Smart And Intelligent Packaging Market By Category
By Packaging Type :
- Active Packaging
- Oxygen Scavenging Sachets
- Modified Atmosphere Packaging (MAP)
- Smart & Intelligent Packaging
- Time & Temperature Indicator (TTI) Labels
- Freshness Indicators
- Radio Frequency Identification (RFID) Tags
By Application :
- Food & Beverage
- Meat, Poultry & Seafood
- Fruits & Vegetables
- Dairy Products
- Bakery & Confectionary
- Processed Food
- Others
- Pharmaceuticals
- Cosmetics
- Others
By Region :
- North America
- Latin America
- Western Europe
- Eastern Europe
- Asia Pacific
- Middle East and Africa (MEA)
- Japan
Frequently Asked Questions
What is the total value of the Global Active, Smart & Intelligent Packaging Market?
The global smart, active & intelligent packaging market is valued at US$ 27.1 Bn in 2022.
Which Region Accounts for Maximum sales of Active, Smart & Intelligent Packaging?
North America accounts for maximum sales of active, smart & intelligent packaging with sales of US$ 6.9 billion in 2022.
How big is Asia Pacific Active, Smart & Intelligent Packaging Market?
The Asia Pacific active, smart & intelligent packaging is estimated at US$ 4.7 billion in 2022 and expected to reach US$ 9.0 billion in 2027.
Which Companies are Leading Global Active, Smart & Intelligent Packaging Market?
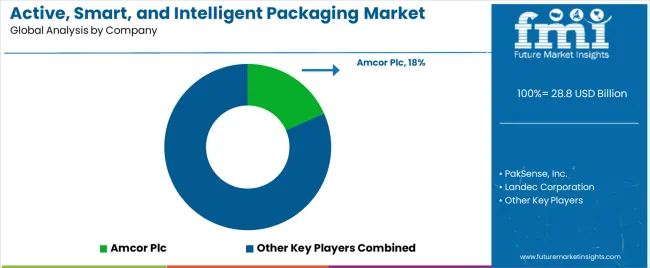
Major players across the global active, smart & intelligent packaging market are Paksence Inc., Landec Corporation, Sealed Air Corporation, Amcor Plc and 3M Company.
Which Countries are Leading Markets for Active, Smart & Intelligent Packaging?
Countries such as the U.S., Germany and China are top markets for active, smart & intelligent packaging.
Table of Content
1. Executive Summary 1.1. Global Market Overview 1.2. Market Analysis 1.3. Analysis and Recommendations 2. Market Overview 2.1. Market Definition 2.2. Market Coverage 3. Key Market Trends 3.1. Key Trends Impacting the Market 3.2. Product Innovation / Development Trends 4. Key Success Factors 4.1. Product Adoption / Usage Analysis 4.2. Product USPs / Features 5. Global Active, Smart, and Intelligent Packaging Market Demand Analysis 2012-2021 and Forecast, 2022-2027 5.1. Historical Market Volume (Tonnes) Analysis, 2012-2021 5.2. Current and Future Market Volume (Tonnes) Projections, 2022-2027 5.3. Y-o-Y Growth Trend Analysis 6. Global Active, Smart, and Intelligent Packaging Market - Pricing Analysis 6.1. Regional Pricing Analysis 6.2. Pricing Break-up 6.3. Global Average Pricing Analysis Benchmark 7. Global Active, Smart, and Intelligent Packaging Market Demand (US$ Mn) Analysis 2012-2021 and Forecast, 2022-2027 7.1. Historical Market Value (US$ Mn) Analysis, 2012-2021 7.2. Current and Future Market Value (US$ Mn) Projections, 2022-2027 7.2.1. Y-o-Y Growth Trend Analysis 7.2.2. Absolute $ Opportunity Analysis 8. Market Background 8.1. Global Packaging Market Overview 8.2. Global Flexible Packaging Market Overview 8.3. Global Food & Beverages Market Overview 8.4. Macro-Economic Factors & Co-relation Analysis 8.4.1. Global Packaging Machinery Industry Growth 8.4.2. Global Flexible Packaging Industry Growth 8.4.3. Global Food & Beverage Industry Growth 8.4.4. GDP Growth 8.4.5. COVID-19 Pandemic 8.5. Forecast Factors - Relevance & Impact 8.5.1. Global Pharmaceuticals Market Growth 8.5.2. Global Cosmetics Market Outlook 8.5.3. Global Retail & E-commerce Sector Growth 8.5.4. Global Labels Market Growth 8.5.5. Segmental Revenue Growth of Key Players 8.6. Value Chain Analysis 8.6.1. Key Participants 8.6.1.1. Raw Material Suppliers 8.6.1.2. Active, Smart, and Intelligent Packaging Manufacturers 8.6.1.3. End Use Industry 8.6.2. Profitability Margin 8.7. Market Dynamics 8.7.1. Drivers 8.7.2. Restraints 8.7.3. Opportunity Analysis 9. Impact of COVID-19 9.1. Current Statistics and Probable Future Impact 9.2. Impact of COVID-19 on Active, Smart, and Intelligent Packaging Market 10. Global Active, Smart, and Intelligent Packaging Market Analysis 2012-2021 and Forecast 2022-2027, By Packaging Type 10.1. Introduction 10.2. Historical Market Size (US$ Mn) and Volume (Tonnes) Analysis, By Packaging Type, 2012-2021 10.3. Current and Future Market Size (US$ Mn) and Volume (Tonnes) Analysis and Forecast, By Packaging Type, 2022-2027 10.3.1. Active Packaging 10.3.1.1. O2 Scavenging Sachets 10.3.1.2. MAP 10.3.2. Smart & Intelligent Packaging 10.3.2.1. TTI Labels 10.3.2.2. Freshness Indicators 10.3.2.3. RFID Tags 10.4. Market Attractiveness Analysis, By Packaging Type 11. Global Active, Smart, and Intelligent Packaging Market Analysis 2012-2021 and Forecast 2022-2027, By Application 11.1. Introduction 11.2. Historical Market Size (US$ Mn) and Volume (Tonnes) Analysis, By Application, 2012-2021 11.3. Current and Future Market Size (US$ Mn) and Volume (Tonnes) Analysis and Forecast, By Application, 2022-2027 11.3.1. Food & Beverage 11.3.1.1. Meat, Poultry & Seafood 11.3.1.2. Fruits & Vegetables 11.3.1.3. Dairy Products 11.3.1.4. Bakery & Confectionary 11.3.1.5. Processed Food 11.3.1.6. Others 11.3.2. Pharmaceuticals 11.3.3. Cosmetics 11.3.4. Others 11.4. Market Attractiveness Analysis, By Application 12. Global Active, Smart, and Intelligent Packaging Market Analysis 2012-2021 and Forecast 2022-2027, By Region 12.1. Introduction 12.2. Historical Market Size (US$ Mn) and Volume (Tonnes) Analysis, by Region, 2012-2021 12.3. Current Market Size (US$ Mn) and Volume (Tonnes) Analysis and Forecast, by Region, 2022-2027 12.3.1. North America 12.3.2. Latin America 12.3.3. Western Europe 12.3.4. Eastern Europe 12.3.5. Asia Pacific (APAC) 12.3.6. Japan 12.3.7. Middle East and Africa (MEA) 12.4. Market Attractiveness Analysis, by Region 13. North America Active, Smart, and Intelligent Packaging Market Analysis 2012-2021 and Forecast 2022-2027 13.1. Introduction 13.2. Historical Market Size (US$ Mn) and Volume (Tonnes) Trend Analysis, by Market Taxonomy, 2012-2021 13.3. Market Size (US$ Mn) and Volume (Tonnes) Forecast, by Market Taxonomy, 2022-2027 13.3.1. By Country 13.3.1.1. U.S. 13.3.1.2. Canada 13.3.2. By Packaging Type 13.3.3. By Application 13.4. Market Attractiveness Analysis 13.4.1. By Country 13.4.2. By Packaging Type 13.4.3. By Application 14. Latin America Active, Smart, and Intelligent Packaging Market Analysis 2012-2021 and Forecast 2022-2027 14.1. Introduction 14.2. Historical Market Size (US$ Mn) and Volume (Tonnes) Trend Analysis, by Market Taxonomy, 2012-2021 14.3. Market Size (US$ Mn) and Volume (Tonnes) Forecast, by Market Taxonomy, 2022-2027 14.3.1. By Country 14.3.1.1. Brazil 14.3.1.2. Mexico 14.3.1.3. Rest of Latin America 14.3.2. By Packaging Type 14.3.3. By Application 14.4. Market Attractiveness Analysis 14.4.1. By Country 14.4.2. By Packaging Type 14.4.3. By Application 15. Western Europe Active, Smart, and Intelligent Packaging Market Analysis 2012-2021 and Forecast 2022-2027 15.1. Introduction 15.2. Historical Market Size (US$ Mn) and Volume (Tonnes) Trend Analysis, by Market Taxonomy, 2012-2021 15.3. Market Size (US$ Mn) and Volume (Tonnes) Forecast, by Market Taxonomy, 2022-2027 15.3.1. By Country 15.3.1.1. Germany 15.3.1.2. Italy 15.3.1.3. France 15.3.1.4. Spain 15.3.1.5. U.K. 15.3.1.6. BENELUX 15.3.1.7. Rest of Western Europe 15.3.2. By Packaging Type 15.3.3. By Application 15.4. Market Attractiveness Analysis 15.4.1. By Country 15.4.2. By Packaging Type 15.4.3. By Application 16. Eastern Europe Active, Smart, and Intelligent Packaging Market Analysis 2012-2021 and Forecast 2022-2027 16.1. Introduction 16.2. Historical Market Size (US$ Mn) and Volume (Tonnes) Trend Analysis, by Market Taxonomy, 2012-2021 16.3. Market Size (US$ Mn) and Volume (Tonnes) Forecast, by Market Taxonomy, 2022-2027 16.3.1. By Country 16.3.1.1. Russia 16.3.1.2. Poland 16.3.1.3. Rest of Eastern Europe 16.3.2. By Packaging Type 16.3.3. By Application 16.4. Market Attractiveness Analysis 16.4.1. By Country 16.4.2. By Packaging Type 16.4.3. By Application 17. Asia Pacific (APAC) Active, Smart, and Intelligent Packaging Market Analysis 2012-2021 and Forecast 2022-2027 17.1. Introduction 17.2. Historical Market Size (US$ Mn) and Volume (Tonnes) Trend Analysis, by Market Taxonomy, 2012-2021 17.3. Market Size (US$ Mn) and Volume (Tonnes) Forecast, by Market Taxonomy, 2022-2027 17.3.1. By Country 17.3.1.1. China 17.3.1.2. India 17.3.1.3. ASEAN 17.3.1.4. Australia & New Zealand 17.3.1.5. Rest of Asia Pacific (APAC) 17.3.2. By Packaging Type 17.3.3. By Application 17.4. Market Attractiveness Analysis 17.4.1. By Country 17.4.2. By Packaging Type 17.4.3. By Application 18. Japan Active, Smart, and Intelligent Packaging Market Analysis 2012-2021 and Forecast 2022-2027 18.1. Introduction 18.2. Historical Market Size (US$ Mn) and Volume (Tonnes) Trend Analysis, by Market Taxonomy, 2012-2021 18.3. Market Size (US$ Mn) and Volume (Tonnes) Forecast, by Market Taxonomy, 2022-2027 18.3.1. By Packaging Type 18.3.2. By Application 18.4. Market Attractiveness Analysis 18.4.1. By Packaging Type 18.4.2. By Application 19. Middle East and Africa Active, Smart, and Intelligent Packaging Market Analysis 2012-2021 and Forecast 2022-2027 19.1. Introduction 19.2. Historical Market Size (US$ Mn) and Volume (Tonnes) Trend Analysis, by Market Taxonomy, 2012-2021 19.3. Market Size (US$ Mn) and Volume (Tonnes) Forecast, by Market Taxonomy, 2022-2027 19.3.1. By Country 19.3.1.1. GCC Countries 19.3.1.2. South Africa 19.3.1.3. Northern Africa 19.3.1.4. Turkey 19.3.1.5. Rest of Middle East and Africa 19.3.2. By Packaging Type 19.3.3. By Application 19.4. Market Attractiveness Analysis 19.4.1. By Country 19.4.2. By Packaging Type 19.4.3. By Application 20. Active, Smart, and Intelligent Packaging Market Country wise Analysis 2022 & 2027 20.1. U.S. Active, Smart, and Intelligent Packaging Market Analysis 20.1.1. Market Volume (Tonnes) and Value (US$ Mn) Analysis and Forecast, by Market Taxonomy 20.1.1.1. By Packaging Type 20.1.1.2. By Application 20.2. Canada Active, Smart, and Intelligent Packaging Market Analysis 20.2.1. Market Volume (Tonnes) and Value (US$ Mn) Analysis and Forecast, by Market Taxonomy 20.2.1.1. By Packaging Type 20.2.1.2. By Application 20.3. Brazil Active, Smart, and Intelligent Packaging Market Analysis 20.3.1. Market Volume (Tonnes) and Value (US$ Mn) Analysis and Forecast, by Market Taxonomy 20.3.1.1. By Packaging Type 20.3.1.2. By Application 20.4. Mexico Active, Smart, and Intelligent Packaging Market Analysis 20.4.1. Market Volume (Tonnes) and Value (US$ Mn) Analysis and Forecast, by Market Taxonomy 20.4.1.1. By Packaging Type 20.4.1.2. By Application 20.5. Germany Active, Smart, and Intelligent Packaging Market Analysis 20.5.1. Market Volume (Tonnes) and Value (US$ Mn) Analysis and Forecast, by Market Taxonomy 20.5.1.1. By Packaging Type 20.5.1.2. By Application 20.6. Italy Active, Smart, and Intelligent Packaging Market Analysis 20.6.1. Market Volume (Tonnes) and Value (US$ Mn) Analysis and Forecast, by Market Taxonomy 20.6.1.1. By Packaging Type 20.6.1.2. By Application 20.7. France Active, Smart, and Intelligent Packaging Market Analysis 20.7.1. Market Volume (Tonnes) and Value (US$ Mn) Analysis and Forecast, by Market Taxonomy 20.7.1.1. By Packaging Type 20.7.1.2. By Application 20.8. U.K. Active, Smart, and Intelligent Packaging Market Analysis 20.8.1. Market Volume (Tonnes) and Value (US$ Mn) Analysis and Forecast, by Market Taxonomy 20.8.1.1. By Packaging Type 20.8.1.2. By Application 20.9. Russia Active, Smart, and Intelligent Packaging Market Analysis 20.9.1. Market Volume (Tonnes) and Value (US$ Mn) Analysis and Forecast, by Market Taxonomy 20.9.1.1. By Packaging Type 20.9.1.2. By Application 20.10. Poland Active, Smart, and Intelligent Packaging Market Analysis 20.10.1. Market Volume (Tonnes) and Value (US$ Mn) Analysis and Forecast, by Market Taxonomy 20.10.1.1. By Packaging Type 20.10.1.2. By Application 20.11. China Active, Smart, and Intelligent Packaging Market Analysis 20.11.1. Market Volume (Tonnes) and Value (US$ Mn) Analysis and Forecast, by Market Taxonomy 20.11.1.1. By Packaging Type 20.11.1.2. By Application 20.12. India Active, Smart, and Intelligent Packaging Market Analysis 20.12.1. Market Volume (Tonnes) and Value (US$ Mn) Analysis and Forecast, by Market Taxonomy 20.12.1.1. By Packaging Type 20.12.1.2. By Application 20.13. Australia & New Zealand Active, Smart, and Intelligent Packaging Market Analysis 20.13.1. Market Volume (Tonnes) and Value (US$ Mn) Analysis and Forecast, by Market Taxonomy 20.13.1.1. By Packaging Type 20.13.1.2. By Application 20.14. GCC Countries Active, Smart, and Intelligent Packaging Market Analysis 20.14.1. Market Volume (Tonnes) and Value (US$ Mn) Analysis and Forecast, by Market Taxonomy 20.14.1.1. By Packaging Type 20.14.1.2. By Application 20.15. South Africa Active, Smart, and Intelligent Packaging Market Analysis 20.15.1. Market Volume (Tonnes) and Value (US$ Mn) Analysis and Forecast, by Market Taxonomy 20.15.1.1. By Packaging Type 20.15.1.2. By Application 21. Market Structure Analysis 21.1. Market Analysis, by Tier of Active, Smart, and Intelligent Packaging Companies 21.2. Market Share Analysis of Top Players 21.3. Market Presence Analysis 21.3.1. By Operating Regions 21.3.2. By Product Portfolio 22. Competition Analysis 22.1. Competition Dashboard 22.2. Competition Benchmarking 22.3. Competition Deep Dive 22.3.1. PakSense, Inc. 22.3.1.1. Overview 22.3.1.2. Product Portfolio 22.3.1.3. Profitability by Market Segments 22.3.1.4. Sales Footprint 22.3.1.5. Strategy Overview 22.3.1.5.1. Marketing Strategy 22.3.1.5.2. Product Strategy 22.3.1.5.3. Channel Strategy 22.3.2. Landec Corporation 22.3.2.1. Overview 22.3.2.2. Product Portfolio 22.3.2.3. Profitability by Market Segments 22.3.2.4. Sales Footprint 22.3.2.5. Strategy Overview 22.3.2.5.1. Marketing Strategy 22.3.2.5.2. Product Strategy 22.3.2.5.3. Channel Strategy 22.3.3. Sealed Air Corporation 22.3.3.1. Overview 22.3.3.2. Product Portfolio 22.3.3.3. Profitability by Market Segments 22.3.3.4. Sales Footprint 22.3.3.5. Strategy Overview 22.3.3.5.1. Marketing Strategy 22.3.3.5.2. Product Strategy 22.3.3.5.3. Channel Strategy 22.3.4. Crown Holdings, Inc. 22.3.4.1. Overview 22.3.4.2. Product Portfolio 22.3.4.3. Profitability by Market Segments 22.3.4.4. Sales Footprint 22.3.4.5. Strategy Overview 22.3.4.5.1. Marketing Strategy 22.3.4.5.2. Product Strategy 22.3.4.5.3. Channel Strategy 22.3.5. Amcor Plc 22.3.5.1. Overview 22.3.5.2. Product Portfolio 22.3.5.3. Profitability by Market Segments 22.3.5.4. Sales Footprint 22.3.5.5. Strategy Overview 22.3.5.5.1. Marketing Strategy 22.3.5.5.2. Product Strategy 22.3.5.5.3. Channel Strategy 22.3.6. 3M Company 22.3.6.1. Overview 22.3.6.2. Product Portfolio 22.3.6.3. Profitability by Market Segments 22.3.6.4. Sales Footprint 22.3.6.5. Strategy Overview 22.3.6.5.1. Marketing Strategy 22.3.6.5.2. Product Strategy 22.3.6.5.3. Channel Strategy 22.3.7. Timestrip UK Ltd. 22.3.7.1. Overview 22.3.7.2. Product Portfolio 22.3.7.3. Profitability by Market Segments 22.3.7.4. Sales Footprint 22.3.7.5. Strategy Overview 22.3.7.5.1. Marketing Strategy 22.3.7.5.2. Product Strategy 22.3.7.5.3. Channel Strategy 22.3.8. Cryolog S.A. 22.3.8.1. Overview 22.3.8.2. Product Portfolio 22.3.8.3. Profitability by Market Segments 22.3.8.4. Sales Footprint 22.3.8.5. Strategy Overview 22.3.8.5.1. Marketing Strategy 22.3.8.5.2. Product Strategy 22.3.8.5.3. Channel Strategy 22.3.9. Vitsab International AB 22.3.9.1. Overview 22.3.9.2. Product Portfolio 22.3.9.3. Profitability by Market Segments 22.3.9.4. Sales Footprint 22.3.9.5. Strategy Overview 22.3.9.5.1. Marketing Strategy 22.3.9.5.2. Product Strategy 22.3.9.5.3. Channel Strategy 22.3.10. Varcode, Ltd. 22.3.10.1. Overview 22.3.10.2. Product Portfolio 22.3.10.3. Profitability by Market Segments 22.3.10.4. Sales Footprint 22.3.10.5. Strategy Overview 22.3.10.5.1. Marketing Strategy 22.3.10.5.2. Product Strategy 22.3.10.5.3. Channel Strategy 22.3.11. LCR Hallcrest LLC 22.3.11.1. Overview 22.3.11.2. Product Portfolio 22.3.11.3. Profitability by Market Segments 22.3.11.4. Sales Footprint 22.3.11.5. Strategy Overview 22.3.11.5.1. Marketing Strategy 22.3.11.5.2. Product Strategy 22.3.11.5.3. Channel Strategy 22.3.12. Thin Film Electronics ASA 22.3.12.1. Overview 22.3.12.2. Product Portfolio 22.3.12.3. Profitability by Market Segments 22.3.12.4. Sales Footprint 22.3.12.5. Strategy Overview 22.3.12.5.1. Marketing Strategy 22.3.12.5.2. Product Strategy 22.3.12.5.3. Channel Strategy 22.3.13. CCL Industries Inc. 22.3.13.1. Overview 22.3.13.2. Product Portfolio 22.3.13.3. Profitability by Market Segments 22.3.13.4. Sales Footprint 22.3.13.5. Strategy Overview 22.3.13.5.1. Marketing Strategy 22.3.13.5.2. Product Strategy 22.3.13.5.3. Channel Strategy 22.3.14. Temptime Corporation 22.3.14.1. Overview 22.3.14.2. Product Portfolio 22.3.14.3. Profitability by Market Segments 22.3.14.4. Sales Footprint 22.3.14.5. Strategy Overview 22.3.14.5.1. Marketing Strategy 22.3.14.5.2. Product Strategy 22.3.14.5.3. Channel Strategy 22.3.15. Multisorb Technologies, Inc. 22.3.15.1. Overview 22.3.15.2. Product Portfolio 22.3.15.3. Profitability by Market Segments 22.3.15.4. Sales Footprint 22.3.15.5. Strategy Overview 22.3.15.5.1. Marketing Strategy 22.3.15.5.2. Product Strategy 22.3.15.5.3. Channel Strategy 22.3.16. Coveris Holdings S.A. 22.3.16.1. Overview 22.3.16.2. Product Portfolio 22.3.16.3. Profitability by Market Segments 22.3.16.4. Sales Footprint 22.3.16.5. Strategy Overview 22.3.16.5.1. Marketing Strategy 22.3.16.5.2. Product Strategy 22.3.16.5.3. Channel Strategy 23. Assumptions and Acronyms Used 24. Research Methodology
Don't pay for what you don't need
Customize your report by selecting specific countries or regions and save 30%!
List of Tables
Table 01: Global Active, Smart, and Intelligent Packaging Market Value (US$ Mn) Analysis, by Packaging Type, 2012H-2027F Table 02: Global Active, Smart, and Intelligent Packaging Market Volume (Units) Analysis, by Packaging Type, 2012H-2027F Table 03: Global Active, Smart, and Intelligent Packaging Market Value (US$ Mn) Analysis, by Application, 2012H-2027F Table 04: Global Active, Smart, and Intelligent Packaging Market Volume (Units) Analysis, by Application, 2012H-2027F Table 05: Global Active, Smart, and Intelligent Packaging Market Value (US$ Mn) Analysis, by Region, 2012H-2027F Table 06: Global Active, Smart, and Intelligent Packaging Market Volume (Units) Analysis, by Region, 2012H-2027F Table 07: North America Active, Smart, and Intelligent Packaging Market Value (US$ Mn) Analysis, by Packaging Type, 2012H-2027F Table 08: North America Active, Smart, and Intelligent Packaging Market Volume (Units) Analysis, by Packaging Type, 2012H-2027F Table 09: North America Active, Smart, and Intelligent Packaging Market Value (US$ Mn) Analysis, by Application, 2012H-2027F Table 10: North America Active, Smart, and Intelligent Packaging Market Volume (Units) Analysis, by Application, 2012H-2027F Table 11: North America Active, Smart, and Intelligent Packaging Market Value (US$ Mn) Analysis, by Country, 2012H-2027F Table 12: North America Active, Smart, and Intelligent Packaging Market Volume (Units) Analysis, by Country, 2012H-2027F Table 13: Latin America Active, Smart, and Intelligent Packaging Market Value (US$ Mn) Analysis, by Packaging Type, 2012H-2027F Table 14: Latin America Active, Smart, and Intelligent Packaging Market Volume (Units) Analysis, by Packaging Type, 2012H-2027F Table 15: Latin America Active, Smart, and Intelligent Packaging Market Value (US$ Mn) Analysis, by Application, 2012H-2027F Table 16: Latin America Active, Smart, and Intelligent Packaging Market Volume (Units) Analysis, by Application, 2012H-2027F Table 17: Latin America Active, Smart, and Intelligent Packaging Market Value (US$ Mn) Analysis, by Country, 2012H-2027F Table 18: Latin America Active, Smart, and Intelligent Packaging Market Volume (Units) Analysis, by Country, 2012H-2027F Table 19: Western Europe Active, Smart, and Intelligent Packaging Market Value (US$ Mn) Analysis, by Packaging Type, 2012H-2027F Table 20: Western Europe Active, Smart, and Intelligent Packaging Market Volume (Units) Analysis, by Packaging Type, 2012H-2027F Table 21: Western Europe Active, Smart, and Intelligent Packaging Market Value (US$ Mn) Analysis, by Application, 2012H-2027F Table 22: Western Europe Active, Smart, and Intelligent Packaging Market Volume (Units) Analysis, by Application, 2012H-2027F Table 23: Western Europe Active, Smart, and Intelligent Packaging Market Value (US$ Mn) Analysis, by Country, 2012H-2027F Table 24: Western Europe Active, Smart, and Intelligent Packaging Market Volume (Units) Analysis, by Country, 2012H-2027F Table 25: Eastern Europe Active, Smart, and Intelligent Packaging Market Value (US$ Mn) Analysis, by Packaging Type, 2012H-2027F Table 26: Eastern Europe Active, Smart, and Intelligent Packaging Market Volume (Units) Analysis, by Packaging Type, 2012H-2027F Table 27: Eastern Europe Active, Smart, and Intelligent Packaging Market Value (US$ Mn) Analysis, by Application, 2012H-2027F Table 28: Eastern Europe Active, Smart, and Intelligent Packaging Market Volume (Units) Analysis, by Application, 2012H-2027F Table 29: Eastern Europe Active, Smart, and Intelligent Packaging Market Value (US$ Mn) Analysis, by Country, 2012H-2027F Table 30: Eastern Europe Active, Smart, and Intelligent Packaging Market Volume (Units) Analysis, by Country, 2012H-2027F Table 31: APAC Active, Smart, and Intelligent Packaging Market Value (US$ Mn) Analysis, by Packaging Type, 2012H-2027F Table 32: APAC Active, Smart, and Intelligent Packaging Market Volume (Units) Analysis, by Packaging Type, 2012H-2027F Table 33: APAC Active, Smart, and Intelligent Packaging Market Value (US$ Mn) Analysis, by Application, 2012H-2027F Table 34: APAC Active, Smart, and Intelligent Packaging Market Volume (Units) Analysis, by Application, 2012H-2027F Table 35: APAC Active, Smart, and Intelligent Packaging Market Value (US$ Mn) Analysis, by Country, 2012H-2027F Table 36: APAC Active, Smart, and Intelligent Packaging Market Volume (Units) Analysis, by Country, 2012H-2027F Table 37: Japan Active, Smart, and Intelligent Packaging Market Value (US$ Mn) Analysis, by Packaging Type, 2012H-2027F Table 38: Japan Active, Smart, and Intelligent Packaging Market Volume (Units) Analysis, by Packaging Type, 2012H-2027F Table 39: Japan Active, Smart, and Intelligent Packaging Market Value (US$ Mn) Analysis, by Application, 2012H-2027F Table 40: Japan Active, Smart, and Intelligent Packaging Market Volume (Units) Analysis, by Application, 2012H-2027F Table 41: MEA Active, Smart, and Intelligent Packaging Market Value (US$ Mn) Analysis, by Packaging Type, 2012H-2027F Table 42: MEA Active, Smart, and Intelligent Packaging Market Volume (Units) Analysis, by Packaging Type, 2012H-2027F Table 43: MEA Active, Smart, and Intelligent Packaging Market Value (US$ Mn) Analysis, by Application, 2012H-2027F Table 44: MEA Active, Smart, and Intelligent Packaging Market Volume (Units) Analysis, by Application, 2012H-2027F Table 45: MEA Active, Smart, and Intelligent Packaging Market Value (US$ Mn) Analysis, by Country, 2012H-2027F Table 46: MEA Active, Smart, and Intelligent Packaging Market Volume (Units) Analysis, by Country, 2012H-2027F
List of Charts
Figure 01: Global Active, Smart, and Intelligent Packaging Market Share Analysis by Packaging Type, 2022E & 2027F Figure 02: Global Active, Smart, and Intelligent Packaging Market Y-o-Y Analysis by Packaging Type, 2019H-2027F Figure 03: Global Active, Smart, and Intelligent Packaging Market Attractiveness Analysis by Packaging Type, 2022E-2027F Figure 04: Global Active, Smart, and Intelligent Packaging Market Share Analysis by Application, 2022E & 2027F Figure 05: Global Active, Smart, and Intelligent Packaging Market Y-o-Y Analysis by Application, 2019H-2027F Figure 06: Global Active, Smart, and Intelligent Packaging Market Attractiveness Analysis by Application, 2022E-2027F Figure 07: Global Active, Smart, and Intelligent Packaging Market Share Analysis by Region, 2022E & 2027F Figure 08: Global Active, Smart, and Intelligent Packaging Market Y-o-Y Analysis by Region, 2019H-2027F Figure 09: Global Active, Smart, and Intelligent Packaging Market Attractiveness Analysis by Region, 2022E-2027F Figure 10: North America Active, Smart, and Intelligent Packaging Market Share Analysis by Packaging Type, 2022E & 2027F Figure 11: North America Active, Smart, and Intelligent Packaging Market Share Analysis by Application 2022(E) Figure 12: North America Active, Smart, and Intelligent Packaging Market Value Share Analysis by Country 2022(E) Figure 13: Latin America Active, Smart, and Intelligent Packaging Market Share Analysis by Packaging Type, 2022E & 2027F Figure 14: Latin America Active, Smart, and Intelligent Packaging Market Share Analysis by Application 2022(E) Figure 15: Latin America Active, Smart, and Intelligent Packaging Market Value Share Analysis by Country 2022(E) Figure 16: Western Europe Active, Smart, and Intelligent Packaging Market Share Analysis by Packaging Type, 2022E & 2027F Figure 17: Western Europe Active, Smart, and Intelligent Packaging Market Share Analysis by Application 2022(E) Figure 18: Western Europe Active, Smart, and Intelligent Packaging Market Value Share Analysis by Country 2022(E) Figure 19: Eastern Europe Active, Smart, and Intelligent Packaging Market Share Analysis by Packaging Type, 2022E & 2027F Figure 20: Eastern Europe Active, Smart, and Intelligent Packaging Market Share Analysis by Application 2022(E) Figure 21: Eastern Europe Active, Smart, and Intelligent Packaging Market Value Share Analysis by Country 2022(E) Figure 22: APAC Active, Smart, and Intelligent Packaging Market Share Analysis by Packaging Type, 2022E & 2027F Figure 23: APAC Active, Smart, and Intelligent Packaging Market Share Analysis by Application 2022(E) Figure 24: APAC Active, Smart, and Intelligent Packaging Market Value Share Analysis by Country 2022(E) Figure 25: Japan Active, Smart, and Intelligent Packaging Market Share Analysis by Packaging Type, 2022E & 2027F Figure 26: Japan Active, Smart, and Intelligent Packaging Market Share Analysis by Application 2022(E) Figure 27: MEA Active, Smart, and Intelligent Packaging Market Share Analysis by Packaging Type, 2022E & 2027F Figure 28: MEA Active, Smart, and Intelligent Packaging Market Share Analysis by Application 2022(E) Figure 29: MEA Active, Smart, and Intelligent Packaging Market Value Share Analysis by Country 2022(E) Figure 30: U.S. Active, Smart, and Intelligent Packaging Market Value Share Analysis, by Packaging Type, 2022(E) & 2027(F) Figure 31: U.S. Active, Smart, and Intelligent Packaging Market Value Share Analysis, by Application, 2022(E) Figure 32: Canada Active, Smart, and Intelligent Packaging Market Value Share Analysis, by Packaging Type, 2022(E) & 2027(F) Figure 33: Canada Active, Smart, and Intelligent Packaging Market Value Share Analysis, by Application, 2022(E) Figure 34: Brazil Active, Smart, and Intelligent Packaging Market Value Share Analysis, by Packaging Type, 2022(E) & 2027(F) Figure 35: Brazil Active, Smart, and Intelligent Packaging Market Value Share Analysis, by Application, 2022(E) Figure 36: Mexico Active, Smart, and Intelligent Packaging Market Value Share Analysis, by Packaging Type, 2022(E) & 2027(F) Figure 37: Mexico Active, Smart, and Intelligent Packaging Market Value Share Analysis, by Application, 2022(E) Figure 38: Germany Active, Smart, and Intelligent Packaging Market Value Share Analysis, by Packaging Type, 2022(E) & 2027(F) Figure 39: Germany Active, Smart, and Intelligent Packaging Market Value Share Analysis, by Application, 2022(E) Figure 40: Italy Active, Smart, and Intelligent Packaging Market Value Share Analysis, by Packaging Type, 2022(E) & 2027(F) Figure 41: Italy Active, Smart, and Intelligent Packaging Market Value Share Analysis, by Application, 2022(E) Figure 42: France Active, Smart, and Intelligent Packaging Market Value Share Analysis, by Packaging Type, 2022(E) & 2027(F) Figure 43: France Active, Smart, and Intelligent Packaging Market Value Share Analysis, by Application, 2022(E) Figure 44: UK Active, Smart, and Intelligent Packaging Market Value Share Analysis, by Packaging Type, 2022(E) & 2027(F) Figure 45: UK Active, Smart, and Intelligent Packaging Market Value Share Analysis, by Application, 2022(E) Figure 46: Russia Active, Smart, and Intelligent Packaging Market Value Share Analysis, by Packaging Type, 2022(E) & 2027(F) Figure 47: Russia Active, Smart, and Intelligent Packaging Market Value Share Analysis, by Application, 2022(E) Figure 48: Poland Active, Smart, and Intelligent Packaging Market Value Share Analysis, by Packaging Type, 2022(E) & 2027(F) Figure 49: Poland Active, Smart, and Intelligent Packaging Market Value Share Analysis, by Application, 2022(E) Figure 50: China Active, Smart, and Intelligent Packaging Market Value Share Analysis, by Packaging Type, 2022(E) & 2027(F) Figure 51: China Active, Smart, and Intelligent Packaging Market Value Share Analysis, by Application, 2022(E) Figure 52: India Active, Smart, and Intelligent Packaging Market Value Share Analysis, by Packaging Type, 2022(E) & 2027(F) Figure 53: India Active, Smart, and Intelligent Packaging Market Value Share Analysis, by Application, 2022(E) Figure 54: Australia & New Zealand Active, Smart, and Intelligent Packaging Market Value Share Analysis, by Packaging Type, 2022(E) & 2027(F) Figure 55: Australia & New Zealand Active, Smart, and Intelligent Packaging Market Value Share Analysis, by Application, 2022(E) Figure 56: GCC Countries Active, Smart, and Intelligent Packaging Market Value Share Analysis, by Packaging Type, 2022(E) & 2027(F) Figure 57: GCC Countries Active, Smart, and Intelligent Packaging Market Value Share Analysis, by Application, 2022(E) Figure 58: South Africa Active, Smart, and Intelligent Packaging Market Value Share Analysis, by Packaging Type, 2022(E) & 2027(F) Figure 59: South Africa Active, Smart, and Intelligent Packaging Market Value Share Analysis, by Application, 2022(E)
Recommendations
Explore Packaging Insights
View Reports