Fungicide Active Ingredients Market Size, Share, and Forecast Outlook 2025 to 2035

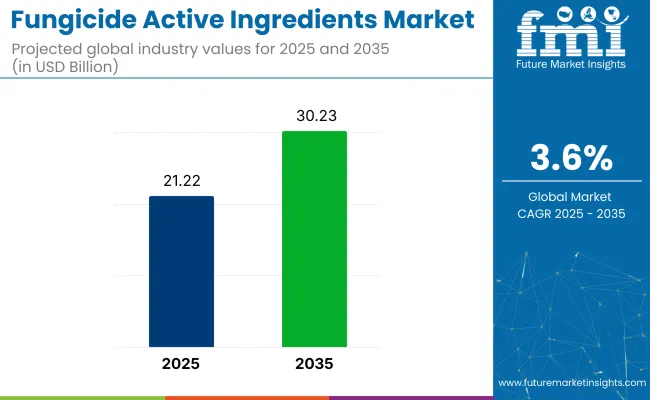
Fungicide Active Ingredients Market revenue is forecast to advance from USD 21.22 billion in 2025 to USD 30.23 billion by 2035, translating into a 3.6% CAGR for the period. Demand has been shaped by stricter residue‐limit enforcement and the widening adoption of integrated pest-management schemes that prioritise crop-specific efficacy.
Quick Stats for Fungicide Active Ingredients Market

  • Market value (2025): USD 21.22 billion
  • Forecast value (2035): USD 30.23 billion
  • Forecast CAGR (2025 - 2035): 3.6%
  • Leading segment in 2035: Systematic fungicides (≈ 39% share)
  • Key growth region: Asia Pacific
  • Leading country: India (CAGR 5.8%)
  • Key players: BASF SE; Syngenta Group; Certis USA LLC; Bayer Crop Science; Nissan Chemical Corporation; Nufarm

Fungicide Active Ingredients Market

Metric Value
Industry Size (2025E) USD 21.22 billion
Industry Value (2035F) USD 30.23 billion
CAGR (2025 to 2035) 3.6%

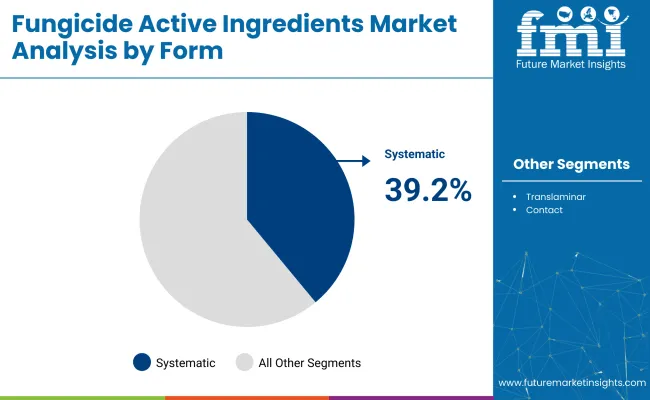
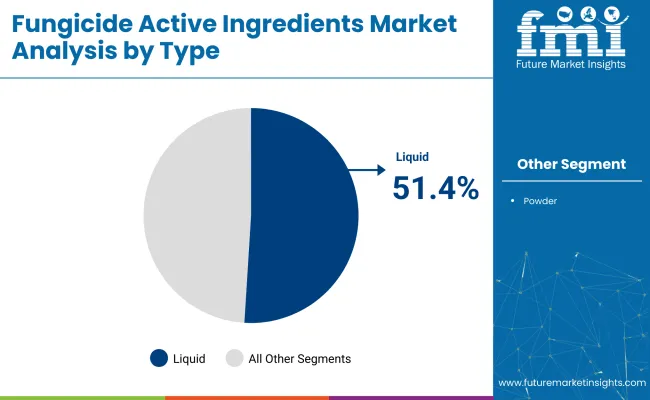
Systematic fungicides, projected at 39.2% share, have been chosen for their xylem mobility and season-long protection against vascular pathogens. Liquid formulations are set to hold 51.4% share owing to simplified tank-mixing and compatibility with drone and electrostatic spray systems.

Process efficiencies have been raised through continuous-flow synthesis, which lowers solvent demand and shortens reaction times when manufacturing triazoles and strobilurins. Micro-encapsulation techniques have reduced active-ingredient loss, permitting lower field rates while maintaining lesion-suppression thresholds. Large-volume production has been underpinned by multipurpose plants equipped with automated cleaning protocols that minimise downtime between chemistry campaigns.

Gilboa was launched by ADAMA UK. It is a novel mode-of-action molecule, that delivers control of septoria, rusts, and powdery mildew in cereals and oilseed rape, integrating with existing actives to slow resistance, enhance grain quality, profitability across variable weather seasons.

The fungicide active ingredients market holds specific shares within its parent markets. In the agricultural chemicals market, it accounts for around 10-12%, as fungicides are essential for crop protection alongside other chemicals like herbicides and insecticides. Within the crop protection market, the share is approximately 20-25%, driven by the vital role fungicides play in managing plant diseases.

In the pesticide market, the share is about 15-18%, with fungicides being a significant component of the broader pesticide category. The biopesticide market contributes around 5-7%, with bio-based fungicides gaining attention. In the fine chemicals market, the share is around 3-4%, as fungicide active ingredients are classified under specialized fine chemicals for agricultural use.

Analysing Fungicide Active Ingredients Market by Top Investment Segments

Systemic chemistries, liquid formulations, azoxystrobin products, and agricultural deployments together concentrate more than 70% of 2025 fungicide-ingredient revenue. Their popularity has been driven by resistance-management mandates, simplified logistics, and crop-yield preservation standards set by major global grain merchants and input distributors.

Systemic Chemistries Anchor Broad Spectrum Protection Across Crops

Systemic fungicides are projected to secure a 39.2% share of 2024 demand, since xylem-mobile molecules distribute internally and resist wash-off during peak rainfall windows. Crop-science divisions from BASF and UPL have prioritised triazole-strobilurin co-formulations to prolong curative intervals while meeting residue-tolerance rules in export markets.
  • BASF’s Revysol portfolio has been positioned for leaf-rust control under shortened pre-harvest intervals.
  • Group-code rotation programmes recommended by Syngenta advisers lower resistance-gene expression in Z. tritici populations.
  • Uniform canopy coverage is obtained through oil-dispersion adjuvants that reduce bounce-off on waxy cereal leaves.

Fungicide Active Ingredients Market Analysis By Form

Liquid Formulations Enhance Field Mixing Efficiency Metrics

A 51.4% revenue share is expected to be held by liquid fungicides, because flowable suspensions ease closed-transfer system adoption at large custom-application co-ops. Viscosity has been standardised near 700 cP, allowing metering pumps on 3,000-litre nurse tanks to dose precisely without shear-induced settling.
  • Corteva has expanded toll-blending capacity in Iowa to meet contract-packer demand for low-dust SC concentrates.
  • Faster agitation times improve tender-truck turnaround, shortening application windows during tasselling stages.
  • Drone-spray operators favour low-foaming liquids that maintain droplet spectra below 300 µm for drift stewardship.

Fungicide Active Ingredients Market Analysis By Type

Azoxystrobin Underpins Residual Control in Row Crops

Azoxystrobin is forecasted to account for 30% of product-specific fungicide sales, supported by its QoI mode of action and 21-day residual activity in soybean, maize, and peanut rotations. Patent-expired status has widened technical sourcing, reducing cost per hectare for multi-state cooperatives.

  • FMC formulators incorporate azoxystrobin with flutriafol, extending lesion suppression beyond R3 growth stage.
  • Generic suppliers in Jiangsu province pass USP-grade purity tests, ensuring acceptable tox-profile dossiers for EPA reregistration.
  • Yield-gain field trials by Kansas State show 6 bu/ac lift in irrigated corn when V6 applications are retained.

Agriculture Commands Half of Global Fungicide Usage

In 2025, agriculture is anticipated to capture 50% of fungicide active-ingredient volume because food-security policies and contract farming require strict disease-loss thresholds. Growers have adopted season-long programmes aligned with crop insurance performance metrics to guarantee grain-quality specifications for maltsters and feedlots.

  • CHS agronomy retailers bundle fungicides within pre-pay input packages, securing off-take before planting.
  • Variable-rate prescriptions, generated from NDVI imagery, direct higher dose zones toward canopy-dense headlands.
  • Export-grain inspectors enforce maximum defect counts, prompting late-season sprays that lock in grade No. 2 status.

Top Fungicide Active Ingredients Market Dynamics

Surging disease resistance and weather-triggered pathogen surges are driving demand for next-generation fungicide formulations. At the same time, market openings in protective horticulture and seed treatment systems offer targeted avenues for ingredient innovation and global formulation differentiation.

Resistance Management Demands Fuel Multi-Site Active Ingredient Adoption

Rising fungicide resistance-particularly in Zymoseptoria and Botrytis strains-has forced formulators to pivot toward multi-site modes of action. Farmers in the USA Corn Belt and EU cereals sector are being guided to rotate and stack actives using strobilurin-DMI combinations or SDHI-linked mixtures.

BASF and FMC have introduced pre-mixes where azoxystrobin is buffered by less resistance-prone protectants. Regulatory extension programs across Italy, Germany, and Brazil now mandate active rotation documentation during field audits. Adoption of resistance monitoring platforms is reshaping demand, pushing buyers toward tailored formulations with diversified active profiles to preserve field efficacy.

  • Active ingredient mixes are structured to delay single-site resistance development in broadacre crops.
  • Regulatory field audits demand rotation logs and label-specific application tracking.
  • Digital field mapping tools now flag resistance-prone acreage for targeted multi-site application.

High-Value Protected Crops Open Targeted Formulation Opportunities

Expansion of protected cultivation-greenhouses, tunnels, hydroponic systems-has created niche demand for low-residue, fast-acting fungicide actives. Companies such as Isagro and UPL have launched downscaled formulations of cymoxanil, mandipropamid, and fludioxonil tailored for short-cycle vegetables and ornamentals.

Residue limits for cucumber and bell pepper in Japan and UAE have encouraged low-PHI (pre-harvest interval) products with rapid breakdown. Opportunity lies in seed treatment integration, where microencapsulated actives enable slow release without phytotoxicity. Suppliers investing in surfactant-enhanced carriers for foliar sprays have gained preference among growers facing tight harvest cycles.
  • Greenhouse vegetables demand actives with ≤3-day PHI to meet export residue norms.
  • Microencapsulation technologies support precision dosing in seed and root-zone applications.
  • Hydroponic growers require low-foam, non-systemic actives to avoid nutrient tank contamination.

Analyzing Top Countries Formulating, Manufacturing, and Distributing Fungicide Active Ingredients

Country Wise Analysis Of Fungicide Active Ingredients Market Cagr 2025 To 2035

Countries CAGR (2025 to 2035)
United States 5.2%
Brazil 6.1%
India 5.8%
Japan 5.1%
China 4.2%

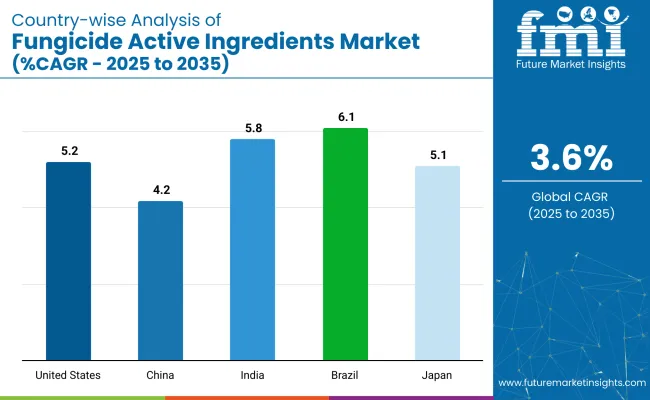
Rising pathogen pressure in row crops lifts fungicide-active demand at a projected 3.6% CAGR from 2025 to 2035. Brazil tops at 6.1%, a +69% premium driven by soybean rust resilience programs and BRICS-aligned export acreage. India follows at 5.8% (+61%), where rice blast outbreaks and generic azoxystrobin production expand local application.

The USA records 5.2% (+44%), its OECD share tempered by tighter residue tolerances and crop-rotation IPM incentives. Japan posts 5.1% (+42%), focusing on high-value horticulture and precision spraying to curb resistance. China lags at 4.2% (+17%) amid regulatory scrutiny on triazoles and consolidation of domestic formulators. The report covers detailed analysis of 40+ countries and the top five countries have been shared as a reference.

Growth Analysis of Fungicide Active Ingredients Market in the United States

The United States fungicide active ingredients sector is expected to expand at 5.2% CAGR through 2035. Growth is predicted to be underpinned by broad-acre adoption across corn-soy rotations, tight Environmental Protection Agency residue limits, and rising integration of triazole-strobilurin premixes in seed-treatment lines.

Competitive advantage is being claimed by multinationals commercializing next-generation succinate dehydrogenase inhibitors that combat resistance clusters identified by the Fungicide Resistance Action Committee. Domestic formulation capacity in the Midwest is being scaled to shorten delivery lead-times during peak spray windows. Consolidation among ag-retail cooperatives is positioning bundled crop-protection programs as the preferred procurement route for large farm enterprises.

  • Digital scouting datasets guide variable-rate fungicide mapping on large Midwestern acreages.
  • Biological actives containing Bacillus subtilis are being co-packed with azoxystrobin seed treatments.
  • Carbon-credit verification protocols favor disease-free crop yields, indirectly lifting fungicide throughput.

Demand Forecast for Fungicide Active Ingredients Market in Brazil

The fungicide active ingredients market in Brazil, rising at 6.1% CAGR to 2035, is projected to benefit from soybean and maize acreage expansion in the Cerrado belt, where high disease pressure demands multi-shot control programs. Circular regulation involving ANVISA and MAPA has accelerated approvals for generic azoxystrobin, propiconazole, and fluxapyroxad formulations, shrinking application costs for cooperatives.

Domestic toll formulation plants in Mato Grosso have been retrofitted to produce high-load emulsifiable concentrates, reducing import dependence and strengthening credit profiles. Crop-specific technical assistance provided by Embrapa is shaping demand for resistance-management alternations, creating rotation-driven volume gains for newer carboxamide actives positioned as cost-efficient protection options.

  • Soy rust outbreaks trigger preventive triazole applications before flowering stage.
  • Local cooperatives negotiate seasonal bulk purchases, locking fixed prices with importers.
  • Rainfast polymer additives gain preference to withstand Amazon basin downpours.

Analysis of Fungicide Active Ingredients Market in India

The fungicide active ingredients market in India is forecast to register 5.8% CAGR through 2035. Growth is anticipated to stem from intensive rice-wheat double-cropping in Punjab and Uttar Pradesh, where leaf-spot outbreaks have been increasing spray frequencies.

The Directorate of Plant Protection, Quarantine & Storage is fast-tracking label expansions for hexaconazole and tebuconazole combinations, enabling spectrum control under integrated disease-management advisories issued by ICAR.

Gujarat-based active-ingredient producers are expanding triazole fermentation capacity by utilizing captive solvent recovery loops that cut input costs. Rising counterfeit crackdowns led by the Central Insecticides Board are expected to redirect volumes toward branded portfolios with assured quality guarantees.

  • Smallholder alliances pool purchasing power via district-level agri input marts.
  • Drone-based spraying pilots approved by DGCA lower labor hours during kharif season.
  • FRAC-endorsed rotation charts get disseminated through KrishiVigyan Kendra outreach.

Future Outlook for Fungicide Active Ingredients Market in Japan

The sales of fungicide active ingredients are anticipated to witness 5.1% CAGR until 2035 in Japan. Demand is projected to hinge on the protected horticulture sector, where tomatoes, cucumbers, and strawberries command high values and require precise disease suppression under glasshouse humidity.

The Ministry of Agriculture, Forestry and Fisheries enforces strict maximum residue limits, compelling formulators to market low-dose suspension concentrates employing microencapsulation technology. Domestic chemical majors are scaling succinate dehydrogenase inhibitor production via continuous-flow synthesis platforms to improve batch consistency.

Retail distribution has been shifting toward cooperative-owned e-commerce portals, enabling rapid overnight fulfillment that aligns with growers’ tight spraying schedules during critical windows.

  • Smart greenhouses employ humidity sensors that automate SDHI misting cycles.
  • Retail demand favors low-odor formulations aligned with indoor crop quality codes.
  • Biopesticide-fungicide tank mixes secure niche adoption in high-value fruit auctions.

Fungicide Active Ingredients Market Growth Outlook in China

The fungicide active ingredient sales in China are forecast to advance at 4.2% CAGR through 2035. Expansion is expected to rely on cereal and horticulture disease management, as government programs drive adoption of low-toxicity formulations to replace older chlorothalonil and carbendazim chemistry.

Provincial subsidies encourage growers to adopt alternating spray calendars that limit resistance while boosting carboxamide demand. State-owned enterprises have integrated upstream intermediates, allowing scale efficiencies and margin retention despite volatile raw-material prices.

The National Agro-Tech Extension Service Center is promoting digital prescription platforms that match pathogen monitoring data with targeted active-ingredient mixes, supporting precise input use across diverse agro-ecological zones nationwide.
  • Carboxamide-strobilurin premixes top provincial tender lists for wheat scab control.
  • E-commerce platforms bundle fungicides with agronomic advisory chatbots.
  • Export-oriented vegetable growers adopt EU residue compliance labels to unlock premiums.

Leading Suppliers in the Industry

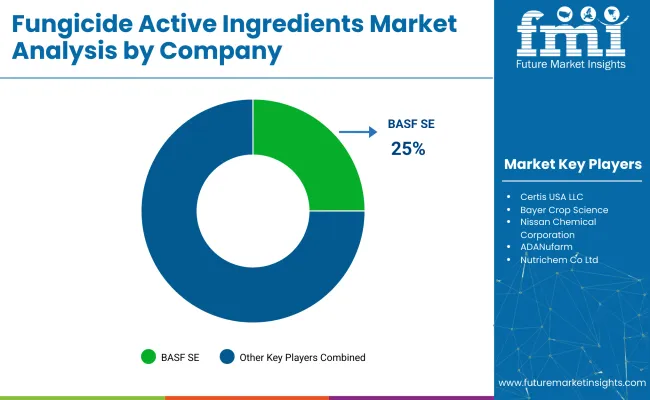
Fungicide Active Ingredients Market Analysis By Company

Top players in the fungicide active ingredients market, including BASF SE, Syngenta Group, and Bayer Crop Science, are fiercely competing through strategic investments in R&D to develop new, more effective fungicide formulations. BASF focuses on expanding its product portfolio by targeting emerging markets and optimizing crop protection solutions with enhanced efficiency.

Syngenta, through its ADAMA subsidiary, is advancing its position by integrating digital tools with crop protection products, improving application efficiency. Bayer Crop Science is focusing on biotechnological advancements, collaborating with ag-tech startups to improve sustainable agriculture.

FMC Corporation and DuPont emphasize global market expansion, particularly in Asia and Latin America, to cater to the increasing demand for fungicides. The market remains competitive with innovation at its core, driven by both large players and niche specialists.

Recent Industry News

  • Forcivo was announced by Corteva. The triple-mix flutriafol, azoxystrobin, fluindapyr formulation is delivered for overlapping preventative and curative foliar disease control in corn and soy, targeting tar spot, southern rust, frogeye leaf spot, yield losses reduction and profitability.
  • Aramax® Intrinsic brand fungicide was introduced by BASF. Turfgrass managers were offered 28-day residual control through combination of pyraclostrobin and triticonazole, granting systemic and translaminar protection against dollar spot, anthracnose, brown patch, while stress-mitigation benefits improve playability metrics outcomes.

Report Coverage and Scope Summary

Report Attributes Key Insights
Estimated Market Value (2025) USD 21.22 billion
Projected Market Value (2035) USD 30.23 billion
CAGR (2025 to 2035) 3.6%
Base Year for Estimation 2024
Historical Period 2020 to 2024
Forecast Period 2025 to 2035
Quantitative Units Revenue in USD billion
Product Azoxystrobin, Boscalid, Chlorothalonil, Cyazofamid, Etridiazole ( Ethazole ), Fenarimol, and Others
Type Powder, Liquid
Form Systematic, Contact, Translaminar
End Use Food Industry, Medicinal, Agriculture, Chemical Laboratory, Others
Regions North America, Latin America, Western Europe, Eastern Europe, East Asia, South Asia & Pacific, Central Asia, Russia and Belarus, Balkan & Baltics, Middle East & Africa
Countries Covered United States, Canada, Mexico, Brazil, Argentina, Germany, France, United Kingdom, Italy, Spain, Netherlands, China, India, Japan, South Korea, ANZ, GCC Countries, South Africa
Key Players BASF SE, Syngenta Group (ADAMA, Ltd.), Certis USA LLC, Bayer Crop Science, Nissan Chemical Corporation, ADANufarm, Nutrichem Co Ltd., Sumitomo Chemical Co. Ltd., FMC Corporation, Isagro S.P.A, DuPont
Additional Attributes Dollar sales, CAGR trends, product type distribution, size preferences, price range segmentation, competitor dollar sales & market share, regional growth patterns

Key Players

  • BASF SE
  • Syngenta Group (ADAMA, Ltd.)
  • Certis USA LLC
  • Bayer Crop Science
  • Nissan Chemical Corporation
  • ADANufarm
  • Nutrichem Co Ltd.
  • Sumitomo Chemical Co. Ltd.
  • FMC Corporation
  • Isagro S.P.A
  • DuPont
  • Others

Key Segmentation

By Product:

As per Product, the industry has been categorized into Azoxystrobin, Boscalid, Chlorothalonil, Cyazofamid, Etridiazole (Ethazole), Fenarimol, and Others.

By Type:

As per Type, the industry has been categorized into Powder and Liquid.

By Form:

As per Form, the industry has been categorized into Systematic, Contact, and Translaminar.

By End Use:

This segment is further categorized into Food Industry, Medicinal, Agriculture, Chemical Laboratory, and Others.

By Region:

Industry analysis has been carried out in key countries of North America, Latin America, Western Europe, Eastern Europe, East Asia, South Asia & Pacific, Central Asia, Russia and Belarus, Balkan & Baltics, and the Middle East & Africa.

Table of Content

  1. Executive Summary
    • Global Market Outlook
    • Demand-side Trends
    • Supply-side Trends
    • Technology Roadmap Analysis
    • Analysis and Recommendations
  2. Market Overview
    • Market Coverage/Taxonomy
    • Market Definition/Scope/Limitations
  3. Market Background
    • Market Dynamics
      • Drivers
      • Restraints
      • Opportunity
      • Trends
    • Scenario Forecast
      • Demand in Optimistic Scenario
      • Demand in Likely Scenario
      • Demand in Conservative Scenario
    • Opportunity Map Analysis
    • Product Life Cycle Analysis
    • Supply Chain Analysis
      • Supply Side Participants and their Roles
        • Producers
        • Mid-Level Participants (Traders/ Agents/ Brokers)
        • Wholesalers and Distributors
      • Value Added and Value Created at Node in the Supply Chain
      • List of Raw Material Suppliers
      • List of Existing and Potential Buyer’s
    • Investment Feasibility Matrix
    • Value Chain Analysis
      • Profit Margin Analysis
      • Wholesalers and Distributors
      • Retailers
    • PESTLE and Porter’s Analysis
    • Regulatory Landscape
      • By Key Regions
      • By Key Countries
    • Regional Parent Market Outlook
    • Production and Consumption Statistics
    • Import and Export Statistics
  4. Global Market Analysis 2020 to 2024 and Forecast, 2025 to 2035
    • Historical Market Size Value (USD Billion) & Volume (Tons) Analysis, 2020 to 2024
    • Current and Future Market Size Value (USD Billion) & Volume (Tons) Projections, 2025 to 2035
      • Y-o-Y Growth Trend Analysis
      • Absolute $ Opportunity Analysis
  5. Global Market Pricing Analysis 2020 to 2024 and Forecast 2025 to 2035
  6. Global Market Analysis 2020 to 2024 and Forecast 2025 to 2035, By Product
    • Introduction/Key Findings
    • Historical Market Size Value (USD Billion) & Volume (Tons) Analysis By Product, 2020 to 2024
    • Current and Future Market Size Value (USD Billion) & Volume (Tons) Analysis and Forecast By Product, 2025 to 2035
      • Azoxystrobin
      • Boscalid
      • Chlorothalonil
      • Cyazofamid
      • Etridiazole (Ethazole)
      • Fenarimol
      • Others (Neem oil, Bacillus subtilis, Ulocladium oudemansii, rosemary oil)
    • Y-o-Y Growth Trend Analysis By Product, 2020 to 2024
    • Absolute $ Opportunity Analysis By Product, 2025 to 2035
  7. Global Market Analysis 2020 to 2024 and Forecast 2025 to 2035, By Type
    • Introduction/Key Findings
    • Historical Market Size Value (USD Billion) & Volume (Tons) Analysis By Type, 2020 to 2024
    • Current and Future Market Size Value (USD Billion) & Volume (Tons) Analysis and Forecast By Type, 2025 to 2035
      • Systemic
      • Contact
      • Translaminar
    • Y-o-Y Growth Trend Analysis By Type, 2020 to 2024
    • Absolute $ Opportunity Analysis By Type, 2025 to 2035
  8. Global Market Analysis 2020 to 2024 and Forecast 2025 to 2035, By Form
    • Introduction/Key Findings
    • Historical Market Size Value (USD Billion) & Volume (Tons) Analysis By Form, 2020 to 2024
    • Current and Future Market Size Value (USD Billion) & Volume (Tons) Analysis and Forecast By Form, 2025 to 2035
      • Powder
      • Liquid
    • Y-o-Y Growth Trend Analysis By Form, 2020 to 2024
    • Absolute $ Opportunity Analysis By Form, 2025 to 2035
  9. Global Market Analysis 2020 to 2024 and Forecast 2025 to 2035, By End Use
    • Introduction/Key Findings
    • Historical Market Size Value (USD Billion) & Volume (Tons) Analysis By End Use, 2020 to 2024
    • Current and Future Market Size Value (USD Billion) & Volume (Tons) Analysis and Forecast By End Use, 2025 to 2035
      • Agriculture
      • Medicinal
      • Food Industry
      • Chemical Laboratory
      • Others (Research institutes, horticulture nurseries, integrated pest management services, biotechnology labs)
    • Y-o-Y Growth Trend Analysis By End Use, 2020 to 2024
    • Absolute $ Opportunity Analysis By End Use, 2025 to 2035
  10. Global Market Analysis 2020 to 2024 and Forecast 2025 to 2035, By Region
    • Introduction
    • Historical Market Size Value (USD Billion) & Volume (Tons) Analysis By Region, 2020 to 2024
    • Current Market Size Value (USD Billion) & Volume (Tons) Analysis and Forecast By Region, 2025 to 2035
      • North America
      • Latin America
      • Western Europe
      • Eastern Europe
      • East Asia
      • South Asia & Pacific
      • Middle East and Africa
    • Market Attractiveness Analysis By Region
  11. North America Market Analysis 2020 to 2024 and Forecast 2025 to 2035, By Country
    • Historical Market Size Value (USD Billion) & Volume (Tons) Trend Analysis By Market Taxonomy, 2020 to 2024
    • Market Size Value (USD Billion) & Volume (Tons) Forecast By Market Taxonomy, 2025 to 2035
      • By Country
        • USA
        • Canada
        • Mexico
      • By Product
      • By Type
      • By Form
      • By End Use
    • Market Attractiveness Analysis
      • By Country
      • By Product
      • By Type
      • By Form
      • By End Use
    • Key Takeaways
  12. Latin America Market Analysis 2020 to 2024 and Forecast 2025 to 2035, By Country
    • Historical Market Size Value (USD Billion) & Volume (Tons) Trend Analysis By Market Taxonomy, 2020 to 2024
    • Market Size Value (USD Billion) & Volume (Tons) Forecast By Market Taxonomy, 2025 to 2035
      • By Country
        • Brazil
        • Argentina
        • Rest of LATAM
      • By Product
      • By Type
      • By Form
      • By End Use
    • Market Attractiveness Analysis
      • By Country
      • By Product
      • By Type
      • By Form
      • By End Use
    • Key Takeaways
  13. Western Europe Market Analysis 2020 to 2024 and Forecast 2025 to 2035, By Country
    • Historical Market Size Value (USD Billion) & Volume (Tons) Trend Analysis By Market Taxonomy, 2020 to 2024
    • Market Size Value (USD Billion) & Volume (Tons) Forecast By Market Taxonomy, 2025 to 2035
      • By Country
        • Germany
        • Italy
        • France
        • UK
        • Spain
        • BENELUX
        • Nordic
        • Rest of W.Europe
      • By Product
      • By Type
      • By Form
      • By End Use
    • Market Attractiveness Analysis
      • By Country
      • By Product
      • By Type
      • By Form
      • By End Use
    • Key Takeaways
  14. Eastern Europe Market Analysis 2020 to 2024 and Forecast 2025 to 2035, By Country
    • Historical Market Size Value (USD Billion) & Volume (Tons) Trend Analysis By Market Taxonomy, 2020 to 2024
    • Market Size Value (USD Billion) & Volume (Tons) Forecast By Market Taxonomy, 2025 to 2035
      • By Country
        • Russia
        • Hungary
        • Poland
        • Balkan & Baltics
        • Rest of E. Europe
      • By Product
      • By Type
      • By Form
      • By End Use
    • Market Attractiveness Analysis
      • By Country
      • By Product
      • By Type
      • By Form
      • By End Use
    • Key Takeaways
  15. East Asia Market Analysis 2020 to 2024 and Forecast 2025 to 2035, By Country
    • Historical Market Size Value (USD Billion) & Volume (Tons) Trend Analysis By Market Taxonomy, 2020 to 2024
    • Market Size Value (USD Billion) & Volume (Tons) Forecast By Market Taxonomy, 2025 to 2035
      • By Country
        • China
        • Japan
        • South Korea
      • By Product
      • By Type
      • By Form
      • By End Use
    • Market Attractiveness Analysis
      • By Country
      • By Product
      • By Type
      • By Form
      • By End Use
    • Key Takeaways
  16. South Asia & Pacific Market Analysis 2020 to 2024 and Forecast 2025 to 2035, By Country
    • Historical Market Size Value (USD Billion) & Volume (Tons) Trend Analysis By Market Taxonomy, 2020 to 2024
    • Market Size Value (USD Billion) & Volume (Tons) Forecast By Market Taxonomy, 2025 to 2035
      • By Country
        • India
        • Australia & New Zealand
        • ASEAN
        • Rest of SAP
      • By Product
      • By Type
      • By Form
      • By End Use
    • Market Attractiveness Analysis
      • By Country
      • By Product
      • By Type
      • By Form
      • By End Use
    • Key Takeaways
  17. Middle East and Africa Market Analysis 2020 to 2024 and Forecast 2025 to 2035, By Country
    • Historical Market Size Value (USD Billion) & Volume (Tons) Trend Analysis By Market Taxonomy, 2020 to 2024
    • Market Size Value (USD Billion) & Volume (Tons) Forecast By Market Taxonomy, 2025 to 2035
      • By Country
        • GCC Countries
        • Northern Africa
        • South Africa
        • Turkiye
        • Rest of MEA
      • By Product
      • By Type
      • By Form
      • By End Use
    • Market Attractiveness Analysis
      • By Country
      • By Product
      • By Type
      • By Form
      • By End Use
    • Key Takeaways
  18. Key Countries Market Analysis
    • USA
      • Pricing Analysis
      • Market Share Analysis, 2024
        • By Product
        • By Type
        • By Form
        • By End Use
    • Canada
      • Pricing Analysis
      • Market Share Analysis, 2024
        • By Product
        • By Type
        • By Form
        • By End Use
    • Brazil
      • Pricing Analysis
      • Market Share Analysis, 2024
        • By Product
        • By Type
        • By Form
        • By End Use
    • Mexico
      • Pricing Analysis
      • Market Share Analysis, 2024
        • By Product
        • By Type
        • By Form
        • By End Use
    • Argentina
      • Pricing Analysis
      • Market Share Analysis, 2024
        • By Product
        • By Type
        • By Form
        • By End Use
  19. Market Structure Analysis
    • Competition Dashboard
    • Competition Benchmarking
    • Market Share Analysis of Top Players
      • By Regional
      • By Product
      • By Type
      • By Form
      • By End Use
  20. Competition Analysis
    • Competition Deep Dive
      • BASF SE
        • Overview
        • Product Portfolio
        • Profitability by Market Segments (Product/Age /Sales Channel/Region)
        • Sales Footprint
        • Strategy Overview
          • Marketing Strategy
          • Product Strategy
          • Channel Strategy
      • Syngenta Group (ADAMA, Ltd.)
        • Overview
        • Product Portfolio
        • Profitability by Market Segments (Product/Age /Sales Channel/Region)
        • Sales Footprint
        • Strategy Overview
          • Marketing Strategy
          • Product Strategy
          • Channel Strategy
      • Certis USA LLC
        • Overview
        • Product Portfolio
        • Profitability by Market Segments (Product/Age /Sales Channel/Region)
        • Sales Footprint
        • Strategy Overview
          • Marketing Strategy
          • Product Strategy
          • Channel Strategy
      • Bayer Crop Science
        • Overview
        • Product Portfolio
        • Profitability by Market Segments (Product/Age /Sales Channel/Region)
        • Sales Footprint
        • Strategy Overview
          • Marketing Strategy
          • Product Strategy
          • Channel Strategy
      • Nissan Chemical Corporation
        • Overview
        • Product Portfolio
        • Profitability by Market Segments (Product/Age /Sales Channel/Region)
        • Sales Footprint
        • Strategy Overview
          • Marketing Strategy
          • Product Strategy
          • Channel Strategy
      • Nufarm
        • Overview
        • Product Portfolio
        • Profitability by Market Segments (Product/Age /Sales Channel/Region)
        • Sales Footprint
        • Strategy Overview
          • Marketing Strategy
          • Product Strategy
          • Channel Strategy
      • Nutrichem Co Ltd.
        • Overview
        • Product Portfolio
        • Profitability by Market Segments (Product/Age /Sales Channel/Region)
        • Sales Footprint
        • Strategy Overview
          • Marketing Strategy
          • Product Strategy
          • Channel Strategy
      • Sumitomo Chemical Co. Ltd.
        • Overview
        • Product Portfolio
        • Profitability by Market Segments (Product/Age /Sales Channel/Region)
        • Sales Footprint
        • Strategy Overview
          • Marketing Strategy
          • Product Strategy
          • Channel Strategy
      • FMC Corporation
        • Overview
        • Product Portfolio
        • Profitability by Market Segments (Product/Age /Sales Channel/Region)
        • Sales Footprint
        • Strategy Overview
          • Marketing Strategy
          • Product Strategy
          • Channel Strategy
      • Isagro S.P.A
        • Overview
        • Product Portfolio
        • Profitability by Market Segments (Product/Age /Sales Channel/Region)
        • Sales Footprint
        • Strategy Overview
          • Marketing Strategy
          • Product Strategy
          • Channel Strategy
      • DuPont
        • Overview
        • Product Portfolio
        • Profitability by Market Segments (Product/Age /Sales Channel/Region)
        • Sales Footprint
        • Strategy Overview
          • Marketing Strategy
          • Product Strategy
          • Channel Strategy
  21. Assumptions & Acronyms Used
  22. Research Methodology

List of Tables

  • Table 1: Global Market Value (USD Billion) Forecast by Region, 2020 to 2035
  • Table 2: Global Market Volume (MT) Forecast by Region, 2020 to 2035
  • Table 3: Global Market Value (USD Billion) Forecast by Product, 2020 to 2035
  • Table 4: Global Market Volume (MT) Forecast by Product, 2020 to 2035
  • Table 5: Global Market Value (USD Billion) Forecast by Type, 2020 to 2035
  • Table 6: Global Market Volume (MT) Forecast by Type, 2020 to 2035
  • Table 7: Global Market Value (USD Billion) Forecast by Form , 2020 to 2035
  • Table 8: Global Market Volume (MT) Forecast by Form , 2020 to 2035
  • Table 9: Global Market Value (USD Billion) Forecast by End Use, 2020 to 2035
  • Table 10: Global Market Volume (MT) Forecast by End Use, 2020 to 2035
  • Table 11: North America Market Value (USD Billion) Forecast by Country, 2020 to 2035
  • Table 12: North America Market Volume (MT) Forecast by Country, 2020 to 2035
  • Table 13: North America Market Value (USD Billion) Forecast by Product, 2020 to 2035
  • Table 14: North America Market Volume (MT) Forecast by Product, 2020 to 2035
  • Table 15: North America Market Value (USD Billion) Forecast by Type, 2020 to 2035
  • Table 16: North America Market Volume (MT) Forecast by Type, 2020 to 2035
  • Table 17: North America Market Value (USD Billion) Forecast by Form , 2020 to 2035
  • Table 18: North America Market Volume (MT) Forecast by Form , 2020 to 2035
  • Table 19: North America Market Value (USD Billion) Forecast by End Use, 2020 to 2035
  • Table 20: North America Market Volume (MT) Forecast by End Use, 2020 to 2035
  • Table 21: Latin America Market Value (USD Billion) Forecast by Country, 2020 to 2035
  • Table 22: Latin America Market Volume (MT) Forecast by Country, 2020 to 2035
  • Table 23: Latin America Market Value (USD Billion) Forecast by Product, 2020 to 2035
  • Table 24: Latin America Market Volume (MT) Forecast by Product, 2020 to 2035
  • Table 25: Latin America Market Value (USD Billion) Forecast by Type, 2020 to 2035
  • Table 26: Latin America Market Volume (MT) Forecast by Type, 2020 to 2035
  • Table 27: Latin America Market Value (USD Billion) Forecast by Form , 2020 to 2035
  • Table 28: Latin America Market Volume (MT) Forecast by Form , 2020 to 2035
  • Table 29: Latin America Market Value (USD Billion) Forecast by End Use, 2020 to 2035
  • Table 30: Latin America Market Volume (MT) Forecast by End Use, 2020 to 2035
  • Table 31: Western Europe Market Value (USD Billion) Forecast by Country, 2020 to 2035
  • Table 32: Western Europe Market Volume (MT) Forecast by Country, 2020 to 2035
  • Table 33: Western Europe Market Value (USD Billion) Forecast by Product, 2020 to 2035
  • Table 34: Western Europe Market Volume (MT) Forecast by Product, 2020 to 2035
  • Table 35: Western Europe Market Value (USD Billion) Forecast by Type, 2020 to 2035
  • Table 36: Western Europe Market Volume (MT) Forecast by Type, 2020 to 2035
  • Table 37: Western Europe Market Value (USD Billion) Forecast by Form , 2020 to 2035
  • Table 38: Western Europe Market Volume (MT) Forecast by Form , 2020 to 2035
  • Table 39: Western Europe Market Value (USD Billion) Forecast by End Use, 2020 to 2035
  • Table 40: Western Europe Market Volume (MT) Forecast by End Use, 2020 to 2035
  • Table 41: Eastern Europe Market Value (USD Billion) Forecast by Country, 2020 to 2035
  • Table 42: Eastern Europe Market Volume (MT) Forecast by Country, 2020 to 2035
  • Table 43: Eastern Europe Market Value (USD Billion) Forecast by Product, 2020 to 2035
  • Table 44: Eastern Europe Market Volume (MT) Forecast by Product, 2020 to 2035
  • Table 45: Eastern Europe Market Value (USD Billion) Forecast by Type, 2020 to 2035
  • Table 46: Eastern Europe Market Volume (MT) Forecast by Type, 2020 to 2035
  • Table 47: Eastern Europe Market Value (USD Billion) Forecast by Form , 2020 to 2035
  • Table 48: Eastern Europe Market Volume (MT) Forecast by Form , 2020 to 2035
  • Table 49: Eastern Europe Market Value (USD Billion) Forecast by End Use, 2020 to 2035
  • Table 50: Eastern Europe Market Volume (MT) Forecast by End Use, 2020 to 2035
  • Table 51: East Asia Market Value (USD Billion) Forecast by Country, 2020 to 2035
  • Table 52: East Asia Market Volume (MT) Forecast by Country, 2020 to 2035
  • Table 53: East Asia Market Value (USD Billion) Forecast by Product, 2020 to 2035
  • Table 54: East Asia Market Volume (MT) Forecast by Product, 2020 to 2035
  • Table 55: East Asia Market Value (USD Billion) Forecast by Type, 2020 to 2035
  • Table 56: East Asia Market Volume (MT) Forecast by Type, 2020 to 2035
  • Table 57: East Asia Market Value (USD Billion) Forecast by Form , 2020 to 2035
  • Table 58: East Asia Market Volume (MT) Forecast by Form , 2020 to 2035
  • Table 59: East Asia Market Value (USD Billion) Forecast by End Use, 2020 to 2035
  • Table 60: East Asia Market Volume (MT) Forecast by End Use, 2020 to 2035
  • Table 61: South Asia & Pacific Market Value (USD Billion) Forecast by Country, 2020 to 2035
  • Table 62: South Asia & Pacific Market Volume (MT) Forecast by Country, 2020 to 2035
  • Table 63: South Asia & Pacific Market Value (USD Billion) Forecast by Product, 2020 to 2035
  • Table 64: South Asia & Pacific Market Volume (MT) Forecast by Product, 2020 to 2035
  • Table 65: South Asia & Pacific Market Value (USD Billion) Forecast by Type, 2020 to 2035
  • Table 66: South Asia & Pacific Market Volume (MT) Forecast by Type, 2020 to 2035
  • Table 67: South Asia & Pacific Market Value (USD Billion) Forecast by Form , 2020 to 2035
  • Table 68: South Asia & Pacific Market Volume (MT) Forecast by Form , 2020 to 2035
  • Table 69: South Asia & Pacific Market Value (USD Billion) Forecast by End Use, 2020 to 2035
  • Table 70: South Asia & Pacific Market Volume (MT) Forecast by End Use, 2020 to 2035
  • Table 71: Middle East and Africa Market Value (USD Billion) Forecast by Country, 2020 to 2035
  • Table 72: Middle East and Africa Market Volume (MT) Forecast by Country, 2020 to 2035
  • Table 73: Middle East and Africa Market Value (USD Billion) Forecast by Product, 2020 to 2035
  • Table 74: Middle East and Africa Market Volume (MT) Forecast by Product, 2020 to 2035
  • Table 75: Middle East and Africa Market Value (USD Billion) Forecast by Type, 2020 to 2035
  • Table 76: Middle East and Africa Market Volume (MT) Forecast by Type, 2020 to 2035
  • Table 77: Middle East and Africa Market Value (USD Billion) Forecast by Form , 2020 to 2035
  • Table 78: Middle East and Africa Market Volume (MT) Forecast by Form , 2020 to 2035
  • Table 79: Middle East and Africa Market Value (USD Billion) Forecast by End Use, 2020 to 2035
  • Table 80: Middle East and Africa Market Volume (MT) Forecast by End Use, 2020 to 2035

List of Figures

  • Figure 1: Global Market Volume (MT) Forecast 2020 to 2035
  • Figure 2: Global Market Pricing Analysis
  • Figure 3: Global Market Value (USD Billion) Forecast 2020 to 2035
  • Figure 4: Global Market Value Share and BPS Analysis by Product, 2025 and 2035
  • Figure 5: Global Market Y-o-Y Growth Comparison by Product, 2025 to 2035
  • Figure 6: Global Market Attractiveness Analysis by Product
  • Figure 7: Global Market Value Share and BPS Analysis by Type, 2025 and 2035
  • Figure 8: Global Market Y-o-Y Growth Comparison by Type, 2025 to 2035
  • Figure 9: Global Market Attractiveness Analysis by Type
  • Figure 10: Global Market Value Share and BPS Analysis by Form , 2025 and 2035
  • Figure 11: Global Market Y-o-Y Growth Comparison by Form , 2025 to 2035
  • Figure 12: Global Market Attractiveness Analysis by Form
  • Figure 13: Global Market Value Share and BPS Analysis by End Use, 2025 and 2035
  • Figure 14: Global Market Y-o-Y Growth Comparison by End Use, 2025 to 2035
  • Figure 15: Global Market Attractiveness Analysis by End Use
  • Figure 16: Global Market Value (USD Billion) Share and BPS Analysis by Region, 2025 and 2035
  • Figure 17: Global Market Y-o-Y Growth Comparison by Region, 2025 to 2035
  • Figure 18: Global Market Attractiveness Analysis by Region
  • Figure 19: North America Market Incremental $ Opportunity, 2025 to 2035
  • Figure 20: Latin America Market Incremental $ Opportunity, 2025 to 2035
  • Figure 21: Western Europe Market Incremental $ Opportunity, 2025 to 2035
  • Figure 22: Eastern Europe Market Incremental $ Opportunity, 2025 to 2035
  • Figure 23: East Asia Market Incremental $ Opportunity, 2025 to 2035
  • Figure 24: South Asia & Pacific Market Incremental $ Opportunity, 2025 to 2035
  • Figure 25: Middle East and Africa Market Incremental $ Opportunity, 2025 to 2035
  • Figure 26: North America Market Value Share and BPS Analysis by Country, 2025 and 2035
  • Figure 27: North America Market Value Share and BPS Analysis by Product, 2025 and 2035
  • Figure 28: North America Market Y-o-Y Growth Comparison by Product, 2025 to 2035
  • Figure 29: North America Market Attractiveness Analysis by Product
  • Figure 30: North America Market Value Share and BPS Analysis by Type, 2025 and 2035
  • Figure 31: North America Market Y-o-Y Growth Comparison by Type, 2025 to 2035
  • Figure 32: North America Market Attractiveness Analysis by Type
  • Figure 33: North America Market Value Share and BPS Analysis by Form , 2025 and 2035
  • Figure 34: North America Market Y-o-Y Growth Comparison by Form , 2025 to 2035
  • Figure 35: North America Market Attractiveness Analysis by Form
  • Figure 36: North America Market Value Share and BPS Analysis by End Use, 2025 and 2035
  • Figure 37: North America Market Y-o-Y Growth Comparison by End Use, 2025 to 2035
  • Figure 38: North America Market Attractiveness Analysis by End Use
  • Figure 39: Latin America Market Value Share and BPS Analysis by Country, 2025 and 2035
  • Figure 40: Latin America Market Value Share and BPS Analysis by Product, 2025 and 2035
  • Figure 41: Latin America Market Y-o-Y Growth Comparison by Product, 2025 to 2035
  • Figure 42: Latin America Market Attractiveness Analysis by Product
  • Figure 43: Latin America Market Value Share and BPS Analysis by Type, 2025 and 2035
  • Figure 44: Latin America Market Y-o-Y Growth Comparison by Type, 2025 to 2035
  • Figure 45: Latin America Market Attractiveness Analysis by Type
  • Figure 46: Latin America Market Value Share and BPS Analysis by Form , 2025 and 2035
  • Figure 47: Latin America Market Y-o-Y Growth Comparison by Form , 2025 to 2035
  • Figure 48: Latin America Market Attractiveness Analysis by Form
  • Figure 49: Latin America Market Value Share and BPS Analysis by End Use, 2025 and 2035
  • Figure 50: Latin America Market Y-o-Y Growth Comparison by End Use, 2025 to 2035
  • Figure 51: Latin America Market Attractiveness Analysis by End Use
  • Figure 52: Western Europe Market Value Share and BPS Analysis by Country, 2025 and 2035
  • Figure 53: Western Europe Market Value Share and BPS Analysis by Product, 2025 and 2035
  • Figure 54: Western Europe Market Y-o-Y Growth Comparison by Product, 2025 to 2035
  • Figure 55: Western Europe Market Attractiveness Analysis by Product
  • Figure 56: Western Europe Market Value Share and BPS Analysis by Type, 2025 and 2035
  • Figure 57: Western Europe Market Y-o-Y Growth Comparison by Type, 2025 to 2035
  • Figure 58: Western Europe Market Attractiveness Analysis by Type
  • Figure 59: Western Europe Market Value Share and BPS Analysis by Form , 2025 and 2035
  • Figure 60: Western Europe Market Y-o-Y Growth Comparison by Form , 2025 to 2035
  • Figure 61: Western Europe Market Attractiveness Analysis by Form
  • Figure 62: Western Europe Market Value Share and BPS Analysis by End Use, 2025 and 2035
  • Figure 63: Western Europe Market Y-o-Y Growth Comparison by End Use, 2025 to 2035
  • Figure 64: Western Europe Market Attractiveness Analysis by End Use
  • Figure 65: Eastern Europe Market Value Share and BPS Analysis by Country, 2025 and 2035
  • Figure 66: Eastern Europe Market Value Share and BPS Analysis by Product, 2025 and 2035
  • Figure 67: Eastern Europe Market Y-o-Y Growth Comparison by Product, 2025 to 2035
  • Figure 68: Eastern Europe Market Attractiveness Analysis by Product
  • Figure 69: Eastern Europe Market Value Share and BPS Analysis by Type, 2025 and 2035
  • Figure 70: Eastern Europe Market Y-o-Y Growth Comparison by Type, 2025 to 2035
  • Figure 71: Eastern Europe Market Attractiveness Analysis by Type
  • Figure 72: Eastern Europe Market Value Share and BPS Analysis by Form , 2025 and 2035
  • Figure 73: Eastern Europe Market Y-o-Y Growth Comparison by Form , 2025 to 2035
  • Figure 74: Eastern Europe Market Attractiveness Analysis by Form
  • Figure 75: Eastern Europe Market Value Share and BPS Analysis by End Use, 2025 and 2035
  • Figure 76: Eastern Europe Market Y-o-Y Growth Comparison by End Use, 2025 to 2035
  • Figure 77: Eastern Europe Market Attractiveness Analysis by End Use
  • Figure 78: East Asia Market Value Share and BPS Analysis by Country, 2025 and 2035
  • Figure 79: East Asia Market Value Share and BPS Analysis by Product, 2025 and 2035
  • Figure 80: East Asia Market Y-o-Y Growth Comparison by Product, 2025 to 2035
  • Figure 81: East Asia Market Attractiveness Analysis by Product
  • Figure 82: East Asia Market Value Share and BPS Analysis by Type, 2025 and 2035
  • Figure 83: East Asia Market Y-o-Y Growth Comparison by Type, 2025 to 2035
  • Figure 84: East Asia Market Attractiveness Analysis by Type
  • Figure 85: East Asia Market Value Share and BPS Analysis by Form , 2025 and 2035
  • Figure 86: East Asia Market Y-o-Y Growth Comparison by Form , 2025 to 2035
  • Figure 87: East Asia Market Attractiveness Analysis by Form
  • Figure 88: East Asia Market Value Share and BPS Analysis by End Use, 2025 and 2035
  • Figure 89: East Asia Market Y-o-Y Growth Comparison by End Use, 2025 to 2035
  • Figure 90: East Asia Market Attractiveness Analysis by End Use
  • Figure 91: South Asia & Pacific Market Value Share and BPS Analysis by Country, 2025 and 2035
  • Figure 92: South Asia & Pacific Market Value Share and BPS Analysis by Product, 2025 and 2035
  • Figure 93: South Asia & Pacific Market Y-o-Y Growth Comparison by Product, 2025 to 2035
  • Figure 94: South Asia & Pacific Market Attractiveness Analysis by Product
  • Figure 95: South Asia & Pacific Market Value Share and BPS Analysis by Type, 2025 and 2035
  • Figure 96: South Asia & Pacific Market Y-o-Y Growth Comparison by Type, 2025 to 2035
  • Figure 97: South Asia & Pacific Market Attractiveness Analysis by Type
  • Figure 98: South Asia & Pacific Market Value Share and BPS Analysis by Form , 2025 and 2035
  • Figure 99: South Asia & Pacific Market Y-o-Y Growth Comparison by Form , 2025 to 2035
  • Figure 100: South Asia & Pacific Market Attractiveness Analysis by Form
  • Figure 101: South Asia & Pacific Market Value Share and BPS Analysis by End Use, 2025 and 2035
  • Figure 102: South Asia & Pacific Market Y-o-Y Growth Comparison by End Use, 2025 to 2035
  • Figure 103: South Asia & Pacific Market Attractiveness Analysis by End Use
  • Figure 104: Middle East and Africa Market Value Share and BPS Analysis by Country, 2025 and 2035
  • Figure 105: Middle East and Africa Market Value Share and BPS Analysis by Product, 2025 and 2035
  • Figure 106: Middle East and Africa Market Y-o-Y Growth Comparison by Product, 2025 to 2035
  • Figure 107: Middle East and Africa Market Attractiveness Analysis by Product
  • Figure 108: Middle East and Africa Market Value Share and BPS Analysis by Type, 2025 and 2035
  • Figure 109: Middle East and Africa Market Y-o-Y Growth Comparison by Type, 2025 to 2035
  • Figure 110: Middle East and Africa Market Attractiveness Analysis by Type
  • Figure 111: Middle East and Africa Market Value Share and BPS Analysis by Form , 2025 and 2035
  • Figure 112: Middle East and Africa Market Y-o-Y Growth Comparison by Form , 2025 to 2035
  • Figure 113: Middle East and Africa Market Attractiveness Analysis by Form
  • Figure 114: Middle East and Africa Market Value Share and BPS Analysis by End Use, 2025 and 2035
  • Figure 115: Middle East and Africa Market Y-o-Y Growth Comparison by End Use, 2025 to 2035
  • Figure 116: Middle East and Africa Market Attractiveness Analysis by End Use
  • Figure 117: Global Market - Tier Structure Analysis
  • Figure 118: Global Market - Company Share Analysis

Frequently Asked Questions

What is the projected growth rate of the fungicide active ingredients market?

The fungicide active ingredients market is expected to grow at a CAGR of 3.6% from 2025 to 2035.

Which fungicide type is expected to hold the largest market share in 2035?

Systematic fungicides are projected to hold around 39% of the market share in 2035.

What is the market share of liquid formulations in the fungicide active ingredients market?

Liquid formulations are set to hold 51.4% of the market share in 2025.

Which country is expected to lead in fungicide active ingredient growth?

India is expected to lead the growth with a projected CAGR of 5.8%.

What is the expected market value for fungicide active ingredients in 2025?

The fungicide active ingredients market is forecast to reach USD 21.22 billion in 2025.

Explore Similar Insights

Future Market Insights

Fungicide Active Ingredients Market