Active Wear Market
Market Insights on Active Wear covering sales outlook, demand forecast & up-to-date key trends
Active Wear Market by Product Type, Material Type & Region - Forecast 2022 – 2032
Active Wear Market Outlook (2022-2032)
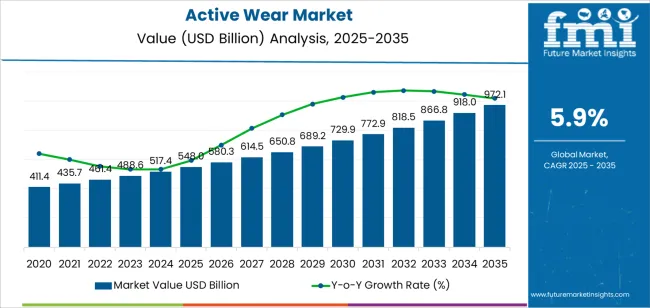
[333 Pages Report] The active wear market is anticipated to have an effective CAGR of 6.4% during the period of 2022-2032. The active wear market is expected to expand from US$ 421.2 billion in 2022 to US$ 779.9 billion in 2032. Previously, the market grew at a faster rate of 4.5 percent from 2017 to 2021, culminating in a market of US$ 390.0 billion in 2021.
Active lifestyles are influencing the market positively due to the increase in people turning towards them.
Women and men are adopting activewear outside the gym to wear as casual clothing as it gives the wearer a dry and comfortable feel. Cotton-based activewear is especially popular in the summer because it keeps the wearer dry and also prevents irritation of the skin.
Attributes |
Details |
Active Wear Market CAGR (2022-2032) |
6.4% |
Market Size (2022) |
US$ 421.2 Billion |
Market Size (2032) |
US$ 779.9 Billion |
Let us know your requirement to get
100% FREE customization
How Covid-19 Opens Up New Opportunities In The Active Wear Market?
It is evident that COVID-19 has made an impact on the active wear market. In order to increase revenue and production of distilled liqueur, investment costs and the lack of employees both played a significant role. Nevertheless, major players in the active wear market adopted measures to advance the development of their products.
The online distribution channel is changing the shopping habits of people because it enables people to make purchases more quickly, has easier payment methods, a wide range of products that can be delivered to their doorsteps, and larger discounts, contributing to the growth of the active wear market during the pandemic, and it will further accelerate its growth during the post-pandemic stage.
What Drives The Future Of The Active Wear Market?
As consumers' health consciousness grows due to sedentary lifestyles and the prevalence of various diseases, such as diabetes and heart disease, market growth of active wear has been accelerated.
Active lifestyles are influencing the market positively due to the increase in people turning towards them.
One of the key factors contributing to the growth of the active wear market is the unique benefits offered by active wear, such as quick-drying, thermal resistance, breathability, chemical resistance, and static resistance.
However, the increase in the number of fake and counterfeit products adversely impacts the growth of the global active wear market.
As a result of volatile raw material costs & high designing costs, the active wear market is likely to face challenges related to a declining number of price-sensitive consumers in the forecast period of 2022-2032.
By providing suitable fitting and proper support, activewear can prevent muscle sprains and other ligament and muscle injuries. This has led to the rapid growth of the global active wear market.
These activewear products offer many advantages, including quick-drying properties. Sedentary lifestyles have made consumers more conscious of their health, which further boosts the active wear market ahead.
Find your sweet spots for generating winning opportunities in this market.
Talk to AnalystComparative View Of Adjacent Active Wear Market
Active Wear Market:
Attributes |
Active Wear Market |
CAGR (2022-2032) |
6.4% |
Market Value (2026) |
US$ 530.6 Billion |
Growth Factor |
One of the key factors contributing to the growth of the active wear market is the unique benefits offered by activewear such as quick-drying, thermal resistance, breathability, chemical resistance, and static resistance. |
Opportunity |
Activewear & athleisure wear is now embraced holistically by female customers |
Key Trends |
These activewear products offer many advantages, including quick-drying properties. Sedentary lifestyles have made consumers more conscious of their health. |
Workout Clothes Market:
Attributes |
Workout Clothes Market |
CAGR (2022-2032) |
2.8% |
Market Value (2026) |
US$ 129.7 Billion |
Growth Factor |
The ongoing health and wellness trend is the primary driver of the demand for workout apparel, prompting consumers to spend on this apparel, thereby fueling the overall workout apparel market growth. |
Opportunity |
Rising adoption of functionality-specific apparel and footwear, as well as technological advancements, are considered to improve the workout apparel market statistics. |
Key Trends |
Some of the most recent developments in the workout apparel market include functional clothing, which is made with anti-bacterial materials that can prevent body odor. |
Gym Apparel Market:
Attributes |
Gym Apparel Market |
CAGR (2022-2032) |
6.2% |
Market Value (2026) |
US$ 284.7 Billion |
Growth Factor |
Rising health concern amidst the globally disrupting Covid-19 infection cases was carried forward to the post pandemic period that is anticipated to be indirectly benefitting the gym apparel market trends and forecast. |
Opportunity |
Arrangement of competitions and events showcasing the benefits of working out and bodybuilding has had a similar impact in these countries and other areas as well. The growing popularity of such events is also predicted to serve as a driving factor for gym apparel market key trends and opportunities. |
Key Trends |
Proliferation of e-commerce platforms have expanded the gym apparel market. |
Particularly in times of pandemic, traditional gym clothing and casual clothing are less easily distinguishable. Increasingly, the athletic apparel industry offers options for wearers allowing them to effortlessly transition between leisure and exercise, which some in the industry are calling "Athleisure."
This trend includes yoga pants, jogger pants, tank tops, sports bras, and hoodies. Customers are trimming down their wardrobe options and buying key pieces of apparel that can be worn in different contexts.
In order to increase revenue and production of distilled liqueur, investment costs and the lack of employees both played a significant role. Nevertheless, major players in the active wear market adopted measures to advance the development of their products.
The online distribution channel is changing the shopping habits of people because it enables people to make purchases more quickly, has easier payment methods, a wide range of products that can be delivered to their doorsteps, and larger discounts, contributing to the growth of the active wear market during the pandemic, and it will further accelerate its growth during the post-pandemic stage.
One of the key factors contributing to the growth of the active wear market is the unique benefits offered by activewear, such as quick-drying, thermal resistance, breathability, chemical resistance, and static resistance.
As consumers' health consciousness grows due to sedentary lifestyles and the prevalence of various diseases, such as diabetes and heart disease, active wear market growth has been accelerated.
Active lifestyles are influencing the market positively due to the increase in people turning towards them.
One of the key factors contributing to the growth of the active wear market is the unique benefits offered by activewear, such as quick-drying, thermal resistance, breathability, chemical resistance, and static resistance.
As a result of high design costs & volatile raw material costs, the active wear market is likely to face challenges related to a declining number of price-sensitive consumers in the forecast period of 2022-2032.
Increasing participation in physical and sports activities by young and older people has also led to a rise in the demand for activewear. Although counterfeit and fake products adversely affect the growth of the global active wear market, an increase in the number of these products is expected.
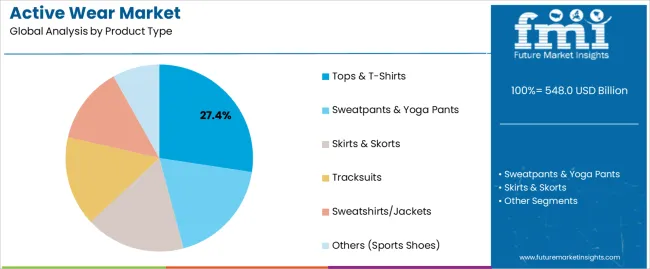
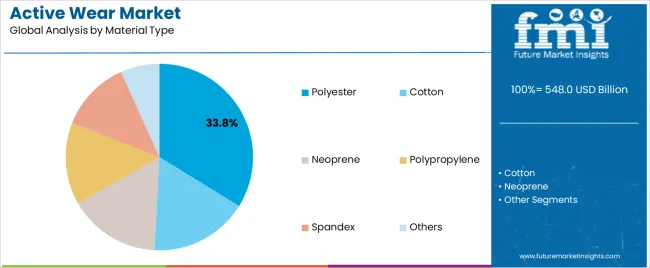
The global active wear market can be segmented on type, fabric, and consumer orientation. On the basis of type, the global active wear market can be segmented into ready-to-wear, fashion outer, pants & T-shirts, wet suits & swimwear, shoes, and fashion brands. Depending on the fabric, activewear is segmented into polyester, nylon, neoprene, Polypropylene, spandex, cotton, and others.
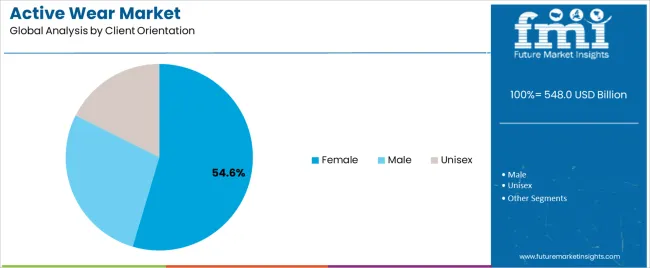
Based on client orientation, the global active wear market is divided into men and women. Geographically, the Active wear market can be segmented into seven regions: North America, Latin America, Europe, East Asia, South Asia, Oceania, and the Middle East and Africa.
What Is The Segmentation Analysis Of The Active Wear Market?
The global active wear market can be segmented on type, fabric, and consumer orientation. On the basis of type, the global active wear market can be segmented into ready-to-wear, fashion outers, pants & T-shirts, wet suits & swimwear, shoes, and fashion brands. Depending on the fabric, activewear is segmented into polyester, nylon, neoprene, Polypropylene, spandex, cotton, and others.
Based on client orientation, the global active wear market is divided into men and women. Geographically, the active wear market can be segmented into seven regions: North America, Latin America, Europe, East Asia, South Asia, Oceania, and the Middle East and Africa.
In addition to using recycled polyester and non-toxic dyes in garment production, more athletic wear companies use recycled polyester and non-toxic fabrics in their clothing. Several companies, such as Patagonia, have pledged to reduce electricity consumption and greenhouse gas emissions at their facilities.

An unified Market Research Subscription Platform, built for today’s disparate research needs.
Which Location Has The Highest Potential In The Active Wear Market?
Due to its widespread adoption as both casual and sportswear within the region, North America dominates the women's active wear market.
Asia-Pacific is expected to grow at the fastest rate from 2018 to 2024 due to the growing interest in health & wellness, as well as an increase in participation in sports activities.
Increasing participation in physical and sports activities by young and older people has also led to a rise in the demand for activewear. Although counterfeit and fake products adversely affect the growth of the global active wear market, an increase in the number of these products is expected.
What Is The Regional Outlook Of The Active Wear Market?
Due to the significant development in the trend of athleisure wear, which has become part of the office and casual wear, the North American activewear industry dominates the global market.
The increasing popularity of sporting events and the increasing usage of activewear by sports fans is the major reason for the rapid growth of the European active wear market.
As a result, there is a higher demand for activewear products, such as t-shirts and outerwear, in the market. Furthermore, with increasing concerns about health & wellness, and an increase in participation in sports activities among the youth population, the Asia-Pacific region is set to record the highest growth rate from 2018 to 2024.
LAMEA is expected to see a rise in disposable income and an improvement in living standards, which will probably lead to a growth in the active wear market there.
What Is The Competitive Outlook For The Active Wear Market?
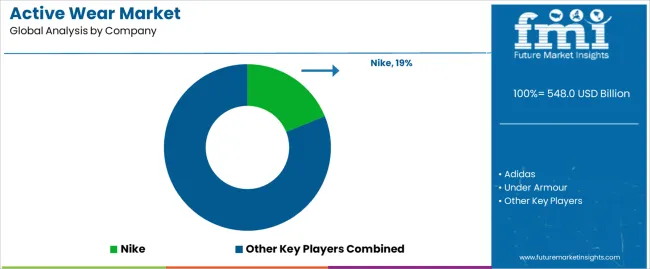
In recent years, the active wear market has developed a competitive edge. The industry includes Adidas AG, Mizuno U.S.A., NIKE, Inc., Decathlon, Gap Inc, Under Armour, Inc, PUMA SE, Jockey, Skechers U.S.A., Inc, Dick's Sportswear Company, P.V.H. Corp, V.F. Corporation, Forever21 Inc., H&M Hennes & Mauritz AB.
It was observed in January 2018 that Nike had found counterfeit active wear products worth more than $50,000 at Dulles International Airport in Virginia; these issues are leading to declining sales of key market players, negatively impacting the overall market growth.
Key Players
- Adidas AG
- Mizuno USA
- NIKE, Inc.
- Decathlon
- Gap Inc.
- Under Armour Inc.
- PUMA SE
- Jockey
- Skechers U.S.A. Inc.
- Dick's Sportswear Company
- PVH Corp
- V.F. Corporation
- Forever21 Inc.
- H&M Hennes
- Mauritz AB
Key segments
By Product Type:
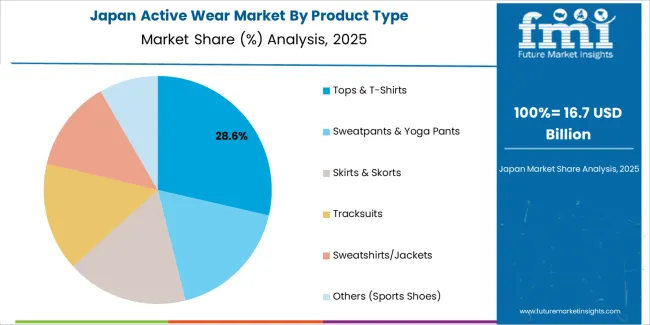
- Tops & T-Shirts
- Sweatpants & Yoga Pants
- Skirts & Skorts
- Tracksuits
- Sweatshirts/Jacket
- Others (Sports Shoes)
By Material Type:
- Cotton
- Polyester
- Neoprene
- Polypropylene
- Spandex
- Others
By Consumer Orientation:
- Male
- Female
- Unisex
By Price Range:
- Economy
- Mid-Range
- Premium
By Sales Channel:
- Offline Sales Channel
- Online Sales Channel
By Region:
- North America
- Latin America
- Europe
- East Asia
- South Asia
- Oceania
- Middle East & Africa (MEA)
Frequently Asked Questions
The active wear market is projected to have a CAGR of 6.4% during the forecast period.
The US is the leading region in the active wear market.
The active wear market is predicted to grow to US$ 779.9 billion by 2032.
Large enterprises lead the active wear market.
1. Executive Summary
1.1. Global Market Outlook
1.2. Demand-side Trends
1.3. Supply-side Trends
1.4. Technology Roadmap Analysis
1.5. Analysis and Recommendations
2. Market Overview
2.1. Market Coverage / Taxonomy
2.2. Market Definition / Scope / Limitations
3. Market Background
3.1. Market Dynamics
3.1.1. Drivers
3.1.2. Restraints
3.1.3. Opportunity
3.1.4. Trends
3.2. Scenario Forecast
3.2.1. Demand in Optimistic Scenario
3.2.2. Demand in Likely Scenario
3.2.3. Demand in Conservative Scenario
3.3. Supply Chain Analysis
3.4. Investment Feasibility Matrix
3.5. Value Chain Analysis
3.5.1. Profit Margin Analysis
3.5.2. Wholesalers and Distributors
3.5.3. Retailers
3.6. PESTLE and Porter’s Analysis
4. Global Active Wear Market Analysis 2017-2021 and Forecast, 2022-2032
4.1. Historical Market Size Value (US$ Mn) & Volume (Units) Analysis, 2017-2021
4.2. Current and Future Market Size Value (US$ Mn) & Volume (Units) Projections, 2022-2032
4.2.1. Y-o-Y Growth Trend Analysis
4.2.2. Absolute $ Opportunity Analysis
5. Global Active Wear Market Analysis 2017-2021 and Forecast 2022-2032, By Product Type
5.1. Introduction / Key Findings
5.2. Historical Market Size Value (US$ Mn) & Volume (Units) Analysis By Product Type, 2017-2021
5.3. Current and Future Market Size Value (US$ Mn) & Volume (Units) Analysis and Forecast By Product Type, 2022-2032
5.3.1. Tops & T-shirts
5.3.2. Sweatpants & Yoga Pants
5.3.3. Skirts & Skorts
5.3.4. Tracksuits
5.3.5. Sweatshirt/Jacket
5.3.6. Others (shoes)
5.4. Y-o-Y Growth Trend Analysis By Product Type, 2017-2021
5.5. Absolute $ Opportunity Analysis By Product Type, 2022-2032
6. Global Active Wear Market Analysis 2017-2021 and Forecast 2022-2032, By Material Type
6.1. Introduction / Key Findings
6.2. Historical Market Size Value (US$ Mn) & Volume (Units) Analysis By Material Type, 2017-2021
6.3. Current and Future Market Size Value (US$ Mn) & Volume (Units) Analysis and Forecast By Material Type, 2022-2032
6.3.1. Cotton
6.3.2. Polyester
6.3.3. Neoprene
6.3.4. Polypropylene
6.3.5. Spandex
6.3.6. Others
6.4. Y-o-Y Growth Trend Analysis By Material Type, 2017-2021
6.5. Absolute $ Opportunity Analysis By Material Type, 2022-2032
7. Global Active Wear Market Analysis 2017-2021 and Forecast 2022-2032, By End Usr
7.1. Introduction / Key Findings
7.2. Historical Market Size Value (US$ Mn) & Volume (Units) Analysis By End Usr , 2017-2021
7.3. Current and Future Market Size Value (US$ Mn) & Volume (Units) Analysis and Forecast By End Usr , 2022-2032
7.3.1. Men
7.3.2. Women
7.3.3. Unisex
7.4. Y-o-Y Growth Trend Analysis By End Usr , 2017-2021
7.5. Absolute $ Opportunity Analysis By End Usr , 2022-2032
8. Global Active Wear Market Analysis 2017-2021 and Forecast 2022-2032, By Price Range
8.1. Introduction / Key Findings
8.2. Historical Market Size Value (US$ Mn) & Volume (Units) Analysis By Price Range, 2017-2021
8.3. Current and Future Market Size Value (US$ Mn) & Volume (Units) Analysis and Forecast By Price Range, 2022-2032
8.3.1. Economy
8.3.2. Mid-Range
8.3.3. Premium
8.4. Y-o-Y Growth Trend Analysis By Price Range, 2017-2021
8.5. Absolute $ Opportunity Analysis By Price Range, 2022-2032
9. Global Active Wear Market Analysis 2017-2021 and Forecast 2022-2032, By Sales Channel
9.1. Introduction / Key Findings
9.2. Historical Market Size Value (US$ Mn) & Volume (Units) Analysis By Sales Channel, 2017-2021
9.3. Current and Future Market Size Value (US$ Mn) & Volume (Units) Analysis and Forecast By Sales Channel, 2022-2032
9.3.1. Offline Sales Channel
9.3.1.1. Modern Trade Channels
9.3.1.2. Independent Outlets
9.3.1.3. Franchised Outlets
9.3.1.4. Specialty Stores
9.3.1.5. Other Sales Channel
9.3.2. Online Sales Channel
9.3.2.1. Company Owned Websites
9.3.2.2. E-commerce Websites
9.4. Y-o-Y Growth Trend Analysis By Sales Channel, 2017-2021
9.5. Absolute $ Opportunity Analysis By Sales Channel, 2022-2032
10. Global Active Wear Market Analysis 2017-2021 and Forecast 2022-2032, By Region
10.1. Introduction
10.2. Historical Market Size Value (US$ Mn) & Volume (Units) Analysis By Region, 2017-2021
10.3. Current Market Size Value (US$ Mn) & Volume (Units) Analysis and Forecast By Region, 2022-2032
10.3.1. North America
10.3.2. Latin America
10.3.3. Europe
10.3.4. East Asia
10.3.5. South Asia
10.3.6. Oceania
10.3.7. MEA
10.4. Market Attractiveness Analysis By Region
11. North America Active Wear Market Analysis 2017-2021 and Forecast 2022-2032, By Country
11.1. Historical Market Size Value (US$ Mn) & Volume (Units) Trend Analysis By Market Taxonomy, 2017-2021
11.2. Market Size Value (US$ Mn) & Volume (Units) Forecast By Market Taxonomy, 2022-2032
11.2.1. By Country
11.2.1.1. U.S.
11.2.1.2. Canada
11.2.2. By Product Type
11.2.3. By Material Type
11.2.4. By End Usr
11.2.5. By Price Range
11.2.6. By Sales Channel
11.3. Market Attractiveness Analysis
11.3.1. By Country
11.3.2. By Product Type
11.3.3. By Material Type
11.3.4. By End Usr
11.3.5. By Price Range
11.3.6. By Sales Channel
11.4. Key Takeaways
12. Latin America Active Wear Market Analysis 2017-2021 and Forecast 2022-2032, By Country
12.1. Historical Market Size Value (US$ Mn) & Volume (Units) Trend Analysis By Market Taxonomy, 2017-2021
12.2. Market Size Value (US$ Mn) & Volume (Units) Forecast By Market Taxonomy, 2022-2032
12.2.1. By Country
12.2.1.1. Brazil
12.2.1.2. Mexico
12.2.1.3. Rest of Latin America
12.2.2. By Product Type
12.2.3. By Material Type
12.2.4. By End Usr
12.2.5. By Price Range
12.2.6. By Sales Channel
12.3. Market Attractiveness Analysis
12.3.1. By Country
12.3.2. By Product Type
12.3.3. By Material Type
12.3.4. By End Usr
12.3.5. By Price Range
12.3.6. By Sales Channel
12.4. Key Takeaways
13. Europe Active Wear Market Analysis 2017-2021 and Forecast 2022-2032, By Country
13.1. Historical Market Size Value (US$ Mn) & Volume (Units) Trend Analysis By Market Taxonomy, 2017-2021
13.2. Market Size Value (US$ Mn) & Volume (Units) Forecast By Market Taxonomy, 2022-2032
13.2.1. By Country
13.2.1.1. Germany
13.2.1.2. Italy
13.2.1.3. France
13.2.1.4. U.K.
13.2.1.5. Spain
13.2.1.6. Russia
13.2.1.7. BENELUX
13.2.1.8. Rest of Europe
13.2.2. By Product Type
13.2.3. By Material Type
13.2.4. By End Usr
13.2.5. By Price Range
13.2.6. By Sales Channel
13.3. Market Attractiveness Analysis
13.3.1. By Country
13.3.2. By Product Type
13.3.3. By Material Type
13.3.4. By End Usr
13.3.5. By Price Range
13.3.6. By Sales Channel
13.4. Key Takeaways
14. East Asia Active Wear Market Analysis 2017-2021 and Forecast 2022-2032, By Country
14.1. Historical Market Size Value (US$ Mn) & Volume (Units) Trend Analysis By Market Taxonomy, 2017-2021
14.2. Market Size Value (US$ Mn) & Volume (Units) Forecast By Market Taxonomy, 2022-2032
14.2.1. By Country
14.2.1.1. China
14.2.1.2. Japan
14.2.1.3. South Korea
14.2.2. By Product Type
14.2.3. By Material Type
14.2.4. By End Usr
14.2.5. By Price Range
14.2.6. By Sales Channel
14.3. Market Attractiveness Analysis
14.3.1. By Country
14.3.2. By Product Type
14.3.3. By Material Type
14.3.4. By End Usr
14.3.5. By Price Range
14.3.6. By Sales Channel
14.4. Key Takeaways
15. South Asia Active Wear Market Analysis 2017-2021 and Forecast 2022-2032, By Country
15.1. Historical Market Size Value (US$ Mn) & Volume (Units) Trend Analysis By Market Taxonomy, 2017-2021
15.2. Market Size Value (US$ Mn) & Volume (Units) Forecast By Market Taxonomy, 2022-2032
15.2.1. By Country
15.2.1.1. India
15.2.1.2. Thailand
15.2.1.3. Malaysia
15.2.1.4. Indonesia
15.2.1.5. Rest of South Asia
15.2.2. By Product Type
15.2.3. By Material Type
15.2.4. By End Usr
15.2.5. By Price Range
15.2.6. By Sales Channel
15.3. Market Attractiveness Analysis
15.3.1. By Country
15.3.2. By Product Type
15.3.3. By Material Type
15.3.4. By End Usr
15.3.5. By Price Range
15.3.6. By Sales Channel
15.4. Key Takeaways
16. Oceania Active Wear Market Analysis 2017-2021 and Forecast 2022-2032, By Country
16.1. Historical Market Size Value (US$ Mn) & Volume (Units) Trend Analysis By Market Taxonomy, 2017-2021
16.2. Market Size Value (US$ Mn) & Volume (Units) Forecast By Market Taxonomy, 2022-2032
16.2.1. By Country
16.2.1.1. Australia
16.2.1.2. New Zealand
16.2.2. By Product Type
16.2.3. By Material Type
16.2.4. By End Usr
16.2.5. By Price Range
16.2.6. By Sales Channel
16.3. Market Attractiveness Analysis
16.3.1. By Country
16.3.2. By Product Type
16.3.3. By Material Type
16.3.4. By End Usr
16.3.5. By Price Range
16.3.6. By Sales Channel
16.4. Key Takeaways
17. MEA Active Wear Market Analysis 2017-2021 and Forecast 2022-2032, By Country
17.1. Historical Market Size Value (US$ Mn) & Volume (Units) Trend Analysis By Market Taxonomy, 2017-2021
17.2. Market Size Value (US$ Mn) & Volume (Units) Forecast By Market Taxonomy, 2022-2032
17.2.1. By Country
17.2.1.1. GCC
17.2.1.2. South Africa
17.2.1.3. North Africa
17.2.1.4. Rest of MEA
17.2.2. By Product Type
17.2.3. By Material Type
17.2.4. By End Usr
17.2.5. By Price Range
17.2.6. By Sales Channel
17.3. Market Attractiveness Analysis
17.3.1. By Country
17.3.2. By Product Type
17.3.3. By Material Type
17.3.4. By End Usr
17.3.5. By Price Range
17.3.6. By Sales Channel
17.4. Key Takeaways
18. Key Countries Active Wear Market Analysis
18.1. U.S.
18.1.1. Pricing Analysis
18.1.2. Market Share Analysis, 2021
18.1.2.1. By Product Type
18.1.2.2. By Material Type
18.1.2.3. By End Usr
18.1.2.4. By Price Range
18.1.2.5. By Sales Channel
18.2. Canada
18.2.1. Pricing Analysis
18.2.2. Market Share Analysis, 2021
18.2.2.1. By Product Type
18.2.2.2. By Material Type
18.2.2.3. By End Usr
18.2.2.4. By Price Range
18.2.2.5. By Sales Channel
18.3. Brazil
18.3.1. Pricing Analysis
18.3.2. Market Share Analysis, 2021
18.3.2.1. By Product Type
18.3.2.2. By Material Type
18.3.2.3. By End Usr
18.3.2.4. By Price Range
18.3.2.5. By Sales Channel
18.4. Mexico
18.4.1. Pricing Analysis
18.4.2. Market Share Analysis, 2021
18.4.2.1. By Product Type
18.4.2.2. By Material Type
18.4.2.3. By End Usr
18.4.2.4. By Price Range
18.4.2.5. By Sales Channel
18.5. Argentina
18.5.1. Pricing Analysis
18.5.2. Market Share Analysis, 2021
18.5.2.1. By Product Type
18.5.2.2. By Material Type
18.5.2.3. By End Usr
18.5.2.4. By Price Range
18.5.2.5. By Sales Channel
18.6. Germany
18.6.1. Pricing Analysis
18.6.2. Market Share Analysis, 2021
18.6.2.1. By Product Type
18.6.2.2. By Material Type
18.6.2.3. By End Usr
18.6.2.4. By Price Range
18.6.2.5. By Sales Channel
18.7. Italy
18.7.1. Pricing Analysis
18.7.2. Market Share Analysis, 2021
18.7.2.1. By Product Type
18.7.2.2. By Material Type
18.7.2.3. By End Usr
18.7.2.4. By Price Range
18.7.2.5. By Sales Channel
18.8. France
18.8.1. Pricing Analysis
18.8.2. Market Share Analysis, 2021
18.8.2.1. By Product Type
18.8.2.2. By Material Type
18.8.2.3. By End Usr
18.8.2.4. By Price Range
18.8.2.5. By Sales Channel
18.9. Spain
18.9.1. Pricing Analysis
18.9.2. Market Share Analysis, 2021
18.9.2.1. By Product Type
18.9.2.2. By Material Type
18.9.2.3. By End Usr
18.9.2.4. By Price Range
18.9.2.5. By Sales Channel
18.10. Russia
18.10.1. Pricing Analysis
18.10.2. Market Share Analysis, 2021
18.10.2.1. By Product Type
18.10.2.2. By Material Type
18.10.2.3. By End Usr
18.10.2.4. By Price Range
18.10.2.5. By Sales Channel
18.11. China
18.11.1. Pricing Analysis
18.11.2. Market Share Analysis, 2021
18.11.2.1. By Product Type
18.11.2.2. By Material Type
18.11.2.3. By End Usr
18.11.2.4. By Price Range
18.11.2.5. By Sales Channel
18.12. Japan
18.12.1. Pricing Analysis
18.12.2. Market Share Analysis, 2021
18.12.2.1. By Product Type
18.12.2.2. By Material Type
18.12.2.3. By End Usr
18.12.2.4. By Price Range
18.12.2.5. By Sales Channel
18.13. South Korea
18.13.1. Pricing Analysis
18.13.2. Market Share Analysis, 2021
18.13.2.1. By Product Type
18.13.2.2. By Material Type
18.13.2.3. By End Usr
18.13.2.4. By Price Range
18.13.2.5. By Sales Channel
18.14. India
18.14.1. Pricing Analysis
18.14.2. Market Share Analysis, 2021
18.14.2.1. By Product Type
18.14.2.2. By Material Type
18.14.2.3. By End Usr
18.14.2.4. By Price Range
18.14.2.5. By Sales Channel
18.15. Thailand
18.15.1. Pricing Analysis
18.15.2. Market Share Analysis, 2021
18.15.2.1. By Product Type
18.15.2.2. By Material Type
18.15.2.3. By End Usr
18.15.2.4. By Price Range
18.15.2.5. By Sales Channel
18.16. Indonesia
18.16.1. Pricing Analysis
18.16.2. Market Share Analysis, 2021
18.16.2.1. By Product Type
18.16.2.2. By Material Type
18.16.2.3. By End Usr
18.16.2.4. By Price Range
18.16.2.5. By Sales Channel
18.17. Australia
18.17.1. Pricing Analysis
18.17.2. Market Share Analysis, 2021
18.17.2.1. By Product Type
18.17.2.2. By Material Type
18.17.2.3. By End Usr
18.17.2.4. By Price Range
18.17.2.5. By Sales Channel
18.18. Newzealand
18.18.1. Pricing Analysis
18.18.2. Market Share Analysis, 2021
18.18.2.1. By Product Type
18.18.2.2. By Material Type
18.18.2.3. By End Usr
18.18.2.4. By Price Range
18.18.2.5. By Sales Channel
18.19. GCC Countries
18.19.1. Pricing Analysis
18.19.2. Market Share Analysis, 2021
18.19.2.1. By Product Type
18.19.2.2. By Material Type
18.19.2.3. By End Usr
18.19.2.4. By Price Range
18.19.2.5. By Sales Channel
19. Market Structure Analysis
19.1. Competition Dashboard
19.2. Competition Benchmarking
19.3. Market Share Analysis of Top Players
19.3.1. By Regional
19.3.2. By Product Type
19.3.3. By Material Type
19.3.4. By End Usr
19.3.5. By Price Range
19.3.6. By Sales Channel
20. Competition Analysis
20.1. Competition Deep Dive
20.1.1. Forever21 Inc.
20.1.1.1. Overview
20.1.1.2. Product Portfolio
20.1.1.3. Sales Footprint
20.1.1.4. Strategy Overview
20.1.1.4.1. Marketing Strategy
20.1.1.4.2. Product Strategy
20.1.1.4.3. Channel Strategy
20.1.2. Mizuno USA
20.1.2.1. Overview
20.1.2.2. Product Portfolio
20.1.2.3. Sales Footprint
20.1.2.4. Strategy Overview
20.1.2.4.1. Marketing Strategy
20.1.2.4.2. Product Strategy
20.1.2.4.3. Channel Strategy
20.1.3. H&M Hennes & Mauritz AB
20.1.3.1. Overview
20.1.3.2. Product Portfolio
20.1.3.3. Sales Footprint
20.1.3.4. Strategy Overview
20.1.3.4.1. Marketing Strategy
20.1.3.4.2. Product Strategy
20.1.3.4.3. Channel Strategy
20.1.4. DICK's Sportswear Company
20.1.4.1. Overview
20.1.4.2. Product Portfolio
20.1.4.3. Sales Footprint
20.1.4.4. Strategy Overview
20.1.4.4.1. Marketing Strategy
20.1.4.4.2. Product Strategy
20.1.4.4.3. Channel Strategy
20.1.5. FTP IP COMPANY INC.
20.1.5.1. Overview
20.1.5.2. Product Portfolio
20.1.5.3. Sales Footprint
20.1.5.4. Strategy Overview
20.1.5.4.1. Marketing Strategy
20.1.5.4.2. Product Strategy
20.1.5.4.3. Channel Strategy
20.1.6. ASICS Corporation
20.1.6.1. Overview
20.1.6.2. Product Portfolio
20.1.6.3. Sales Footprint
20.1.6.4. Strategy Overview
20.1.6.4.1. Marketing Strategy
20.1.6.4.2. Product Strategy
20.1.6.4.3. Channel Strategy
20.1.7. Under Armour Inc.
20.1.7.1. Overview
20.1.7.2. Product Portfolio
20.1.7.3. Sales Footprint
20.1.7.4. Strategy Overview
20.1.7.4.1. Marketing Strategy
20.1.7.4.2. Product Strategy
20.1.7.4.3. Channel Strategy
20.1.8. NIKE Inc
20.1.8.1. Overview
20.1.8.2. Product Portfolio
20.1.8.3. Sales Footprint
20.1.8.4. Strategy Overview
20.1.8.4.1. Marketing Strategy
20.1.8.4.2. Product Strategy
20.1.8.4.3. Channel Strategy
20.1.9. V.F Corporation
20.1.9.1. Overview
20.1.9.2. Product Portfolio
20.1.9.3. Sales Footprint
20.1.9.4. Strategy Overview
20.1.9.4.1. Marketing Strategy
20.1.9.4.2. Product Strategy
20.1.9.4.3. Channel Strategy
20.1.10. PVH Corp
20.1.10.1. Overview
20.1.10.2. Product Portfolio
20.1.10.3. Sales Footprint
20.1.10.4. Strategy Overview
20.1.10.4.1. Marketing Strategy
20.1.10.4.2. Product Strategy
20.1.10.4.3. Channel Strategy
20.1.11. Adidas AG
20.1.11.1. Overview
20.1.11.2. Product Portfolio
20.1.11.3. Sales Footprint
20.1.11.4. Strategy Overview
20.1.11.4.1. Marketing Strategy
20.1.11.4.2. Product Strategy
20.1.11.4.3. Channel Strategy
20.1.12. PUMA SE
20.1.12.1. Overview
20.1.12.2. Product Portfolio
20.1.12.3. Sales Footprint
20.1.12.4. Strategy Overview
20.1.12.4.1. Marketing Strategy
20.1.12.4.2. Product Strategy
20.1.12.4.3. Channel Strategy
20.1.13. Jockey
20.1.13.1. Overview
20.1.13.2. Product Portfolio
20.1.13.3. Sales Footprint
20.1.13.4. Strategy Overview
20.1.13.4.1. Marketing Strategy
20.1.13.4.2. Product Strategy
20.1.13.4.3. Channel Strategy
20.1.14. Skechers USA
20.1.14.1. Overview
20.1.14.2. Product Portfolio
20.1.14.3. Sales Footprint
20.1.14.4. Strategy Overview
20.1.14.4.1. Marketing Strategy
20.1.14.4.2. Product Strategy
20.1.14.4.3. Channel Strategy
20.1.15. Decathlon
20.1.15.1. Overview
20.1.15.2. Product Portfolio
20.1.15.3. Sales Footprint
20.1.15.4. Strategy Overview
20.1.15.4.1. Marketing Strategy
20.1.15.4.2. Product Strategy
20.1.15.4.3. Channel Strategy
21. Assumptions & Acronyms Used
22. Research Methodology
Let us know your requirement to get
100% FREE customization
Table 01: Global Active Wear Market Value (US$ Mn) Forecast by Region, 2017-2032
Table 02: Global Active Wear Market Volume (Units) Forecast by Region, 2017-2032
Table 03: Global Active Wear Market Value (US$ Mn) Forecast by Product Type, 2017-2032
Table 04: Global Active Wear Market Volume (Units) Forecast by Product Type, 2017-2032
Table 05: Global Active Wear Market Value (US$ Mn) Forecast by Material Type, 2017-2032
Table 06: Global Active Wear Market Volume (Units) Forecast by Material Type, 2017-2032
Table 07: Global Active Wear Market Value (US$ Mn) Forecast by End Usr , 2017-2032
Table 08: Global Active Wear Market Volume (Units) Forecast by End Usr , 2017-2032
Table 09: Global Active Wear Market Value (US$ Mn) Forecast by Price Range, 2017-2032
Table 10: Global Active Wear Market Volume (Units) Forecast by Price Range, 2017-2032
Table 11: Global Active Wear Market Value (US$ Mn) Forecast by Sales Channel, 2017-2032
Table 12: Global Active Wear Market Volume (Units) Forecast by Sales Channel, 2017-2032
Table 13: North America Active Wear Market Value (US$ Mn) Forecast by Country, 2017-2032
Table 14: North America Active Wear Market Volume (Units) Forecast by Country, 2017-2032
Table 15: North America Active Wear Market Value (US$ Mn) Forecast by Product Type, 2017-2032
Table 16: North America Active Wear Market Volume (Units) Forecast by Product Type, 2017-2032
Table 17: North America Active Wear Market Value (US$ Mn) Forecast by Material Type, 2017-2032
Table 18: North America Active Wear Market Volume (Units) Forecast by Material Type, 2017-2032
Table 19: North America Active Wear Market Value (US$ Mn) Forecast by End Usr , 2017-2032
Table 20: North America Active Wear Market Volume (Units) Forecast by End Usr , 2017-2032
Table 21: North America Active Wear Market Value (US$ Mn) Forecast by Price Range, 2017-2032
Table 22: North America Active Wear Market Volume (Units) Forecast by Price Range, 2017-2032
Table 23: North America Active Wear Market Value (US$ Mn) Forecast by Sales Channel, 2017-2032
Table 24: North America Active Wear Market Volume (Units) Forecast by Sales Channel, 2017-2032
Table 25: Latin America Active Wear Market Value (US$ Mn) Forecast by Country, 2017-2032
Table 26: Latin America Active Wear Market Volume (Units) Forecast by Country, 2017-2032
Table 27: Latin America Active Wear Market Value (US$ Mn) Forecast by Product Type, 2017-2032
Table 28: Latin America Active Wear Market Volume (Units) Forecast by Product Type, 2017-2032
Table 29: Latin America Active Wear Market Value (US$ Mn) Forecast by Material Type, 2017-2032
Table 30: Latin America Active Wear Market Volume (Units) Forecast by Material Type, 2017-2032
Table 31: Latin America Active Wear Market Value (US$ Mn) Forecast by End Usr , 2017-2032
Table 32: Latin America Active Wear Market Volume (Units) Forecast by End Usr , 2017-2032
Table 33: Latin America Active Wear Market Value (US$ Mn) Forecast by Price Range, 2017-2032
Table 34: Latin America Active Wear Market Volume (Units) Forecast by Price Range, 2017-2032
Table 35: Latin America Active Wear Market Value (US$ Mn) Forecast by Sales Channel, 2017-2032
Table 36: Latin America Active Wear Market Volume (Units) Forecast by Sales Channel, 2017-2032
Table 37: Europe Active Wear Market Value (US$ Mn) Forecast by Country, 2017-2032
Table 38: Europe Active Wear Market Volume (Units) Forecast by Country, 2017-2032
Table 39: Europe Active Wear Market Value (US$ Mn) Forecast by Product Type, 2017-2032
Table 40: Europe Active Wear Market Volume (Units) Forecast by Product Type, 2017-2032
Table 41: Europe Active Wear Market Value (US$ Mn) Forecast by Material Type, 2017-2032
Table 42: Europe Active Wear Market Volume (Units) Forecast by Material Type, 2017-2032
Table 43: Europe Active Wear Market Value (US$ Mn) Forecast by End Usr , 2017-2032
Table 44: Europe Active Wear Market Volume (Units) Forecast by End Usr , 2017-2032
Table 45: Europe Active Wear Market Value (US$ Mn) Forecast by Price Range, 2017-2032
Table 46: Europe Active Wear Market Volume (Units) Forecast by Price Range, 2017-2032
Table 47: Europe Active Wear Market Value (US$ Mn) Forecast by Sales Channel, 2017-2032
Table 48: Europe Active Wear Market Volume (Units) Forecast by Sales Channel, 2017-2032
Table 49: East Asia Active Wear Market Value (US$ Mn) Forecast by Country, 2017-2032
Table 50: East Asia Active Wear Market Volume (Units) Forecast by Country, 2017-2032
Table 51: East Asia Active Wear Market Value (US$ Mn) Forecast by Product Type, 2017-2032
Table 52: East Asia Active Wear Market Volume (Units) Forecast by Product Type, 2017-2032
Table 53: East Asia Active Wear Market Value (US$ Mn) Forecast by Material Type, 2017-2032
Table 54: East Asia Active Wear Market Volume (Units) Forecast by Material Type, 2017-2032
Table 55: East Asia Active Wear Market Value (US$ Mn) Forecast by End Usr , 2017-2032
Table 56: East Asia Active Wear Market Volume (Units) Forecast by End Usr , 2017-2032
Table 57: East Asia Active Wear Market Value (US$ Mn) Forecast by Price Range, 2017-2032
Table 58: East Asia Active Wear Market Volume (Units) Forecast by Price Range, 2017-2032
Table 59: East Asia Active Wear Market Value (US$ Mn) Forecast by Sales Channel, 2017-2032
Table 60: East Asia Active Wear Market Volume (Units) Forecast by Sales Channel, 2017-2032
Table 61: South Asia Active Wear Market Value (US$ Mn) Forecast by Country, 2017-2032
Table 62: South Asia Active Wear Market Volume (Units) Forecast by Country, 2017-2032
Table 63: South Asia Active Wear Market Value (US$ Mn) Forecast by Product Type, 2017-2032
Table 64: South Asia Active Wear Market Volume (Units) Forecast by Product Type, 2017-2032
Table 65: South Asia Active Wear Market Value (US$ Mn) Forecast by Material Type, 2017-2032
Table 66: South Asia Active Wear Market Volume (Units) Forecast by Material Type, 2017-2032
Table 67: South Asia Active Wear Market Value (US$ Mn) Forecast by End Usr , 2017-2032
Table 68: South Asia Active Wear Market Volume (Units) Forecast by End Usr , 2017-2032
Table 69: South Asia Active Wear Market Value (US$ Mn) Forecast by Price Range, 2017-2032
Table 70: South Asia Active Wear Market Volume (Units) Forecast by Price Range, 2017-2032
Table 71: South Asia Active Wear Market Value (US$ Mn) Forecast by Sales Channel, 2017-2032
Table 72: South Asia Active Wear Market Volume (Units) Forecast by Sales Channel, 2017-2032
Table 73: Oceania Active Wear Market Value (US$ Mn) Forecast by Country, 2017-2032
Table 74: Oceania Active Wear Market Volume (Units) Forecast by Country, 2017-2032
Table 75: Oceania Active Wear Market Value (US$ Mn) Forecast by Product Type, 2017-2032
Table 76: Oceania Active Wear Market Volume (Units) Forecast by Product Type, 2017-2032
Table 77: Oceania Active Wear Market Value (US$ Mn) Forecast by Material Type, 2017-2032
Table 78: Oceania Active Wear Market Volume (Units) Forecast by Material Type, 2017-2032
Table 79: Oceania Active Wear Market Value (US$ Mn) Forecast by End Usr , 2017-2032
Table 80: Oceania Active Wear Market Volume (Units) Forecast by End Usr , 2017-2032
Table 81: Oceania Active Wear Market Value (US$ Mn) Forecast by Price Range, 2017-2032
Table 82: Oceania Active Wear Market Volume (Units) Forecast by Price Range, 2017-2032
Table 83: Oceania Active Wear Market Value (US$ Mn) Forecast by Sales Channel, 2017-2032
Table 84: Oceania Active Wear Market Volume (Units) Forecast by Sales Channel, 2017-2032
Table 85: MEA Active Wear Market Value (US$ Mn) Forecast by Country, 2017-2032
Table 86: MEA Active Wear Market Volume (Units) Forecast by Country, 2017-2032
Table 87: MEA Active Wear Market Value (US$ Mn) Forecast by Product Type, 2017-2032
Table 88: MEA Active Wear Market Volume (Units) Forecast by Product Type, 2017-2032
Table 89: MEA Active Wear Market Value (US$ Mn) Forecast by Material Type, 2017-2032
Table 90: MEA Active Wear Market Volume (Units) Forecast by Material Type, 2017-2032
Table 91: MEA Active Wear Market Value (US$ Mn) Forecast by End Usr , 2017-2032
Table 92: MEA Active Wear Market Volume (Units) Forecast by End Usr , 2017-2032
Table 93: MEA Active Wear Market Value (US$ Mn) Forecast by Price Range, 2017-2032
Table 94: MEA Active Wear Market Volume (Units) Forecast by Price Range, 2017-2032
Table 95: MEA Active Wear Market Value (US$ Mn) Forecast by Sales Channel, 2017-2032
Table 96: MEA Active Wear Market Volume (Units) Forecast by Sales Channel, 2017-2032
Find your sweet spots for generating winning opportunities in this market.
Talk to AnalystFigure 01: Global Active Wear Market Value (US$ Mn) by Product Type, 2022-2032
Figure 02: Global Active Wear Market Value (US$ Mn) by Material Type, 2022-2032
Figure 03: Global Active Wear Market Value (US$ Mn) by End Usr , 2022-2032
Figure 04: Global Active Wear Market Value (US$ Mn) by Price Range, 2022-2032
Figure 05: Global Active Wear Market Value (US$ Mn) by Sales Channel, 2022-2032
Figure 06: Global Active Wear Market Value (US$ Mn) by Region, 2022-2032
Figure 07: Global Active Wear Market Value (US$ Mn) Analysis by Region, 2017-2032
Figure 08: Global Active Wear Market Volume (Units) Analysis by Region, 2017-2032
Figure 09: Global Active Wear Market Value Share (%) and BPS Analysis by Region, 2022-2032
Figure 10: Global Active Wear Market Y-o-Y Growth (%) Projections by Region, 2022-2032
Figure 11: Global Active Wear Market Value (US$ Mn) Analysis by Product Type, 2017-2032
Figure 12: Global Active Wear Market Volume (Units) Analysis by Product Type, 2017-2032
Figure 13: Global Active Wear Market Value Share (%) and BPS Analysis by Product Type, 2022-2032
Figure 14: Global Active Wear Market Y-o-Y Growth (%) Projections by Product Type, 2022-2032
Figure 15: Global Active Wear Market Value (US$ Mn) Analysis by Material Type, 2017-2032
Figure 16: Global Active Wear Market Volume (Units) Analysis by Material Type, 2017-2032
Figure 17: Global Active Wear Market Value Share (%) and BPS Analysis by Material Type, 2022-2032
Figure 18: Global Active Wear Market Y-o-Y Growth (%) Projections by Material Type, 2022-2032
Figure 19: Global Active Wear Market Value (US$ Mn) Analysis by End Usr , 2017-2032
Figure 20: Global Active Wear Market Volume (Units) Analysis by End Usr , 2017-2032
Figure 21: Global Active Wear Market Value Share (%) and BPS Analysis by End Usr , 2022-2032
Figure 22: Global Active Wear Market Y-o-Y Growth (%) Projections by End Usr , 2022-2032
Figure 23: Global Active Wear Market Value (US$ Mn) Analysis by Price Range, 2017-2032
Figure 24: Global Active Wear Market Volume (Units) Analysis by Price Range, 2017-2032
Figure 25: Global Active Wear Market Value Share (%) and BPS Analysis by Price Range, 2022-2032
Figure 26: Global Active Wear Market Y-o-Y Growth (%) Projections by Price Range, 2022-2032
Figure 27: Global Active Wear Market Value (US$ Mn) Analysis by Sales Channel, 2017-2032
Figure 28: Global Active Wear Market Volume (Units) Analysis by Sales Channel, 2017-2032
Figure 29: Global Active Wear Market Value Share (%) and BPS Analysis by Sales Channel, 2022-2032
Figure 30: Global Active Wear Market Y-o-Y Growth (%) Projections by Sales Channel, 2022-2032
Figure 31: Global Active Wear Market Attractiveness by Product Type, 2022-2032
Figure 32: Global Active Wear Market Attractiveness by Material Type, 2022-2032
Figure 33: Global Active Wear Market Attractiveness by End Usr , 2022-2032
Figure 34: Global Active Wear Market Attractiveness by Price Range, 2022-2032
Figure 35: Global Active Wear Market Attractiveness by Sales Channel, 2022-2032
Figure 36: Global Active Wear Market Attractiveness by Region, 2022-2032
Figure 37: North America Active Wear Market Value (US$ Mn) by Product Type, 2022-2032
Figure 38: North America Active Wear Market Value (US$ Mn) by Material Type, 2022-2032
Figure 39: North America Active Wear Market Value (US$ Mn) by End Usr , 2022-2032
Figure 40: North America Active Wear Market Value (US$ Mn) by Price Range, 2022-2032
Figure 41: North America Active Wear Market Value (US$ Mn) by Sales Channel, 2022-2032
Figure 42: North America Active Wear Market Value (US$ Mn) by Country, 2022-2032
Figure 43: North America Active Wear Market Value (US$ Mn) Analysis by Country, 2017-2032
Figure 44: North America Active Wear Market Volume (Units) Analysis by Country, 2017-2032
Figure 45: North America Active Wear Market Value Share (%) and BPS Analysis by Country, 2022-2032
Figure 46: North America Active Wear Market Y-o-Y Growth (%) Projections by Country, 2022-2032
Figure 47: North America Active Wear Market Value (US$ Mn) Analysis by Product Type, 2017-2032
Figure 48: North America Active Wear Market Volume (Units) Analysis by Product Type, 2017-2032
Figure 49: North America Active Wear Market Value Share (%) and BPS Analysis by Product Type, 2022-2032
Figure 50: North America Active Wear Market Y-o-Y Growth (%) Projections by Product Type, 2022-2032
Figure 51: North America Active Wear Market Value (US$ Mn) Analysis by Material Type, 2017-2032
Figure 52: North America Active Wear Market Volume (Units) Analysis by Material Type, 2017-2032
Figure 53: North America Active Wear Market Value Share (%) and BPS Analysis by Material Type, 2022-2032
Figure 54: North America Active Wear Market Y-o-Y Growth (%) Projections by Material Type, 2022-2032
Figure 55: North America Active Wear Market Value (US$ Mn) Analysis by End Usr , 2017-2032
Figure 56: North America Active Wear Market Volume (Units) Analysis by End Usr , 2017-2032
Figure 57: North America Active Wear Market Value Share (%) and BPS Analysis by End Usr , 2022-2032
Figure 58: North America Active Wear Market Y-o-Y Growth (%) Projections by End Usr , 2022-2032
Figure 59: North America Active Wear Market Value (US$ Mn) Analysis by Price Range, 2017-2032
Figure 60: North America Active Wear Market Volume (Units) Analysis by Price Range, 2017-2032
Figure 61: North America Active Wear Market Value Share (%) and BPS Analysis by Price Range, 2022-2032
Figure 62: North America Active Wear Market Y-o-Y Growth (%) Projections by Price Range, 2022-2032
Figure 63: North America Active Wear Market Value (US$ Mn) Analysis by Sales Channel, 2017-2032
Figure 64: North America Active Wear Market Volume (Units) Analysis by Sales Channel, 2017-2032
Figure 65: North America Active Wear Market Value Share (%) and BPS Analysis by Sales Channel, 2022-2032
Figure 66: North America Active Wear Market Y-o-Y Growth (%) Projections by Sales Channel, 2022-2032
Figure 67: North America Active Wear Market Attractiveness by Product Type, 2022-2032
Figure 68: North America Active Wear Market Attractiveness by Material Type, 2022-2032
Figure 69: North America Active Wear Market Attractiveness by End Usr , 2022-2032
Figure 70: North America Active Wear Market Attractiveness by Price Range, 2022-2032
Figure 71: North America Active Wear Market Attractiveness by Sales Channel, 2022-2032
Figure 72: North America Active Wear Market Attractiveness by Country, 2022-2032
Figure 73: Latin America Active Wear Market Value (US$ Mn) by Product Type, 2022-2032
Figure 74: Latin America Active Wear Market Value (US$ Mn) by Material Type, 2022-2032
Figure 75: Latin America Active Wear Market Value (US$ Mn) by End Usr , 2022-2032
Figure 76: Latin America Active Wear Market Value (US$ Mn) by Price Range, 2022-2032
Figure 77: Latin America Active Wear Market Value (US$ Mn) by Sales Channel, 2022-2032
Figure 78: Latin America Active Wear Market Value (US$ Mn) by Country, 2022-2032
Figure 79: Latin America Active Wear Market Value (US$ Mn) Analysis by Country, 2017-2032
Figure 80: Latin America Active Wear Market Volume (Units) Analysis by Country, 2017-2032
Figure 81: Latin America Active Wear Market Value Share (%) and BPS Analysis by Country, 2022-2032
Figure 82: Latin America Active Wear Market Y-o-Y Growth (%) Projections by Country, 2022-2032
Figure 83: Latin America Active Wear Market Value (US$ Mn) Analysis by Product Type, 2017-2032
Figure 84: Latin America Active Wear Market Volume (Units) Analysis by Product Type, 2017-2032
Figure 85: Latin America Active Wear Market Value Share (%) and BPS Analysis by Product Type, 2022-2032
Figure 86: Latin America Active Wear Market Y-o-Y Growth (%) Projections by Product Type, 2022-2032
Figure 87: Latin America Active Wear Market Value (US$ Mn) Analysis by Material Type, 2017-2032
Figure 88: Latin America Active Wear Market Volume (Units) Analysis by Material Type, 2017-2032
Figure 89: Latin America Active Wear Market Value Share (%) and BPS Analysis by Material Type, 2022-2032
Figure 90: Latin America Active Wear Market Y-o-Y Growth (%) Projections by Material Type, 2022-2032
Figure 91: Latin America Active Wear Market Value (US$ Mn) Analysis by End Usr , 2017-2032
Figure 92: Latin America Active Wear Market Volume (Units) Analysis by End Usr , 2017-2032
Figure 93: Latin America Active Wear Market Value Share (%) and BPS Analysis by End Usr , 2022-2032
Figure 94: Latin America Active Wear Market Y-o-Y Growth (%) Projections by End Usr , 2022-2032
Figure 95: Latin America Active Wear Market Value (US$ Mn) Analysis by Price Range, 2017-2032
Figure 96: Latin America Active Wear Market Volume (Units) Analysis by Price Range, 2017-2032
Figure 97: Latin America Active Wear Market Value Share (%) and BPS Analysis by Price Range, 2022-2032
Figure 98: Latin America Active Wear Market Y-o-Y Growth (%) Projections by Price Range, 2022-2032
Figure 99: Latin America Active Wear Market Value (US$ Mn) Analysis by Sales Channel, 2017-2032
Figure 100: Latin America Active Wear Market Volume (Units) Analysis by Sales Channel, 2017-2032
Figure 101: Latin America Active Wear Market Value Share (%) and BPS Analysis by Sales Channel, 2022-2032
Figure 102: Latin America Active Wear Market Y-o-Y Growth (%) Projections by Sales Channel, 2022-2032
Figure 103: Latin America Active Wear Market Attractiveness by Product Type, 2022-2032
Figure 104: Latin America Active Wear Market Attractiveness by Material Type, 2022-2032
Figure 105: Latin America Active Wear Market Attractiveness by End Usr , 2022-2032
Figure 106: Latin America Active Wear Market Attractiveness by Price Range, 2022-2032
Figure 107: Latin America Active Wear Market Attractiveness by Sales Channel, 2022-2032
Figure 108: Latin America Active Wear Market Attractiveness by Country, 2022-2032
Figure 109: Europe Active Wear Market Value (US$ Mn) by Product Type, 2022-2032
Figure 110: Europe Active Wear Market Value (US$ Mn) by Material Type, 2022-2032
Figure 111: Europe Active Wear Market Value (US$ Mn) by End Usr , 2022-2032
Figure 112: Europe Active Wear Market Value (US$ Mn) by Price Range, 2022-2032
Figure 113: Europe Active Wear Market Value (US$ Mn) by Sales Channel, 2022-2032
Figure 114: Europe Active Wear Market Value (US$ Mn) by Country, 2022-2032
Figure 115: Europe Active Wear Market Value (US$ Mn) Analysis by Country, 2017-2032
Figure 116: Europe Active Wear Market Volume (Units) Analysis by Country, 2017-2032
Figure 117: Europe Active Wear Market Value Share (%) and BPS Analysis by Country, 2022-2032
Figure 118: Europe Active Wear Market Y-o-Y Growth (%) Projections by Country, 2022-2032
Figure 119: Europe Active Wear Market Value (US$ Mn) Analysis by Product Type, 2017-2032
Figure 120: Europe Active Wear Market Volume (Units) Analysis by Product Type, 2017-2032
Figure 121: Europe Active Wear Market Value Share (%) and BPS Analysis by Product Type, 2022-2032
Figure 122: Europe Active Wear Market Y-o-Y Growth (%) Projections by Product Type, 2022-2032
Figure 123: Europe Active Wear Market Value (US$ Mn) Analysis by Material Type, 2017-2032
Figure 124: Europe Active Wear Market Volume (Units) Analysis by Material Type, 2017-2032
Figure 125: Europe Active Wear Market Value Share (%) and BPS Analysis by Material Type, 2022-2032
Figure 126: Europe Active Wear Market Y-o-Y Growth (%) Projections by Material Type, 2022-2032
Figure 127: Europe Active Wear Market Value (US$ Mn) Analysis by End Usr , 2017-2032
Figure 128: Europe Active Wear Market Volume (Units) Analysis by End Usr , 2017-2032
Figure 129: Europe Active Wear Market Value Share (%) and BPS Analysis by End Usr , 2022-2032
Figure 130: Europe Active Wear Market Y-o-Y Growth (%) Projections by End Usr , 2022-2032
Figure 131: Europe Active Wear Market Value (US$ Mn) Analysis by Price Range, 2017-2032
Figure 132: Europe Active Wear Market Volume (Units) Analysis by Price Range, 2017-2032
Figure 133: Europe Active Wear Market Value Share (%) and BPS Analysis by Price Range, 2022-2032
Figure 134: Europe Active Wear Market Y-o-Y Growth (%) Projections by Price Range, 2022-2032
Figure 135: Europe Active Wear Market Value (US$ Mn) Analysis by Sales Channel, 2017-2032
Figure 136: Europe Active Wear Market Volume (Units) Analysis by Sales Channel, 2017-2032
Figure 137: Europe Active Wear Market Value Share (%) and BPS Analysis by Sales Channel, 2022-2032
Figure 138: Europe Active Wear Market Y-o-Y Growth (%) Projections by Sales Channel, 2022-2032
Figure 139: Europe Active Wear Market Attractiveness by Product Type, 2022-2032
Figure 140: Europe Active Wear Market Attractiveness by Material Type, 2022-2032
Figure 141: Europe Active Wear Market Attractiveness by End Usr , 2022-2032
Figure 142: Europe Active Wear Market Attractiveness by Price Range, 2022-2032
Figure 143: Europe Active Wear Market Attractiveness by Sales Channel, 2022-2032
Figure 144: Europe Active Wear Market Attractiveness by Country, 2022-2032
Figure 145: East Asia Active Wear Market Value (US$ Mn) by Product Type, 2022-2032
Figure 146: East Asia Active Wear Market Value (US$ Mn) by Material Type, 2022-2032
Figure 147: East Asia Active Wear Market Value (US$ Mn) by End Usr , 2022-2032
Figure 148: East Asia Active Wear Market Value (US$ Mn) by Price Range, 2022-2032
Figure 149: East Asia Active Wear Market Value (US$ Mn) by Sales Channel, 2022-2032
Figure 150: East Asia Active Wear Market Value (US$ Mn) by Country, 2022-2032
Figure 151: East Asia Active Wear Market Value (US$ Mn) Analysis by Country, 2017-2032
Figure 152: East Asia Active Wear Market Volume (Units) Analysis by Country, 2017-2032
Figure 153: East Asia Active Wear Market Value Share (%) and BPS Analysis by Country, 2022-2032
Figure 154: East Asia Active Wear Market Y-o-Y Growth (%) Projections by Country, 2022-2032
Figure 155: East Asia Active Wear Market Value (US$ Mn) Analysis by Product Type, 2017-2032
Figure 156: East Asia Active Wear Market Volume (Units) Analysis by Product Type, 2017-2032
Figure 157: East Asia Active Wear Market Value Share (%) and BPS Analysis by Product Type, 2022-2032
Figure 158: East Asia Active Wear Market Y-o-Y Growth (%) Projections by Product Type, 2022-2032
Figure 159: East Asia Active Wear Market Value (US$ Mn) Analysis by Material Type, 2017-2032
Figure 160: East Asia Active Wear Market Volume (Units) Analysis by Material Type, 2017-2032
Figure 161: East Asia Active Wear Market Value Share (%) and BPS Analysis by Material Type, 2022-2032
Figure 162: East Asia Active Wear Market Y-o-Y Growth (%) Projections by Material Type, 2022-2032
Figure 163: East Asia Active Wear Market Value (US$ Mn) Analysis by End Usr , 2017-2032
Figure 164: East Asia Active Wear Market Volume (Units) Analysis by End Usr , 2017-2032
Figure 165: East Asia Active Wear Market Value Share (%) and BPS Analysis by End Usr , 2022-2032
Figure 166: East Asia Active Wear Market Y-o-Y Growth (%) Projections by End Usr , 2022-2032
Figure 167: East Asia Active Wear Market Value (US$ Mn) Analysis by Price Range, 2017-2032
Figure 168: East Asia Active Wear Market Volume (Units) Analysis by Price Range, 2017-2032
Figure 169: East Asia Active Wear Market Value Share (%) and BPS Analysis by Price Range, 2022-2032
Figure 170: East Asia Active Wear Market Y-o-Y Growth (%) Projections by Price Range, 2022-2032
Figure 171: East Asia Active Wear Market Value (US$ Mn) Analysis by Sales Channel, 2017-2032
Figure 172: East Asia Active Wear Market Volume (Units) Analysis by Sales Channel, 2017-2032
Figure 173: East Asia Active Wear Market Value Share (%) and BPS Analysis by Sales Channel, 2022-2032
Figure 174: East Asia Active Wear Market Y-o-Y Growth (%) Projections by Sales Channel, 2022-2032
Figure 175: East Asia Active Wear Market Attractiveness by Product Type, 2022-2032
Figure 176: East Asia Active Wear Market Attractiveness by Material Type, 2022-2032
Figure 177: East Asia Active Wear Market Attractiveness by End Usr , 2022-2032
Figure 178: East Asia Active Wear Market Attractiveness by Price Range, 2022-2032
Figure 179: East Asia Active Wear Market Attractiveness by Sales Channel, 2022-2032
Figure 180: East Asia Active Wear Market Attractiveness by Country, 2022-2032
Figure 181: South Asia Active Wear Market Value (US$ Mn) by Product Type, 2022-2032
Figure 182: South Asia Active Wear Market Value (US$ Mn) by Material Type, 2022-2032
Figure 183: South Asia Active Wear Market Value (US$ Mn) by End Usr , 2022-2032
Figure 184: South Asia Active Wear Market Value (US$ Mn) by Price Range, 2022-2032
Figure 185: South Asia Active Wear Market Value (US$ Mn) by Sales Channel, 2022-2032
Figure 186: South Asia Active Wear Market Value (US$ Mn) by Country, 2022-2032
Figure 187: South Asia Active Wear Market Value (US$ Mn) Analysis by Country, 2017-2032
Figure 188: South Asia Active Wear Market Volume (Units) Analysis by Country, 2017-2032
Figure 189: South Asia Active Wear Market Value Share (%) and BPS Analysis by Country, 2022-2032
Figure 190: South Asia Active Wear Market Y-o-Y Growth (%) Projections by Country, 2022-2032
Figure 191: South Asia Active Wear Market Value (US$ Mn) Analysis by Product Type, 2017-2032
Figure 192: South Asia Active Wear Market Volume (Units) Analysis by Product Type, 2017-2032
Figure 193: South Asia Active Wear Market Value Share (%) and BPS Analysis by Product Type, 2022-2032
Figure 194: South Asia Active Wear Market Y-o-Y Growth (%) Projections by Product Type, 2022-2032
Figure 195: South Asia Active Wear Market Value (US$ Mn) Analysis by Material Type, 2017-2032
Figure 196: South Asia Active Wear Market Volume (Units) Analysis by Material Type, 2017-2032
Figure 197: South Asia Active Wear Market Value Share (%) and BPS Analysis by Material Type, 2022-2032
Figure 198: South Asia Active Wear Market Y-o-Y Growth (%) Projections by Material Type, 2022-2032
Figure 199: South Asia Active Wear Market Value (US$ Mn) Analysis by End Usr , 2017-2032
Figure 200: South Asia Active Wear Market Volume (Units) Analysis by End Usr , 2017-2032
Figure 201: South Asia Active Wear Market Value Share (%) and BPS Analysis by End Usr , 2022-2032
Figure 202: South Asia Active Wear Market Y-o-Y Growth (%) Projections by End Usr , 2022-2032
Figure 203: South Asia Active Wear Market Value (US$ Mn) Analysis by Price Range, 2017-2032
Figure 204: South Asia Active Wear Market Volume (Units) Analysis by Price Range, 2017-2032
Figure 205: South Asia Active Wear Market Value Share (%) and BPS Analysis by Price Range, 2022-2032
Figure 206: South Asia Active Wear Market Y-o-Y Growth (%) Projections by Price Range, 2022-2032
Figure 207: South Asia Active Wear Market Value (US$ Mn) Analysis by Sales Channel, 2017-2032
Figure 208: South Asia Active Wear Market Volume (Units) Analysis by Sales Channel, 2017-2032
Figure 209: South Asia Active Wear Market Value Share (%) and BPS Analysis by Sales Channel, 2022-2032
Figure 210: South Asia Active Wear Market Y-o-Y Growth (%) Projections by Sales Channel, 2022-2032
Figure 211: South Asia Active Wear Market Attractiveness by Product Type, 2022-2032
Figure 212: South Asia Active Wear Market Attractiveness by Material Type, 2022-2032
Figure 213: South Asia Active Wear Market Attractiveness by End Usr , 2022-2032
Figure 214: South Asia Active Wear Market Attractiveness by Price Range, 2022-2032
Figure 215: South Asia Active Wear Market Attractiveness by Sales Channel, 2022-2032
Figure 216: South Asia Active Wear Market Attractiveness by Country, 2022-2032
Figure 217: Oceania Active Wear Market Value (US$ Mn) by Product Type, 2022-2032
Figure 218: Oceania Active Wear Market Value (US$ Mn) by Material Type, 2022-2032
Figure 219: Oceania Active Wear Market Value (US$ Mn) by End Usr , 2022-2032
Figure 220: Oceania Active Wear Market Value (US$ Mn) by Price Range, 2022-2032
Figure 221: Oceania Active Wear Market Value (US$ Mn) by Sales Channel, 2022-2032
Figure 222: Oceania Active Wear Market Value (US$ Mn) by Country, 2022-2032
Figure 223: Oceania Active Wear Market Value (US$ Mn) Analysis by Country, 2017-2032
Figure 224: Oceania Active Wear Market Volume (Units) Analysis by Country, 2017-2032
Figure 225: Oceania Active Wear Market Value Share (%) and BPS Analysis by Country, 2022-2032
Figure 226: Oceania Active Wear Market Y-o-Y Growth (%) Projections by Country, 2022-2032
Figure 227: Oceania Active Wear Market Value (US$ Mn) Analysis by Product Type, 2017-2032
Figure 228: Oceania Active Wear Market Volume (Units) Analysis by Product Type, 2017-2032
Figure 229: Oceania Active Wear Market Value Share (%) and BPS Analysis by Product Type, 2022-2032
Figure 230: Oceania Active Wear Market Y-o-Y Growth (%) Projections by Product Type, 2022-2032
Figure 231: Oceania Active Wear Market Value (US$ Mn) Analysis by Material Type, 2017-2032
Figure 232: Oceania Active Wear Market Volume (Units) Analysis by Material Type, 2017-2032
Figure 233: Oceania Active Wear Market Value Share (%) and BPS Analysis by Material Type, 2022-2032
Figure 234: Oceania Active Wear Market Y-o-Y Growth (%) Projections by Material Type, 2022-2032
Figure 235: Oceania Active Wear Market Value (US$ Mn) Analysis by End Usr , 2017-2032
Figure 236: Oceania Active Wear Market Volume (Units) Analysis by End Usr , 2017-2032
Figure 237: Oceania Active Wear Market Value Share (%) and BPS Analysis by End Usr , 2022-2032
Figure 238: Oceania Active Wear Market Y-o-Y Growth (%) Projections by End Usr , 2022-2032
Figure 239: Oceania Active Wear Market Value (US$ Mn) Analysis by Price Range, 2017-2032
Figure 240: Oceania Active Wear Market Volume (Units) Analysis by Price Range, 2017-2032
Figure 241: Oceania Active Wear Market Value Share (%) and BPS Analysis by Price Range, 2022-2032
Figure 242: Oceania Active Wear Market Y-o-Y Growth (%) Projections by Price Range, 2022-2032
Figure 243: Oceania Active Wear Market Value (US$ Mn) Analysis by Sales Channel, 2017-2032
Figure 244: Oceania Active Wear Market Volume (Units) Analysis by Sales Channel, 2017-2032
Figure 245: Oceania Active Wear Market Value Share (%) and BPS Analysis by Sales Channel, 2022-2032
Figure 246: Oceania Active Wear Market Y-o-Y Growth (%) Projections by Sales Channel, 2022-2032
Figure 247: Oceania Active Wear Market Attractiveness by Product Type, 2022-2032
Figure 248: Oceania Active Wear Market Attractiveness by Material Type, 2022-2032
Figure 249: Oceania Active Wear Market Attractiveness by End Usr , 2022-2032
Figure 250: Oceania Active Wear Market Attractiveness by Price Range, 2022-2032
Figure 251: Oceania Active Wear Market Attractiveness by Sales Channel, 2022-2032
Figure 252: Oceania Active Wear Market Attractiveness by Country, 2022-2032
Figure 253: MEA Active Wear Market Value (US$ Mn) by Product Type, 2022-2032
Figure 254: MEA Active Wear Market Value (US$ Mn) by Material Type, 2022-2032
Figure 255: MEA Active Wear Market Value (US$ Mn) by End Usr , 2022-2032
Figure 256: MEA Active Wear Market Value (US$ Mn) by Price Range, 2022-2032
Figure 257: MEA Active Wear Market Value (US$ Mn) by Sales Channel, 2022-2032
Figure 258: MEA Active Wear Market Value (US$ Mn) by Country, 2022-2032
Figure 259: MEA Active Wear Market Value (US$ Mn) Analysis by Country, 2017-2032
Figure 260: MEA Active Wear Market Volume (Units) Analysis by Country, 2017-2032
Figure 261: MEA Active Wear Market Value Share (%) and BPS Analysis by Country, 2022-2032
Figure 262: MEA Active Wear Market Y-o-Y Growth (%) Projections by Country, 2022-2032
Figure 263: MEA Active Wear Market Value (US$ Mn) Analysis by Product Type, 2017-2032
Figure 264: MEA Active Wear Market Volume (Units) Analysis by Product Type, 2017-2032
Figure 265: MEA Active Wear Market Value Share (%) and BPS Analysis by Product Type, 2022-2032
Figure 266: MEA Active Wear Market Y-o-Y Growth (%) Projections by Product Type, 2022-2032
Figure 267: MEA Active Wear Market Value (US$ Mn) Analysis by Material Type, 2017-2032
Figure 268: MEA Active Wear Market Volume (Units) Analysis by Material Type, 2017-2032
Figure 269: MEA Active Wear Market Value Share (%) and BPS Analysis by Material Type, 2022-2032
Figure 270: MEA Active Wear Market Y-o-Y Growth (%) Projections by Material Type, 2022-2032
Figure 271: MEA Active Wear Market Value (US$ Mn) Analysis by End Usr , 2017-2032
Figure 272: MEA Active Wear Market Volume (Units) Analysis by End Usr , 2017-2032
Figure 273: MEA Active Wear Market Value Share (%) and BPS Analysis by End Usr , 2022-2032
Figure 274: MEA Active Wear Market Y-o-Y Growth (%) Projections by End Usr , 2022-2032
Figure 275: MEA Active Wear Market Value (US$ Mn) Analysis by Price Range, 2017-2032
Figure 276: MEA Active Wear Market Volume (Units) Analysis by Price Range, 2017-2032
Figure 277: MEA Active Wear Market Value Share (%) and BPS Analysis by Price Range, 2022-2032
Figure 278: MEA Active Wear Market Y-o-Y Growth (%) Projections by Price Range, 2022-2032
Figure 279: MEA Active Wear Market Value (US$ Mn) Analysis by Sales Channel, 2017-2032
Figure 280: MEA Active Wear Market Volume (Units) Analysis by Sales Channel, 2017-2032
Figure 281: MEA Active Wear Market Value Share (%) and BPS Analysis by Sales Channel, 2022-2032
Figure 282: MEA Active Wear Market Y-o-Y Growth (%) Projections by Sales Channel, 2022-2032
Figure 283: MEA Active Wear Market Attractiveness by Product Type, 2022-2032
Figure 284: MEA Active Wear Market Attractiveness by Material Type, 2022-2032
Figure 285: MEA Active Wear Market Attractiveness by End Usr , 2022-2032
Figure 286: MEA Active Wear Market Attractiveness by Price Range, 2022-2032
Figure 287: MEA Active Wear Market Attractiveness by Sales Channel, 2022-2032
Figure 288: MEA Active Wear Market Attractiveness by Country, 2022-2032
Need specific information?
Request CustomizationExplore Consumer Product Insights
View Reports