Maternity Activewear Market Outlook

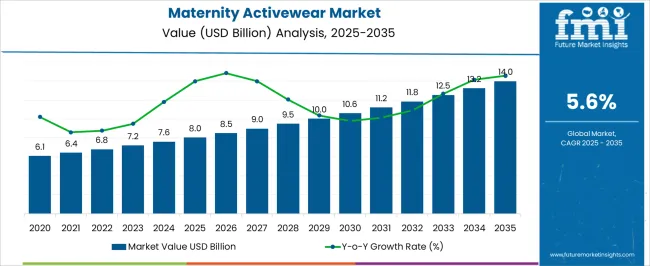
Following an in-depth exploration of the maternity activewear domain, FMI discloses a fresh report illuminating its market trajectory. With a captivating narrative, the current market value for maternity activewear stands tall at USD 7.6 billion in 2024, a testament to its burgeoning allure. Propelled by this momentum, projections soar skyward, envisioning a dazzling ascent to a market worth USD 13.3 billion by 2034, guided by a moderate CAGR of 5.7%.

Attributes Details
Maternity Activewear Market Value for 2024 USD 7.6 billion
Maternity Activewear Market Value for 2034 USD 13.3 billion
Maternity Activewear Market Forecast CAGR for 2024 to 2034 5.7%

Flourishment of Past and Future of the Maternity Activewear Market

Historical CAGR (2019 to 2023) 4.60%
Forecast CAGR (2024 to 2024) 5.70%

From 2019 to 2023, the market witnessed a CAGR of 4.60%, reflecting a gradual but consistent rise in demand. This period saw a boom in awareness of the importance of comfortable and stylish activewear tailored to the needs of expecting mothers.

With a projected CAGR of 5.70% from 2024 to 2034, the future holds promise for further advancement and innovation in this segment. Factors such as shifting consumer preferences towards more active lifestyles during pregnancy, coupled with advancements in fabric technology and design, are expected to fuel demand for maternity activewear.

As the market continues to evolve, embracing inclusivity, sustainability, and versatility, it paves the way for a flourishing future where expecting mothers can confidently embrace their active lifestyles with comfort and style.

Key Factors Accelerating the Maternity Activewear Market

Expecting mothers are prioritizing fitness and well-being, leading to a higher demand for activewear that offers comfort, support, and style.

  • Maternity activewear brands are innovating with designs that seamlessly blend fashion and functionality.
  • Consumers seek apparel that not only caters to their physical needs but also aligns with their sense of style.
  • The introduction of trendy and versatile options propels the market.
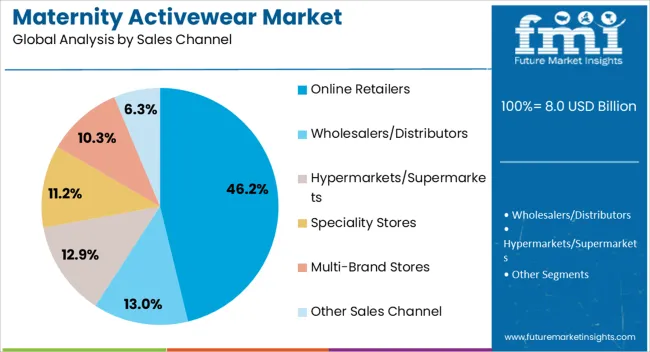
  • The proliferation of online shopping platforms has made it easier for pregnant women to access a wide range of maternity activewear options from the comfort of their homes.

Challenges and Risks of Investing in the Maternity Activewear Market

  • Despite advancements in the maternity activewear market, some brands still offer limited size and style options, which may not cater to the diverse needs and preferences of pregnant women.
  • Maternity activewear often comes with a higher price tag compared to regular activewear due to specialized designs and materials. This can deter price-sensitive consumers from investing in these products, particularly if they perceive them as non-essential or if they have budget constraints during pregnancy.
  • Some consumers may perceive maternity activewear as less durable compared to regular activewear, leading to concerns about longevity and value for money.

Category-wise Insights

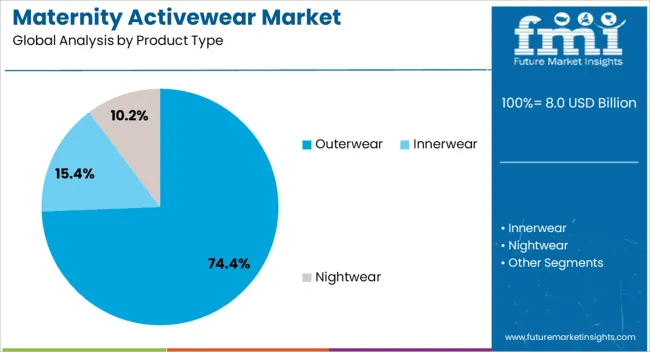
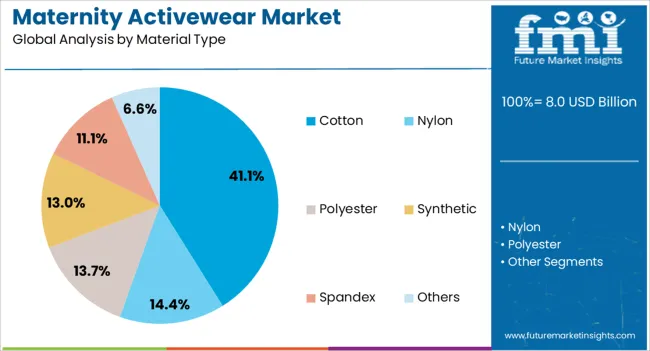
The below section shows the leading segment. Based on product type, the outerwear segment is accounted to hold a market share of 74.4% in 2024. Based on material type, the cotton segment is accounted to hold a market share of 41.1% in 2024.

Category Market Share in 2024
Outerwear 74.4%
Cotton 41.1%

Outerwear Segment to Hold a Significant Share in the Market

Based on product type, the outerwear sector is accounted to hold a market share of 74.4% in 2024. The dominance can be attributed to the essential role that outerwear plays in providing expecting mothers with comfort, support, and versatility during their active pursuits.

Outerwear pieces such as maternity jackets, hoodies, and pullovers are designed to accommodate a growing belly while offering protection from the elements, making them indispensable staples for pregnant women leading active lifestyles.

Cotton Segment to Hold a Dominant Share in the Market

Based on material type, the cotton segment is accounted to hold a market share of 41.1% in 2024. Expecting mothers gravitate towards cotton-based activewear pieces for their ability to provide gentle support, regulate body temperature, and ensure maximum comfort during workouts, yoga sessions, or everyday activities.

The popularity of cotton reflects consumers' preference for natural, skin-friendly materials that prioritize both comfort and performance in maternity activewear.

Country-wise Insights

The table mentions the top five countries ranked by revenue, with Singapore holding the top position. In Singapore, the maternity activewear market dominates by offering a range of stylish and comfortable options tailored to expectant mothers' needs.

With a focus on functionality and fashion, brands cater to the active lifestyles of the women of Singapore during pregnancy, capturing a significant market share of the maternity activewear market.

Forecast CAGRs from 2024 to 2034

Countries CAGR
The United States 5.9%
The United Kingdom 6.5%
Japan 9.7%
Singapore 10.4%
India 9.2%

Rising Affluence of Expecting Mothers Provides Greater Demand for Maternity Activewear in the United States

In the United States, the maternity activewear market is primarily utilized by expecting mothers who prioritize fitness and wellness throughout their pregnancy journey.

With a strong emphasis on health-conscious lifestyles, pregnant women in the United States seek activewear that provides both comfort and functionality, allowing them to engage in various forms of exercise and physical activity to support their well-being during pregnancy.

Style and Practicality Finds a Sustaining Demand for Maternity Activewear in the United Kingdom

In the United Kingdom, the maternity activewear market caters to expecting mothers who value both style and practicality.

With a growing emphasis on fashion-forward maternity wear, British pregnant women seek activewear that seamlessly blends trendy designs with functional features, allowing them to maintain an active lifestyle while embracing their sense of style during pregnancy.

Thriving Need of Maternity Activewear for Comfort and Quality Impresses the Market in Japan

In Japan, the maternity activewear market is majorly used by expecting mothers who prioritize comfort and quality in their apparel choices.

Focus on meticulous design and attention to detail leads the pregnant women of Japan to seek activewear that offers superior comfort and support, allowing them to navigate their daily activities with ease and confidence throughout their pregnancy.

Boom in Maternity Activewear Required for Exercise and Leisure Activities in Singapore

In Singapore, the market caters to expecting mothers who lead active and dynamic lifestyles. With a bustling urban environment and a strong emphasis on fitness and wellness, pregnant women in Singapore seek activewear that enables them to stay active and engaged in various forms of exercise and leisure activities while ensuring maximum comfort and flexibility during their pregnancy.

India Holds a Prominent Position in the Maternity Activewear Market

With a diverse cultural landscape and a growing trend towards fitness and well-being, pregnant women in India seek activewear that combines traditional aesthetics with contemporary designs. The maternity activewear allows them to maintain an active lifestyle while staying true to their cultural heritage during pregnancy.
Competitive Landscape

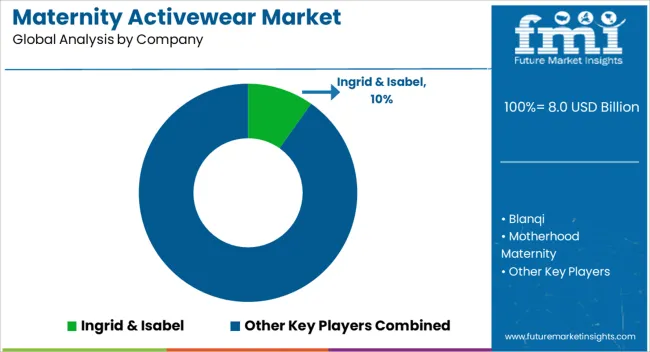
Emerging players innovate with eco-friendly materials and inclusive sizing options, challenging traditional market leaders.

Differentiation is achieved through a blend of fashion-forward designs, innovative fabric technologies, and personalized customer experiences as brands vie to capture the attention and loyalty of expecting mothers seeking comfort, style, and functionality in their maternity activewear choices.

Some of the key developments

  • In March 2024, H&M Group and Vargas Holding unveiled Syre, and its collaboration aimed at advancing textile-to-textile recycled polyester, marking a significant stride toward sustainability in the fashion industry.
  • In March 2024, Converse launched the Chuck Taylor All-Star Play Lite CX, tailored specifically for Kids, promising a fusion of comfort, style, and durability to delight young sneaker enthusiasts.

Key Coverage in the Maternity Activewear Industry Report

  • Adjacent Study on Maternity Activewear Market, Maternity Wear Market, Maternity Intimate Wear Market, Maternity Apparel Market
  • Singapore Maternity Activewear Market
  • Maternity Activewear Market Size, Current Insights, and Demographic Trends
  • Global Maternity Activewear Market Growth Opportunities
  • Key Strategies in the Global Maternity Activewear Market

Report Scope

Attributes Details
Estimated Market Size in 2024 USD 7.6 billion
Projected Market Valuation in 2034 USD 13.3 billion
Value-based CAGR 2024 to 2034 5.7%
Forecast Period 2024 to 2034
Historical Data Available for 2019 to 2023
Market Analysis Value in USD billion
Key Regions Covered North America; Latin America; Western Europe; Eastern Europe; South Asia and Pacific; East Asia; Middle East and Africa
Key Market Segments Covered Product Type, Material Type, Sales Channel, Region
Key Countries Profiled The United States, Canada, Brazil, Mexico, Germany, The United Kingdom, France, Spain, Italy, Russia, Poland, Czech Republic, Romania, India, Bangladesh, Australia, New Zealand, China, Japan, South Korea, GCC countries, South Africa, Israel
Key Companies Profiled Ingrid & Isabel; Blanqi; Motherhood Maternity; Seraphine; Active Truth; FittaMamma; Cadenshae; Cake Maternity; HATCH; Mumberry; Boob Design; Noppies; Beyond Yoga (Maternity Collection); Gap Maternity; PinkBlush Maternity

Key Segments

By Product Type:

  • Outerwear
    • Tops
    • Tunics
    • Bottom
    • Dresses
    • Others
  • Innerwear
    • Lingeries
    • Camisoles
    • Others
  • Nightwear

By Material Type:

  • Cotton
  • Nylon
  • Polyester
  • Synthetic
  • Spandex
  • Others

By Sales Channel:

  • Wholesalers/Distributors
  • Hypermarkets/Supermarkets
  • Speciality Stores
  • Multi-Brand Stores
  • Online Retailers
  • Other Sales Channel

By Region:

  • North America
  • Latin America
  • Western Europe
  • Eastern Europe
  • South Asia and Pacific
  • East Asia
  • The Middle East and Africa

Table of Content

  • 1. Executive Summary
  • 2. Market Overview
  • 3. Market Background
  • 4. Global Market Analysis 2019 to 2023 and Forecast, 2024 to 2034
  • 5. Global Market Analysis 2019 to 2023 and Forecast 2024 to 2034, By Product Type
    • 5.1. Outerwear
      • 5.1.1. Tops
      • 5.1.2. Tunics
      • 5.1.3. Bottom
      • 5.1.4. Dresses
      • 5.1.5. Others
    • 5.2. Innerwear
      • 5.2.1. Lingeries
      • 5.2.2. Camisoles
      • 5.2.3. Others
    • 5.3. Nightwear
  • 6. Global Market Analysis 2019 to 2023 and Forecast 2024 to 2034, By Material Type
    • 6.1. Cotton
    • 6.2. Nylon
    • 6.3. Polyester
    • 6.4. Synthetic
    • 6.5. Spandex
    • 6.6. Others
  • 7. Global Market Analysis 2019 to 2023 and Forecast 2024 to 2034, By Sales Channel
    • 7.1. Wholesalers/Distributors
    • 7.2. Hypermarkets/Supermarkets
    • 7.3. Specialty Stores
    • 7.4. Multi-Brand Stores
    • 7.5. Online Retailers
    • 7.6. Others
  • 8. Global Market Analysis 2019 to 2023 and Forecast 2024 to 2034, By Region
    • 8.1. North America
    • 8.2. Latin America
    • 8.3. Western Europe
    • 8.4. Eastern Europe
    • 8.5. South Asia and Pacific
    • 8.6. East Asia
    • 8.7. Middle East and Africa
  • 9. North America Market Analysis 2019 to 2023 and Forecast 2024 to 2034, By Country
  • 10. Latin America Market Analysis 2019 to 2023 and Forecast 2024 to 2034, By Country
  • 11. Western Europe Market Analysis 2019 to 2023 and Forecast 2024 to 2034, By Country
  • 12. Eastern Europe Market Analysis 2019 to 2023 and Forecast 2024 to 2034, By Country
  • 13. South Asia and Pacific Market Analysis 2019 to 2023 and Forecast 2024 to 2034, By Country
  • 14. East Asia Market Analysis 2019 to 2023 and Forecast 2024 to 2034, By Country
  • 15. Middle East and Africa Market Analysis 2019 to 2023 and Forecast 2024 to 2034, By Country
  • 16. Key Countries Market Analysis
  • 17. Market Structure Analysis
  • 18. Competition Analysis
    • 18.1. Ingrid & Isabel
    • 18.2. Blanqi
    • 18.3. Motherhood Maternity
    • 18.4. Seraphine
    • 18.5. Active Truth
    • 18.6. FittaMamma
    • 18.7. Cadenshae
    • 18.8. Cake Maternity
    • 18.9. HATCH
    • 18.10. Mumberry
    • 18.11. Boob Design
    • 18.12. Noppies
    • 18.13. Beyond Yoga (Maternity Collection)
    • 18.14. Gap Maternity
    • 18.15. PinkBlush Maternity
  • 19. Assumptions & Acronyms Used
  • 20. Research Methodology

List of Tables

Table 1: Global Market Value (US$ Million) Forecast by Region, 2019 to 2034

Table 2: Global Market Volume (Units) Forecast by Region, 2019 to 2034

Table 3: Global Market Value (US$ Million) Forecast by Product Type, 2019 to 2034

Table 4: Global Market Volume (Units) Forecast by Product Type, 2019 to 2034

Table 5: Global Market Value (US$ Million) Forecast by Material Type, 2019 to 2034

Table 6: Global Market Volume (Units) Forecast by Material Type, 2019 to 2034

Table 7: Global Market Value (US$ Million) Forecast by Sales Channel, 2019 to 2034

Table 8: Global Market Volume (Units) Forecast by Sales Channel, 2019 to 2034

Table 9: North America Market Value (US$ Million) Forecast by Country, 2019 to 2034

Table 10: North America Market Volume (Units) Forecast by Country, 2019 to 2034

Table 11: North America Market Value (US$ Million) Forecast by Product Type, 2019 to 2034

Table 12: North America Market Volume (Units) Forecast by Product Type, 2019 to 2034

Table 13: North America Market Value (US$ Million) Forecast by Material Type, 2019 to 2034

Table 14: North America Market Volume (Units) Forecast by Material Type, 2019 to 2034

Table 15: North America Market Value (US$ Million) Forecast by Sales Channel, 2019 to 2034

Table 16: North America Market Volume (Units) Forecast by Sales Channel, 2019 to 2034

Table 17: Latin America Market Value (US$ Million) Forecast by Country, 2019 to 2034

Table 18: Latin America Market Volume (Units) Forecast by Country, 2019 to 2034

Table 19: Latin America Market Value (US$ Million) Forecast by Product Type, 2019 to 2034

Table 20: Latin America Market Volume (Units) Forecast by Product Type, 2019 to 2034

Table 21: Latin America Market Value (US$ Million) Forecast by Material Type, 2019 to 2034

Table 22: Latin America Market Volume (Units) Forecast by Material Type, 2019 to 2034

Table 23: Latin America Market Value (US$ Million) Forecast by Sales Channel, 2019 to 2034

Table 24: Latin America Market Volume (Units) Forecast by Sales Channel, 2019 to 2034

Table 25: Western Europe Market Value (US$ Million) Forecast by Country, 2019 to 2034

Table 26: Western Europe Market Volume (Units) Forecast by Country, 2019 to 2034

Table 27: Western Europe Market Value (US$ Million) Forecast by Product Type, 2019 to 2034

Table 28: Western Europe Market Volume (Units) Forecast by Product Type, 2019 to 2034

Table 29: Western Europe Market Value (US$ Million) Forecast by Material Type, 2019 to 2034

Table 30: Western Europe Market Volume (Units) Forecast by Material Type, 2019 to 2034

Table 31: Western Europe Market Value (US$ Million) Forecast by Sales Channel, 2019 to 2034

Table 32: Western Europe Market Volume (Units) Forecast by Sales Channel, 2019 to 2034

Table 33: Eastern Europe Market Value (US$ Million) Forecast by Country, 2019 to 2034

Table 34: Eastern Europe Market Volume (Units) Forecast by Country, 2019 to 2034

Table 35: Eastern Europe Market Value (US$ Million) Forecast by Product Type, 2019 to 2034

Table 36: Eastern Europe Market Volume (Units) Forecast by Product Type, 2019 to 2034

Table 37: Eastern Europe Market Value (US$ Million) Forecast by Material Type, 2019 to 2034

Table 38: Eastern Europe Market Volume (Units) Forecast by Material Type, 2019 to 2034

Table 39: Eastern Europe Market Value (US$ Million) Forecast by Sales Channel, 2019 to 2034

Table 40: Eastern Europe Market Volume (Units) Forecast by Sales Channel, 2019 to 2034

Table 41: South Asia and Pacific Market Value (US$ Million) Forecast by Country, 2019 to 2034

Table 42: South Asia and Pacific Market Volume (Units) Forecast by Country, 2019 to 2034

Table 43: South Asia and Pacific Market Value (US$ Million) Forecast by Product Type, 2019 to 2034

Table 44: South Asia and Pacific Market Volume (Units) Forecast by Product Type, 2019 to 2034

Table 45: South Asia and Pacific Market Value (US$ Million) Forecast by Material Type, 2019 to 2034

Table 46: South Asia and Pacific Market Volume (Units) Forecast by Material Type, 2019 to 2034

Table 47: South Asia and Pacific Market Value (US$ Million) Forecast by Sales Channel, 2019 to 2034

Table 48: South Asia and Pacific Market Volume (Units) Forecast by Sales Channel, 2019 to 2034

Table 49: East Asia Market Value (US$ Million) Forecast by Country, 2019 to 2034

Table 50: East Asia Market Volume (Units) Forecast by Country, 2019 to 2034

Table 51: East Asia Market Value (US$ Million) Forecast by Product Type, 2019 to 2034

Table 52: East Asia Market Volume (Units) Forecast by Product Type, 2019 to 2034

Table 53: East Asia Market Value (US$ Million) Forecast by Material Type, 2019 to 2034

Table 54: East Asia Market Volume (Units) Forecast by Material Type, 2019 to 2034

Table 55: East Asia Market Value (US$ Million) Forecast by Sales Channel, 2019 to 2034

Table 56: East Asia Market Volume (Units) Forecast by Sales Channel, 2019 to 2034

Table 57: Middle East and Africa Market Value (US$ Million) Forecast by Country, 2019 to 2034

Table 58: Middle East and Africa Market Volume (Units) Forecast by Country, 2019 to 2034

Table 59: Middle East and Africa Market Value (US$ Million) Forecast by Product Type, 2019 to 2034

Table 60: Middle East and Africa Market Volume (Units) Forecast by Product Type, 2019 to 2034

Table 61: Middle East and Africa Market Value (US$ Million) Forecast by Material Type, 2019 to 2034

Table 62: Middle East and Africa Market Volume (Units) Forecast by Material Type, 2019 to 2034

Table 63: Middle East and Africa Market Value (US$ Million) Forecast by Sales Channel, 2019 to 2034

Table 64: Middle East and Africa Market Volume (Units) Forecast by Sales Channel, 2019 to 2034

List of Figures

Figure 1: Global Market Value (US$ Million) by Product Type, 2024 to 2034

Figure 2: Global Market Value (US$ Million) by Material Type, 2024 to 2034

Figure 3: Global Market Value (US$ Million) by Sales Channel, 2024 to 2034

Figure 4: Global Market Value (US$ Million) by Region, 2024 to 2034

Figure 5: Global Market Value (US$ Million) Analysis by Region, 2019 to 2034

Figure 6: Global Market Volume (Units) Analysis by Region, 2019 to 2034

Figure 7: Global Market Value Share (%) and BPS Analysis by Region, 2024 to 2034

Figure 8: Global Market Y-o-Y Growth (%) Projections by Region, 2024 to 2034

Figure 9: Global Market Value (US$ Million) Analysis by Product Type, 2019 to 2034

Figure 10: Global Market Volume (Units) Analysis by Product Type, 2019 to 2034

Figure 11: Global Market Value Share (%) and BPS Analysis by Product Type, 2024 to 2034

Figure 12: Global Market Y-o-Y Growth (%) Projections by Product Type, 2024 to 2034

Figure 13: Global Market Value (US$ Million) Analysis by Material Type, 2019 to 2034

Figure 14: Global Market Volume (Units) Analysis by Material Type, 2019 to 2034

Figure 15: Global Market Value Share (%) and BPS Analysis by Material Type, 2024 to 2034

Figure 16: Global Market Y-o-Y Growth (%) Projections by Material Type, 2024 to 2034

Figure 17: Global Market Value (US$ Million) Analysis by Sales Channel, 2019 to 2034

Figure 18: Global Market Volume (Units) Analysis by Sales Channel, 2019 to 2034

Figure 19: Global Market Value Share (%) and BPS Analysis by Sales Channel, 2024 to 2034

Figure 20: Global Market Y-o-Y Growth (%) Projections by Sales Channel, 2024 to 2034

Figure 21: Global Market Attractiveness by Product Type, 2024 to 2034

Figure 22: Global Market Attractiveness by Material Type, 2024 to 2034

Figure 23: Global Market Attractiveness by Sales Channel, 2024 to 2034

Figure 24: Global Market Attractiveness by Region, 2024 to 2034

Figure 25: North America Market Value (US$ Million) by Product Type, 2024 to 2034

Figure 26: North America Market Value (US$ Million) by Material Type, 2024 to 2034

Figure 27: North America Market Value (US$ Million) by Sales Channel, 2024 to 2034

Figure 28: North America Market Value (US$ Million) by Country, 2024 to 2034

Figure 29: North America Market Value (US$ Million) Analysis by Country, 2019 to 2034

Figure 30: North America Market Volume (Units) Analysis by Country, 2019 to 2034

Figure 31: North America Market Value Share (%) and BPS Analysis by Country, 2024 to 2034

Figure 32: North America Market Y-o-Y Growth (%) Projections by Country, 2024 to 2034

Figure 33: North America Market Value (US$ Million) Analysis by Product Type, 2019 to 2034

Figure 34: North America Market Volume (Units) Analysis by Product Type, 2019 to 2034

Figure 35: North America Market Value Share (%) and BPS Analysis by Product Type, 2024 to 2034

Figure 36: North America Market Y-o-Y Growth (%) Projections by Product Type, 2024 to 2034

Figure 37: North America Market Value (US$ Million) Analysis by Material Type, 2019 to 2034

Figure 38: North America Market Volume (Units) Analysis by Material Type, 2019 to 2034

Figure 39: North America Market Value Share (%) and BPS Analysis by Material Type, 2024 to 2034

Figure 40: North America Market Y-o-Y Growth (%) Projections by Material Type, 2024 to 2034

Figure 41: North America Market Value (US$ Million) Analysis by Sales Channel, 2019 to 2034

Figure 42: North America Market Volume (Units) Analysis by Sales Channel, 2019 to 2034

Figure 43: North America Market Value Share (%) and BPS Analysis by Sales Channel, 2024 to 2034

Figure 44: North America Market Y-o-Y Growth (%) Projections by Sales Channel, 2024 to 2034

Figure 45: North America Market Attractiveness by Product Type, 2024 to 2034

Figure 46: North America Market Attractiveness by Material Type, 2024 to 2034

Figure 47: North America Market Attractiveness by Sales Channel, 2024 to 2034

Figure 48: North America Market Attractiveness by Country, 2024 to 2034

Figure 49: Latin America Market Value (US$ Million) by Product Type, 2024 to 2034

Figure 50: Latin America Market Value (US$ Million) by Material Type, 2024 to 2034

Figure 51: Latin America Market Value (US$ Million) by Sales Channel, 2024 to 2034

Figure 52: Latin America Market Value (US$ Million) by Country, 2024 to 2034

Figure 53: Latin America Market Value (US$ Million) Analysis by Country, 2019 to 2034

Figure 54: Latin America Market Volume (Units) Analysis by Country, 2019 to 2034

Figure 55: Latin America Market Value Share (%) and BPS Analysis by Country, 2024 to 2034

Figure 56: Latin America Market Y-o-Y Growth (%) Projections by Country, 2024 to 2034

Figure 57: Latin America Market Value (US$ Million) Analysis by Product Type, 2019 to 2034

Figure 58: Latin America Market Volume (Units) Analysis by Product Type, 2019 to 2034

Figure 59: Latin America Market Value Share (%) and BPS Analysis by Product Type, 2024 to 2034

Figure 60: Latin America Market Y-o-Y Growth (%) Projections by Product Type, 2024 to 2034

Figure 61: Latin America Market Value (US$ Million) Analysis by Material Type, 2019 to 2034

Figure 62: Latin America Market Volume (Units) Analysis by Material Type, 2019 to 2034

Figure 63: Latin America Market Value Share (%) and BPS Analysis by Material Type, 2024 to 2034

Figure 64: Latin America Market Y-o-Y Growth (%) Projections by Material Type, 2024 to 2034

Figure 65: Latin America Market Value (US$ Million) Analysis by Sales Channel, 2019 to 2034

Figure 66: Latin America Market Volume (Units) Analysis by Sales Channel, 2019 to 2034

Figure 67: Latin America Market Value Share (%) and BPS Analysis by Sales Channel, 2024 to 2034

Figure 68: Latin America Market Y-o-Y Growth (%) Projections by Sales Channel, 2024 to 2034

Figure 69: Latin America Market Attractiveness by Product Type, 2024 to 2034

Figure 70: Latin America Market Attractiveness by Material Type, 2024 to 2034

Figure 71: Latin America Market Attractiveness by Sales Channel, 2024 to 2034

Figure 72: Latin America Market Attractiveness by Country, 2024 to 2034

Figure 73: Western Europe Market Value (US$ Million) by Product Type, 2024 to 2034

Figure 74: Western Europe Market Value (US$ Million) by Material Type, 2024 to 2034

Figure 75: Western Europe Market Value (US$ Million) by Sales Channel, 2024 to 2034

Figure 76: Western Europe Market Value (US$ Million) by Country, 2024 to 2034

Figure 77: Western Europe Market Value (US$ Million) Analysis by Country, 2019 to 2034

Figure 78: Western Europe Market Volume (Units) Analysis by Country, 2019 to 2034

Figure 79: Western Europe Market Value Share (%) and BPS Analysis by Country, 2024 to 2034

Figure 80: Western Europe Market Y-o-Y Growth (%) Projections by Country, 2024 to 2034

Figure 81: Western Europe Market Value (US$ Million) Analysis by Product Type, 2019 to 2034

Figure 82: Western Europe Market Volume (Units) Analysis by Product Type, 2019 to 2034

Figure 83: Western Europe Market Value Share (%) and BPS Analysis by Product Type, 2024 to 2034

Figure 84: Western Europe Market Y-o-Y Growth (%) Projections by Product Type, 2024 to 2034

Figure 85: Western Europe Market Value (US$ Million) Analysis by Material Type, 2019 to 2034

Figure 86: Western Europe Market Volume (Units) Analysis by Material Type, 2019 to 2034

Figure 87: Western Europe Market Value Share (%) and BPS Analysis by Material Type, 2024 to 2034

Figure 88: Western Europe Market Y-o-Y Growth (%) Projections by Material Type, 2024 to 2034

Figure 89: Western Europe Market Value (US$ Million) Analysis by Sales Channel, 2019 to 2034

Figure 90: Western Europe Market Volume (Units) Analysis by Sales Channel, 2019 to 2034

Figure 91: Western Europe Market Value Share (%) and BPS Analysis by Sales Channel, 2024 to 2034

Figure 92: Western Europe Market Y-o-Y Growth (%) Projections by Sales Channel, 2024 to 2034

Figure 93: Western Europe Market Attractiveness by Product Type, 2024 to 2034

Figure 94: Western Europe Market Attractiveness by Material Type, 2024 to 2034

Figure 95: Western Europe Market Attractiveness by Sales Channel, 2024 to 2034

Figure 96: Western Europe Market Attractiveness by Country, 2024 to 2034

Figure 97: Eastern Europe Market Value (US$ Million) by Product Type, 2024 to 2034

Figure 98: Eastern Europe Market Value (US$ Million) by Material Type, 2024 to 2034

Figure 99: Eastern Europe Market Value (US$ Million) by Sales Channel, 2024 to 2034

Figure 100: Eastern Europe Market Value (US$ Million) by Country, 2024 to 2034

Figure 101: Eastern Europe Market Value (US$ Million) Analysis by Country, 2019 to 2034

Figure 102: Eastern Europe Market Volume (Units) Analysis by Country, 2019 to 2034

Figure 103: Eastern Europe Market Value Share (%) and BPS Analysis by Country, 2024 to 2034

Figure 104: Eastern Europe Market Y-o-Y Growth (%) Projections by Country, 2024 to 2034

Figure 105: Eastern Europe Market Value (US$ Million) Analysis by Product Type, 2019 to 2034

Figure 106: Eastern Europe Market Volume (Units) Analysis by Product Type, 2019 to 2034

Figure 107: Eastern Europe Market Value Share (%) and BPS Analysis by Product Type, 2024 to 2034

Figure 108: Eastern Europe Market Y-o-Y Growth (%) Projections by Product Type, 2024 to 2034

Figure 109: Eastern Europe Market Value (US$ Million) Analysis by Material Type, 2019 to 2034

Figure 110: Eastern Europe Market Volume (Units) Analysis by Material Type, 2019 to 2034

Figure 111: Eastern Europe Market Value Share (%) and BPS Analysis by Material Type, 2024 to 2034

Figure 112: Eastern Europe Market Y-o-Y Growth (%) Projections by Material Type, 2024 to 2034

Figure 113: Eastern Europe Market Value (US$ Million) Analysis by Sales Channel, 2019 to 2034

Figure 114: Eastern Europe Market Volume (Units) Analysis by Sales Channel, 2019 to 2034

Figure 115: Eastern Europe Market Value Share (%) and BPS Analysis by Sales Channel, 2024 to 2034

Figure 116: Eastern Europe Market Y-o-Y Growth (%) Projections by Sales Channel, 2024 to 2034

Figure 117: Eastern Europe Market Attractiveness by Product Type, 2024 to 2034

Figure 118: Eastern Europe Market Attractiveness by Material Type, 2024 to 2034

Figure 119: Eastern Europe Market Attractiveness by Sales Channel, 2024 to 2034

Figure 120: Eastern Europe Market Attractiveness by Country, 2024 to 2034

Figure 121: South Asia and Pacific Market Value (US$ Million) by Product Type, 2024 to 2034

Figure 122: South Asia and Pacific Market Value (US$ Million) by Material Type, 2024 to 2034

Figure 123: South Asia and Pacific Market Value (US$ Million) by Sales Channel, 2024 to 2034

Figure 124: South Asia and Pacific Market Value (US$ Million) by Country, 2024 to 2034

Figure 125: South Asia and Pacific Market Value (US$ Million) Analysis by Country, 2019 to 2034

Figure 126: South Asia and Pacific Market Volume (Units) Analysis by Country, 2019 to 2034

Figure 127: South Asia and Pacific Market Value Share (%) and BPS Analysis by Country, 2024 to 2034

Figure 128: South Asia and Pacific Market Y-o-Y Growth (%) Projections by Country, 2024 to 2034

Figure 129: South Asia and Pacific Market Value (US$ Million) Analysis by Product Type, 2019 to 2034

Figure 130: South Asia and Pacific Market Volume (Units) Analysis by Product Type, 2019 to 2034

Figure 131: South Asia and Pacific Market Value Share (%) and BPS Analysis by Product Type, 2024 to 2034

Figure 132: South Asia and Pacific Market Y-o-Y Growth (%) Projections by Product Type, 2024 to 2034

Figure 133: South Asia and Pacific Market Value (US$ Million) Analysis by Material Type, 2019 to 2034

Figure 134: South Asia and Pacific Market Volume (Units) Analysis by Material Type, 2019 to 2034

Figure 135: South Asia and Pacific Market Value Share (%) and BPS Analysis by Material Type, 2024 to 2034

Figure 136: South Asia and Pacific Market Y-o-Y Growth (%) Projections by Material Type, 2024 to 2034

Figure 137: South Asia and Pacific Market Value (US$ Million) Analysis by Sales Channel, 2019 to 2034

Figure 138: South Asia and Pacific Market Volume (Units) Analysis by Sales Channel, 2019 to 2034

Figure 139: South Asia and Pacific Market Value Share (%) and BPS Analysis by Sales Channel, 2024 to 2034

Figure 140: South Asia and Pacific Market Y-o-Y Growth (%) Projections by Sales Channel, 2024 to 2034

Figure 141: South Asia and Pacific Market Attractiveness by Product Type, 2024 to 2034

Figure 142: South Asia and Pacific Market Attractiveness by Material Type, 2024 to 2034

Figure 143: South Asia and Pacific Market Attractiveness by Sales Channel, 2024 to 2034

Figure 144: South Asia and Pacific Market Attractiveness by Country, 2024 to 2034

Figure 145: East Asia Market Value (US$ Million) by Product Type, 2024 to 2034

Figure 146: East Asia Market Value (US$ Million) by Material Type, 2024 to 2034

Figure 147: East Asia Market Value (US$ Million) by Sales Channel, 2024 to 2034

Figure 148: East Asia Market Value (US$ Million) by Country, 2024 to 2034

Figure 149: East Asia Market Value (US$ Million) Analysis by Country, 2019 to 2034

Figure 150: East Asia Market Volume (Units) Analysis by Country, 2019 to 2034

Figure 151: East Asia Market Value Share (%) and BPS Analysis by Country, 2024 to 2034

Figure 152: East Asia Market Y-o-Y Growth (%) Projections by Country, 2024 to 2034

Figure 153: East Asia Market Value (US$ Million) Analysis by Product Type, 2019 to 2034

Figure 154: East Asia Market Volume (Units) Analysis by Product Type, 2019 to 2034

Figure 155: East Asia Market Value Share (%) and BPS Analysis by Product Type, 2024 to 2034

Figure 156: East Asia Market Y-o-Y Growth (%) Projections by Product Type, 2024 to 2034

Figure 157: East Asia Market Value (US$ Million) Analysis by Material Type, 2019 to 2034

Figure 158: East Asia Market Volume (Units) Analysis by Material Type, 2019 to 2034

Figure 159: East Asia Market Value Share (%) and BPS Analysis by Material Type, 2024 to 2034

Figure 160: East Asia Market Y-o-Y Growth (%) Projections by Material Type, 2024 to 2034

Figure 161: East Asia Market Value (US$ Million) Analysis by Sales Channel, 2019 to 2034

Figure 162: East Asia Market Volume (Units) Analysis by Sales Channel, 2019 to 2034

Figure 163: East Asia Market Value Share (%) and BPS Analysis by Sales Channel, 2024 to 2034

Figure 164: East Asia Market Y-o-Y Growth (%) Projections by Sales Channel, 2024 to 2034

Figure 165: East Asia Market Attractiveness by Product Type, 2024 to 2034

Figure 166: East Asia Market Attractiveness by Material Type, 2024 to 2034

Figure 167: East Asia Market Attractiveness by Sales Channel, 2024 to 2034

Figure 168: East Asia Market Attractiveness by Country, 2024 to 2034

Figure 169: Middle East and Africa Market Value (US$ Million) by Product Type, 2024 to 2034

Figure 170: Middle East and Africa Market Value (US$ Million) by Material Type, 2024 to 2034

Figure 171: Middle East and Africa Market Value (US$ Million) by Sales Channel, 2024 to 2034

Figure 172: Middle East and Africa Market Value (US$ Million) by Country, 2024 to 2034

Figure 173: Middle East and Africa Market Value (US$ Million) Analysis by Country, 2019 to 2034

Figure 174: Middle East and Africa Market Volume (Units) Analysis by Country, 2019 to 2034

Figure 175: Middle East and Africa Market Value Share (%) and BPS Analysis by Country, 2024 to 2034

Figure 176: Middle East and Africa Market Y-o-Y Growth (%) Projections by Country, 2024 to 2034

Figure 177: Middle East and Africa Market Value (US$ Million) Analysis by Product Type, 2019 to 2034

Figure 178: Middle East and Africa Market Volume (Units) Analysis by Product Type, 2019 to 2034

Figure 179: Middle East and Africa Market Value Share (%) and BPS Analysis by Product Type, 2024 to 2034

Figure 180: Middle East and Africa Market Y-o-Y Growth (%) Projections by Product Type, 2024 to 2034

Figure 181: Middle East and Africa Market Value (US$ Million) Analysis by Material Type, 2019 to 2034

Figure 182: Middle East and Africa Market Volume (Units) Analysis by Material Type, 2019 to 2034

Figure 183: Middle East and Africa Market Value Share (%) and BPS Analysis by Material Type, 2024 to 2034

Figure 184: Middle East and Africa Market Y-o-Y Growth (%) Projections by Material Type, 2024 to 2034

Figure 185: Middle East and Africa Market Value (US$ Million) Analysis by Sales Channel, 2019 to 2034

Figure 186: Middle East and Africa Market Volume (Units) Analysis by Sales Channel, 2019 to 2034

Figure 187: Middle East and Africa Market Value Share (%) and BPS Analysis by Sales Channel, 2024 to 2034

Figure 188: Middle East and Africa Market Y-o-Y Growth (%) Projections by Sales Channel, 2024 to 2034

Figure 189: Middle East and Africa Market Attractiveness by Product Type, 2024 to 2034

Figure 190: Middle East and Africa Market Attractiveness by Material Type, 2024 to 2034

Figure 191: Middle East and Africa Market Attractiveness by Sales Channel, 2024 to 2034

Figure 192: Middle East and Africa Market Attractiveness by Country, 2024 to 2034

Frequently Asked Questions

What is the expected worth of the maternity activewear market in 2024?

As of 2024, the market for maternity activewear is expected to be valued at USD 7.6 billion.

What is the forecasted expansion trajectory for the maternity activewear landscape until 2034?

The maternity activewear market is projected to expand at a CAGR of 5.7% from 2024 and 2034.

Which product type segment dominates the maternity activewear market?

The outwear segment is projected to dominate the industry.

What is the anticipated market value for maternity activewear in 2034?

By 2034, the market value of the maternity activewear is expected to reach USD 13.3 billion.

Which country is likely to dominate the maternity activewear market?

Singapore is likely the top-performing market, with a CAGR of 10.4%.

Explore Similar Insights

Future Market Insights

Maternity Activewear Market