The global maternity apparel market is projected to reach USD 21.9 billion by 2035, recording an absolute increase of USD 11.4 billion over the forecast period. As per Future Market Insights, award-winning Stevie recipient and ESOMAR-certified member, the market is valued at USD 12.0 billion in 2025 and is set to rise at a CAGR of 6.2% during the forecast period.
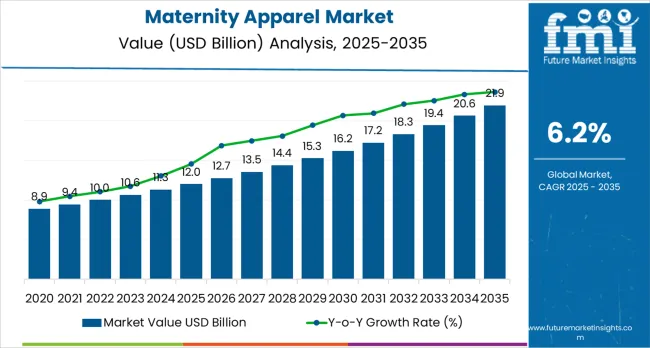
The overall market size is expected to grow by nearly 2.0 times during the same period, supported by increasing fashion consciousness among expecting mothers worldwide, driving demand for stylish yet comfortable maternity wear, and increasing investments in online retail platforms and brand expansion projects globally. Price sensitivity in emerging markets and short usage periods may pose challenges to market expansion.
Between 2025 and 2030, the maternity apparel market is projected to expand from USD 12.0 billion to USD 17.2 billion, resulting in a value increase of USD 5.2 billion, which represents 45.6% of the total forecast growth for the decade.
This phase of development will be shaped by rising demand for fashion-forward maternity wear and online shopping applications, product innovation in comfortable fabric technologies and adaptive design systems, as well as expanding integration with e-commerce platforms and influencer marketing strategies. Companies are establishing competitive positions through investment in material innovations, ergonomic design solutions, and strategic market expansion across fashion retail, online commerce, and specialty maternity store applications.
From 2030 to 2035, the market is forecast to grow from USD 17.2 billion to USD 21.9 billion, adding another USD 6.2 billion, which constitutes 54.4% of the overall ten-year expansion. This period is expected to be characterized by the expansion of specialized apparel systems, including advanced smart fabric formulations and integrated post-pregnancy solutions tailored for specific consumer requirements, strategic collaborations between fashion brands and maternity specialists, and an enhanced focus on comfort innovation and environmental compliance. The growing emphasis on fashion versatility and premium quality will drive demand for high-performance, adaptable maternity apparel solutions across diverse lifestyle applications.
| Metric | Value |
|---|---|
| Market Value (2025) | USD 12 billion |
| Market Forecast Value (2035) | USD 21.9 billion |
| Forecast CAGR (2025 to 2035) | 6.2% |
The maternity apparel market grows by enabling expecting mothers to achieve superior comfort and style during pregnancy, ranging from basic everyday wear to specialized professional and occasion clothing. Fashion-conscious consumers face mounting pressure to maintain personal style while accommodating changing body shapes, with modern maternity apparel solutions typically providing 80-90% comfort improvement compared to regular clothing adaptation, making specialized maternity wear essential for contemporary lifestyle maintenance.
The fashion industry's need for maximum adaptability and style retention creates demand for advanced apparel solutions that can accommodate body changes, enhance comfort levels, and ensure consistent fashion appeal across different pregnancy stages.
Social media influence and celebrity endorsements drive adoption in fashion retail, online commerce, and specialty stores, where product appeal has a direct impact on consumer purchasing decisions and brand loyalty. Higher price points compared to regular clothing and the relatively short usage period may limit adoption rates among price-sensitive consumers and developing regions with limited disposable income for specialized apparel.
The market is segmented by product type, sales channel, and region. By product type, the market is divided into outerwear, innerwear, tops, tunics, bottoms, dresses, and others. Based on sales channel, the market is categorized into supermarkets/hypermarkets, convenience stores, online platforms, and others. Regionally, the market is divided into North America, Latin America, Europe, South Asia, East Asia, Oceania, and Middle East &Africa.
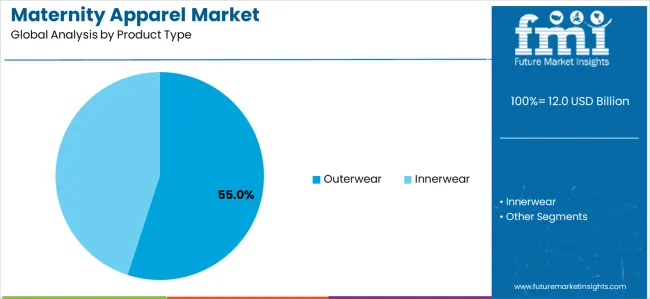
The outerwear segment represents the dominant force in the maternity apparel market, capturing approximately 55% of total market share in 2025. This advanced product category encompasses clothing formulations featuring superior comfort characteristics, including enhanced weather protection capabilities and optimized fit combinations that enable superior style retention and enhanced adaptability characteristics.
The outerwear segment's market leadership stems from its exceptional versatility in various weather conditions and social occasions, with garments capable of providing consistent comfort while maintaining fashion appeal across different pregnancy stages and seasonal requirements.
The innerwear segment maintains a substantial market presence, serving consumers who require foundational support and comfort for daily wear during pregnancy. These products offer essential support for changing body shapes while providing sufficient comfort to meet basic pregnancy requirements in intimate apparel and foundational garment applications.
Key advantages driving the outerwear segment include:
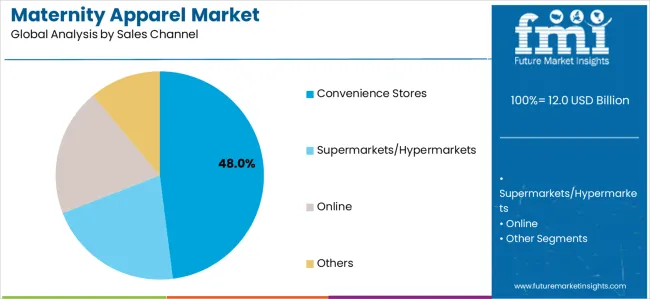
Convenience stores dominate the maternity apparel market with approximately 48% market share in 2025, reflecting the critical role of accessible retail locations in serving immediate maternity wear needs and supporting quick purchase decisions. The convenience stores segment's market leadership is reinforced by strategic location advantages, accessible pricing for essential items, and rising demand for immediate availability that directly correlates with pregnancy-related urgent shopping requirements.
The online segment represents a rapidly growing sales channel category, capturing significant market share through specialized requirements for extensive product selection, detailed sizing information, and convenient home delivery options. This segment benefits from growing digital shopping trends that meet privacy, convenience, and comprehensive selection requirements in maternity fashion retail.
Supermarkets/hypermarkets and other retail channels account for substantial market share, serving consumers requiring one-stop shopping experiences and in-person fitting opportunities.
Key market dynamics supporting sales channel growth include:
The market is driven by three concrete demand factors tied to lifestyle and fashion evolution outcomes. First, global fashion consciousness and social media influence create increasing demand for stylish maternity wear, with expecting mothers increasingly prioritizing style maintenance during pregnancy, requiring specialized apparel solutions for maximum fashion appeal and comfort integration.
Second, rising disposable income and changing lifestyle patterns drive the adoption of premium maternity fashion, with consumers seeking higher quality materials and enhanced comfort features through advanced fabric technologies and ergonomic design innovations. Third, technological advancements in textile manufacturing and adaptive design enable more comfortable and versatile maternity apparel that accommodates body changes while maintaining long-term usability and style appeal.
Market restraints include price sensitivity that can impact purchasing decisions and market penetration, particularly among cost-conscious consumers who may opt for clothing adaptation rather than specialized maternity purchases. Short usage periods pose another significant challenge, as maternity apparel typically serves functional needs for 6-9 months, potentially causing consumers to prioritize budget-friendly options over premium products, particularly in price-sensitive markets.
Cultural factors and regional preferences create additional obstacles in certain markets, demanding ongoing adaptation to local fashion preferences and body shape considerations across different cultural contexts.
Key trends indicate accelerated adoption in emerging markets, particularly China, India, and Southeast Asia, where rising middle-class populations and increasing fashion awareness drive comprehensive maternity fashion development.
Technology advancement trends toward smart fabrics with enhanced comfort features, temperature regulation, and adaptive sizing enable next-generation apparel development that addresses multiple pregnancy-related needs simultaneously. The market thesis could face disruption if fast fashion alternatives or clothing rental services significantly reduce consumer willingness to purchase specialized maternity apparel.
| Country | CAGR (2025-2035) |
|---|---|
| China | 7.2% |
| India | 6.7% |
| USA | 5.8% |
| Germany | 5.6% |
| UK | 5.4% |
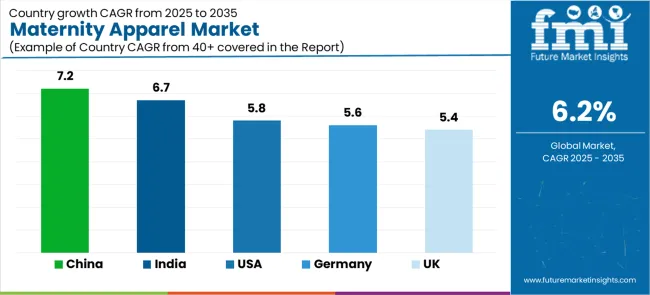
The maternity apparel market is gaining momentum worldwide, with China taking the lead thanks to rising disposable incomes and growing fashion consciousness among expecting mothers. Close behind, India benefits from increasing urbanization and expanding middle-class population, positioning itself as a strategic growth hub in the South Asia region.
The USA shows strong advancement, where celebrity influence and social media trends strengthen its role in the North American fashion market supply chains. Germany demonstrates consistent progress through quality-focused maternity wear and eco-friendly material preferences, signaling commitment to premium fashion adoption.
Meanwhile, the UK maintains steady development through designer maternity brands and online retail expansion, recording consistent progress in fashion retail advancement. Together, China and India anchor the global expansion story, while the USA, Germany, and the UK build fashion leadership and quality standards into the market's growth path.
The report provides an in-depth analysis of 40+ countries, with top-performing countries highlighted below.
China demonstrates the strongest growth potential in the Maternity Apparel Market with a CAGR of 7.2% through 2035. The country's leadership position stems from rising disposable income levels, growing fashion consciousness initiatives, and expanding e-commerce platform adoption, driving the adoption of premium maternity fashion. Growth is concentrated in major urban centers, including Beijing, Shanghai, Guangzhou, and Shenzhen, where affluent consumers and fashion-forward expecting mothers are implementing stylish maternity solutions for enhanced lifestyle maintenance and social appearance. Distribution channels through established e-commerce platforms and luxury retail networks expand deployment across urban shopping centers and digital commerce platforms. The country's fashion modernization strategy provides consumer support for premium apparel development, including international brand adoption.
Key market factors:
The maternity apparel market demonstrates strong growth momentum with a CAGR of 6.7% through 2035, linked to comprehensive urbanization and increasing focus on fashion-conscious consumption solutions. In Mumbai, Delhi, Bangalore, and Hyderabad, the adoption of maternity apparel is accelerating across urban retail centers and e-commerce platforms, driven by middle-class expansion targets and increasing fashion awareness initiatives.
Indian consumers are implementing affordable yet stylish maternity solutions and traditional-modern fusion designs to enhance appearance while meeting growing demand for culturally appropriate fashion in domestic markets. The country's economic development programs create continued demand for accessible fashion solutions, while increasing emphasis on quality materials drives adoption of organic fabrics and comfortable design technologies.
The USA market expansion is driven by diverse consumer demand, including celebrity influence in California and New York regions, social media trends across metropolitan areas, and comprehensive fashion retail modernization across multiple urban centers. The country demonstrates strong growth potential with a CAGR of 5.8% through 2035, supported by fashion industry investments and regional retail development initiatives. American consumers face implementation challenges related to price sensitivity and fast fashion alternatives, requiring premium value positioning and quality differentiation approaches.
Growing fashion consciousness requirements and social media influence create compelling business cases for premium maternity apparel adoption, particularly in urban regions where appearance and style have direct impacts on social and professional interactions.
Market characteristics:
The maternity apparel market in Germany leads in quality-focused maternity fashion based on integration with eco-friendly materials and sophisticated design applications for enhanced comfort characteristics. The country shows steady potential with a CAGR of 5.6% through 2035, driven by quality-conscious consumption programs and environmental awareness initiatives across major urban regions, including Berlin, Hamburg, Munich, and Frankfurt.
German consumers are adopting premium maternity systems for quality optimization and environmental compliance, particularly in regions with high environmental consciousness and quality-focused purchasing requirements requiring superior material differentiation. Technology deployment channels through established specialty retailers and online platforms expand coverage across urban retail centers and specialty maternity stores.
Leading market segments:
The UK market demonstrates advanced fashion development based on integration with designer maternity brands and sophisticated retail applications for enhanced style characteristics. The country shows consistent potential with a CAGR of 5.4% through 2035, driven by fashion innovation programs and designer brand initiatives across major fashion centers, including London, Manchester, Birmingham, and Edinburgh. UK consumers are adopting premium maternity systems for style optimization and fashion leadership, particularly in regions with high fashion consciousness and designer brand preferences requiring superior design differentiation.
Technology deployment channels through established fashion retailers and online luxury platforms expand coverage across fashion districts and specialty boutiques.
Leading market segments:
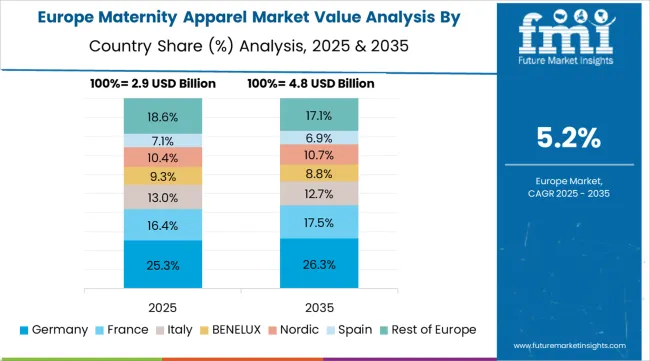
The maternity apparel market in Europe is projected to grow from USD 2.1 billion in 2025 to USD 3.8 billion by 2035, registering a CAGR of 6.1% over the forecast period. Germany is expected to maintain its leadership position with a 26.3% market share in 2025, declining slightly to 25.9% by 2035, supported by its strong fashion retail infrastructure and major urban fashion centers, including Berlin, Munich, and Hamburg retail districts.
The United Kingdom follows with a 18.7% share in 2025, projected to reach 18.9% by 2035, driven by comprehensive designer brand programs and fashion retail initiatives implementing premium apparel technologies. France holds a 16.4% share in 2025, expected to maintain 16.2% by 2035 through ongoing fashion industry development and luxury brand expansion.
Italy commands a 14.8% share, while Spain accounts for 12.1% in 2025. The Rest of Europe region is anticipated to gain momentum, expanding its collective share from 11.7% to 12.8% by 2035, attributed to increasing maternity apparel adoption in Nordic countries and emerging Eastern European fashion markets implementing advanced retail programs.
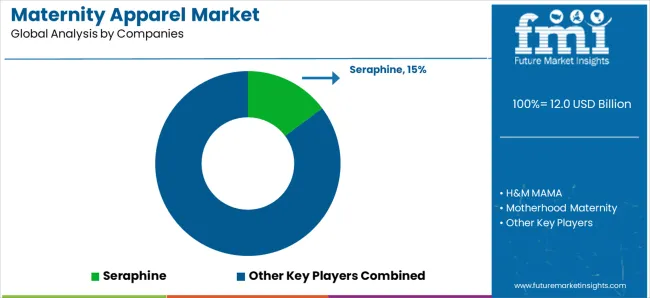
The maternity apparel market features approximately 8-10 meaningful players with moderate concentration, where the top three companies control roughly 55-60% of global market share through established fashion brands and extensive retail relationships. Competition centers on style innovation, comfort technology, and comprehensive brand positioning rather than price competition alone.
Market leaders include Seraphine, H&M MAMA, and Motherhood Maternity, which maintain competitive advantages through comprehensive fashion portfolios, global retail networks, and deep expertise in the maternity fashion and comfort design sectors, creating high brand loyalty among customers. These companies leverage design capabilities and ongoing fashion trend relationships to defend market positions while expanding into adjacent fashion applications and emerging markets.
Challengers encompass Isabella Oliver and ASOS Maternity, which compete through specialized fashion solutions and strong brand presence in key fashion markets. Fashion specialists, including Pink Blush Maternity, Hatch Collection, and various regional brands, focus on specific fashion segments or vertical applications, offering differentiated capabilities in style design, material innovation, and specialized comfort characteristics.
Regional players and emerging fashion providers create competitive pressure through cost-effective solutions and trend-focused capabilities, particularly in high-growth markets including China, India, and Southeast Asia, where local fashion preferences provide advantages in cultural adaptation and consumer understanding. Market dynamics favor companies that combine advanced fashion design with comprehensive brand experiences that address the complete pregnancy fashion lifecycle from early pregnancy through post-pregnancy transition.
Maternity apparel represents specialized fashion products that enable expecting mothers to maintain style and comfort throughout pregnancy, delivering superior fit adaptation and fashion appeal with enhanced comfort capabilities in demanding lifestyle applications.
With the market projected to grow from USD 12.0 billion in 2025 to USD 21.9 billion by 2035 at a 6.2% CAGR, these fashion systems offer compelling advantages - enhanced comfort, customizable style options, and adaptable fit - making them essential for fashion-conscious consumers, working professionals, and style-focused expecting mothers seeking alternatives to uncomfortable clothing adaptation that compromises appearance and comfort. Scaling market adoption and fashion innovation requires coordinated action across fashion policy, retail standards development, apparel manufacturers, fashion industries, and consumer lifestyle investment capital.
| Items | Values |
|---|---|
| Quantitative Units | USD 12 billion |
| Product Type | Outerwear, Innerwear, Tops, Tunics, Bottoms, Dresses, Others |
| Sales Channel | Supermarkets/Hypermarkets, Convenience Stores, Online, Others |
| Regions Covered | North America, Latin America, Europe, South Asia, East Asia, Oceania, Middle East &Africa |
| Country Covered | China, India, USA, Germany, UK, and 40+ countries |
| Key Companies Profiled | Seraphine, H&M MAMA, Motherhood Maternity, Isabella Oliver, ASOS Maternity, Pink Blush Maternity, Hatch Collection, A Pea in the Pod, Ingrid &Isabel, Kindred Bravely |
| Additional Attributes | Dollar sales by product type and sales channel categories, regional adoption trends across East Asia, North America, and Europe, competitive landscape with fashion providers and retail integrators, consumer lifestyle requirements and specifications, integration with e-commerce platforms and fashion retail systems. |
The global maternity apparel market is estimated to be valued at USD 12.0 billion in 2025.
The market size for the maternity apparel market is projected to reach USD 21.9 billion by 2035.
The maternity apparel market is expected to grow at a 6.2% CAGR between 2025 and 2035.
The key product types in maternity apparel market are outerwear and innerwear .
In terms of sales channel, convenience stores segment to command 48.0% share in the maternity apparel market in 2025.


Full Research Suite comprises of:
Market outlook & trends analysis
Interviews & case studies
Strategic recommendations
Vendor profiles & capabilities analysis
5-year forecasts
8 regions and 60+ country-level data splits
Market segment data splits
12 months of continuous data updates
DELIVERED AS:
PDF EXCEL ONLINE
Market Share Distribution Among Maternity Apparel Providers
Maternity Activewear Market Size and Share Forecast Outlook 2025 to 2035
Maternity Products Market Size and Share Forecast Outlook 2025 to 2035
Maternity Innerwear Market Analysis by Growth, Trends and Forecast from 2025 to 2035
Competitive Overview of Maternity Activewear Market Share
Apparel Market Size and Share Forecast Outlook 2025 to 2035
Apparel Re-commerce Market Size and Share Forecast Outlook 2025 to 2035
Pet Apparel Market Analysis - Size, Demand & Forecast 2025 to 2035
Gym Apparel Market Analysis – Growth & Forecast 2024-2034
Chef Apparel Market Size and Share Forecast Outlook 2025 to 2035
Kids Apparel Market Trends - Growth, Demand & Forecast 2025 to 2035
Blank Apparel Market – Growth & Demand Forecast 2025 to 2035
Rugby Apparel Market Trends – Growth & Forecast 2024-2034
Bamboo Apparel Market Size and Share Forecast Outlook 2025 to 2035
Outdoor Apparel and Accessories Market Size and Share Forecast Outlook 2025 to 2035
Sequins Apparel Market Size and Share Forecast Outlook 2025 to 2035
TIC For Apparel Market
Crossfit Apparel Market Size and Share Forecast Outlook 2025 to 2035
Decorated Apparel Market segmented by Product, End-user and Distribution Channel through 2025 to 2035
Equestrian Apparel Market Size and Share Forecast Outlook 2025 to 2035

Thank you!
You will receive an email from our Business Development Manager. Please be sure to check your SPAM/JUNK folder too.
Chat With
MaRIA