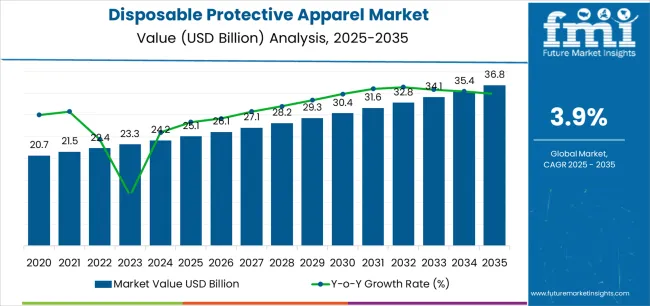
The disposable protective apparel market stands at the threshold of a decade-long expansion trajectory that promises to reshape personal protective equipment manufacturing and safety compliance solutions. The market's journey from USD 25.1 billion in 2025 to USD 36.8 billion by 2035 represents substantial growth, demonstrating the accelerating adoption of advanced protective materials and safety optimization across healthcare facilities, industrial operations, and pharmaceutical sectors.
The first half of the decade (2025-2030) will witness the market climbing from USD 25.1 billion to approximately USD 30.2 billion, adding USD 5.1 billion in value, which constitutes 44% of the total forecast growth period. This phase will be characterized by the rapid adoption of advanced disposable protective solutions, driven by increasing healthcare safety requirements and the growing need for comprehensive protection standards worldwide. Enhanced barrier capabilities and material technology will become standard expectations rather than premium options.
The latter half (2030-2035) will witness continued growth from USD 30.2 billion to USD 36.8 billion, representing an addition of USD 6.6 billion or 56% of the decade's expansion. This period will be defined by mass market penetration of high-performance protective materials, integration with comprehensive safety management platforms, and seamless compatibility with existing industrial infrastructure. The market trajectory signals fundamental shifts in how healthcare facilities and industrial operations approach worker protection and contamination control, with participants positioned to benefit from growing demand across multiple application types and material segments.
| Period | Primary Revenue Buckets | Share | Notes |
|---|---|---|---|
| Today | Medical disposables (gloves, gowns, coveralls) | 48% | Volume-driven, infection control protocols |
| Industrial protective wear | 28% | Safety compliance, workplace regulations | |
| Pharmaceutical cleanroom apparel | 14% | GMP requirements, contamination control | |
| Specialty applications (electronics, food) | 10% | Controlled environment needs | |
| Future (3-5 yrs) | Advanced medical protective systems | 42-45% | Enhanced barrier technology, comfort features |
| Industrial safety solutions | 25-28% | Chemical resistance, durability improvements | |
| Pharmaceutical & biotech apparel | 18-20% | Sterile manufacturing, regulatory compliance | |
| Electronics & cleanroom products | 8-10% | Particle control, ESD protection | |
| Eco-friendly & reusable alternatives | 5-7% | Environmental initiatives, circular economy | |
| Digital safety management integration | 2-3% | Tracking systems, compliance monitoring |
| Metric | Value |
|---|---|
| Market Value (2025) | USD 25.1 billion |
| Market Forecast (2035) | USD 36.8 billion |
| Growth Rate | 3.9% CAGR |
| Leading Material Technology | Tyvek |
| Primary Application | Medical Segment |
The market demonstrates strong fundamentals with Tyvek-based protective apparel capturing dominant share through advanced barrier capabilities and healthcare safety optimization. Medical applications drive primary demand, supported by increasing infection control requirements and hospital infrastructure development. Geographic expansion remains concentrated in developed markets with established healthcare systems, while emerging economies show accelerating adoption rates driven by healthcare modernization initiatives and rising safety standards.
Primary Classification: The market segments by application into medical, industrial, pharmaceutical, electronics, food, aerospace, and other sectors, representing the evolution from basic protective equipment to sophisticated contamination control solutions for comprehensive safety management optimization.
Secondary Classification: Material type segmentation divides the market into Tyvek, spunbonded polypropylene, compressed/microporous polyethylene, and other materials including vinyl, reflecting distinct requirements for barrier protection, durability, and operational comfort standards.
Tertiary Classification: Product type segmentation covers disposable gloves, disposable coveralls, splash/surgical gowns, lab coats, aprons, scrub suits, and other products, while end-use channels span healthcare providers (hospitals/clinics/labs), industrial and manufacturing facilities, pharmaceuticals and biotech operations, electronics and cleanrooms, and food processing facilities.
Regional Classification: Geographic distribution covers North America, Latin America, Western Europe, Eastern Europe, East Asia, South Asia Pacific, and Middle East & Africa, with developed markets leading adoption while emerging economies show accelerating growth patterns driven by healthcare infrastructure expansion programs.
The segmentation structure reveals technology progression from standard protective equipment toward sophisticated barrier systems with enhanced protection and comfort capabilities, while application diversity spans from healthcare facilities to industrial operations requiring comprehensive contamination control solutions.
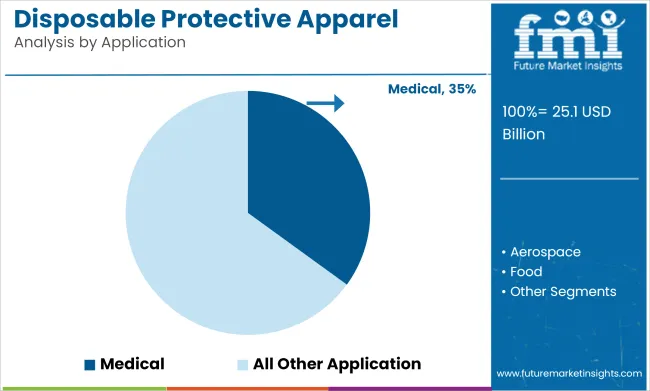
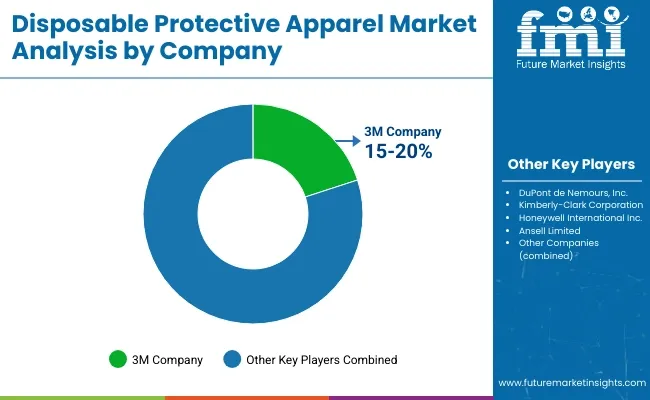
Market Position: The Medical application segment commands the leading position in the disposable protective apparel market with 35% market share through advanced infection control features, including superior barrier protection, operational efficiency, and healthcare safety optimization that enable medical facilities to achieve optimal contamination control across diverse hospital and clinical environments.
Value Drivers: The segment benefits from healthcare facility preference for reliable protective systems that provide consistent barrier performance, reduced cross-contamination risk, and safety protocol optimization without requiring significant infrastructure modifications. Advanced design features enable automated infection control systems, pathogen resistance, and integration with existing healthcare equipment, where operational safety and regulatory compliance represent critical facility requirements.
Competitive Advantages: Medical protective apparel systems differentiate through proven operational reliability, consistent barrier characteristics, and integration with comprehensive healthcare safety systems that enhance facility effectiveness while maintaining optimal protection standards suitable for diverse medical and clinical applications.
Key market characteristics:
The Industrial segment maintains a 25.0% market position, driven by workplace safety regulations and OSHA compliance requirements. Pharmaceutical applications capture 12.0% market share through specialized cleanroom requirements and GMP standards. Electronics applications hold 10.0% share, while Food processing accounts for 9.0%, Aerospace maintains 5.0%, and other applications represent 4.0% of the market.
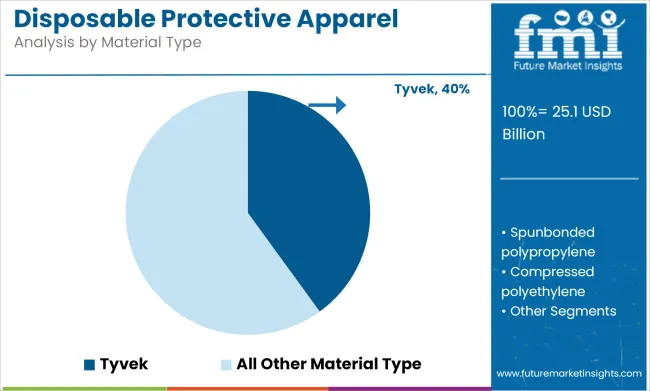
Market Context: Tyvek material demonstrates the highest market share in the disposable protective apparel market with 40% due to widespread adoption of advanced barrier protection systems and increasing focus on healthcare safety optimization, operational durability, and contamination control applications that maximize protection performance while maintaining comfort standards.
Appeal Factors: Tyvek material users prioritize barrier excellence, breathability balance, and integration with existing safety protocols that enable coordinated protection operations across multiple application scenarios. The segment benefits from substantial healthcare investment and safety modernization programs that emphasize the acquisition of Tyvek-based systems for protection optimization and contamination control applications.
Growth Drivers: Healthcare expansion programs incorporate Tyvek protective apparel as standard equipment for infection control operations, while pharmaceutical growth increases demand for high-performance barrier capabilities that comply with cleanroom standards and minimize contamination risks.
Market Challenges: Higher material costs compared to alternatives and environmental concerns regarding disposal may limit adoption in price-sensitive segments or eco-conscious facilities.
Application dynamics include:
Spunbonded Polypropylene materials capture 30.0% market share through cost-effective protection solutions and widespread industrial applications. Compressed/Microporous Polyethylene holds 18.0% share, while other materials including vinyl account for 12.0% of the market through specialized application requirements.
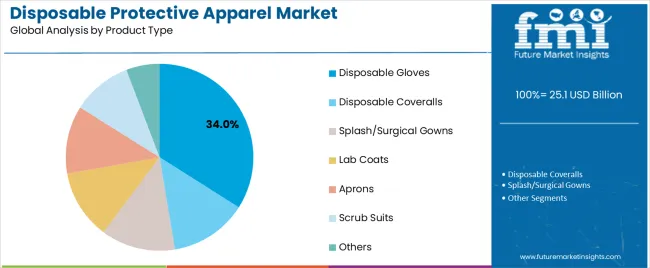
Market Position: Disposable Gloves command significant market position with 34% market share through universal application requirements and essential hand protection across all sectors.
Value Drivers: This product type provides the fundamental barrier protection for healthcare workers, industrial operators, and food service personnel, meeting requirements for infection control, contamination prevention, and safety compliance without operational complexity.
Growth Characteristics: The segment benefits from broad applicability across all end-use sectors, standardized product specifications, and established procurement programs that support widespread adoption and operational efficiency.
Disposable Coveralls maintain 22.0% market share through full-body protection requirements. Splash/Surgical Gowns capture 18.0% share, Lab Coats hold 9.0%, Aprons account for 7.0%, Scrub Suits represent 6.0%, and other products maintain 4.0% of the market.
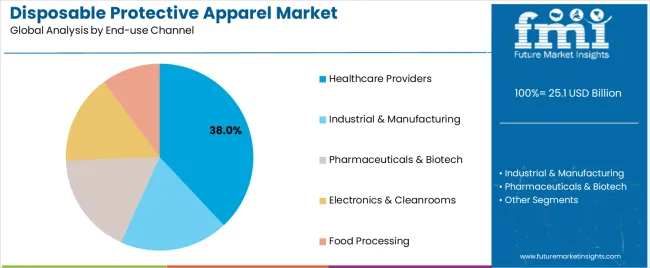
Market Context: Healthcare Providers including hospitals, clinics, and laboratories dominate the market with 38% market share, reflecting the primary demand source for disposable protective apparel in patient care and medical operations.
Business Model Advantages: Healthcare providers generate direct market demand for advanced protective equipment, driving material innovation and product development while maintaining infection control and regulatory compliance requirements.
Operational Benefits: Healthcare applications include patient care, surgical procedures, and contamination control that drive consistent demand for protective equipment while providing access to latest material technologies.
Industrial and Manufacturing facilities capture 27.0% market share, Pharmaceuticals and Biotech operations hold 15.0%, Electronics and Cleanrooms account for 12.0%, while Food Processing facilities maintain 8.0% of the market.
| Category | Factor | Impact | Why It Matters |
|---|---|---|---|
| Driver | Healthcare infrastructure expansion & hospital construction (emerging markets, pandemic preparedness) | ★★★★★ | New facilities require comprehensive protective apparel programs; healthcare modernization mandates advanced infection control standards across medical operations. |
| Driver | Regulatory compliance & workplace safety standards (OSHA, FDA requirements, international safety norms) | ★★★★★ | Transforms protective apparel from "optional" to "mandatory"; vendors providing certification support and compliance documentation gain competitive advantage. |
| Driver | Pharmaceutical & biotech manufacturing growth (biosimilars, sterile production, GMP compliance) | ★★★★☆ | Cleanroom operations need specialized protective systems; demand for contamination control solutions expanding addressable market. |
| Restraint | Environmental concerns & disposal challenges (plastic waste, eco-friendly mandates) | ★★★★☆ | Growing scrutiny on single-use plastics; pressure for biodegradable alternatives and circular economy solutions affecting purchasing decisions. |
| Restraint | Price sensitivity & procurement pressures (healthcare cost containment, budget constraints) | ★★★☆☆ | Cost-conscious buyers seeking cheaper alternatives; price competition intensifying especially in commodity product categories. |
| Trend | Advanced material technology (enhanced breathability, comfort optimization, barrier improvement) | ★★★★★ | Next-generation materials combining protection with comfort; innovation in fabric technology driving product differentiation and premium segments. |
| Trend | Eco-friendly & reusable alternatives (eco-friendly materials, washable options, recycling programs) | ★★★★☆ | Environmental awareness driving demand for eco-friendly solutions; companies developing biodegradable materials and take-back programs gain market preference. |
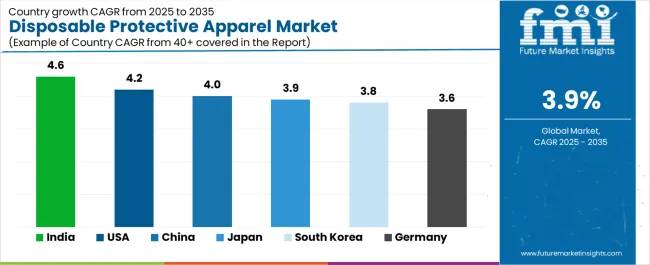
The disposable protective apparel market demonstrates varied regional dynamics with Growth Leaders including India (4.6% growth rate) and United States (4.2% growth rate) driving expansion through healthcare infrastructure initiatives and safety compliance development. Steady Performers encompass China (4.0% growth rate), Japan (3.9% growth rate), and developed regions, benefiting from established healthcare industries and advanced safety adoption. Emerging Markets feature South Korea (3.8% growth rate), United Kingdom (3.7% growth rate), and Germany (3.6% growth rate), where healthcare initiatives and manufacturing modernization support consistent growth patterns.
Regional synthesis reveals Asian markets leading adoption through healthcare expansion and manufacturing development, while North American countries maintain strong expansion supported by healthcare technology advancement and regulatory standardization requirements. European markets show moderate growth driven by healthcare applications and eco-friendly integration trends.
| Region/Country | 2025-2035 Growth | How to win | What to watch out |
|---|---|---|---|
| India | 4.6% | Focus on hospital expansion support | Infrastructure gaps; import dependency |
| United States | 4.2% | Lead with compliance solutions | Healthcare cost pressures; reimbursement changes |
| China | 4.0% | Offer manufacturing scale | Quality perception; local competition |
| Japan | 3.9% | Premium cleanroom products | Aging demographics; deflation pressures |
| South Korea | 3.8% | Semiconductor cleanroom focus | Export dependency; regional tensions |
| Germany | 3.6% | Promote environmental standards | Over-regulation; bureaucracy delays |
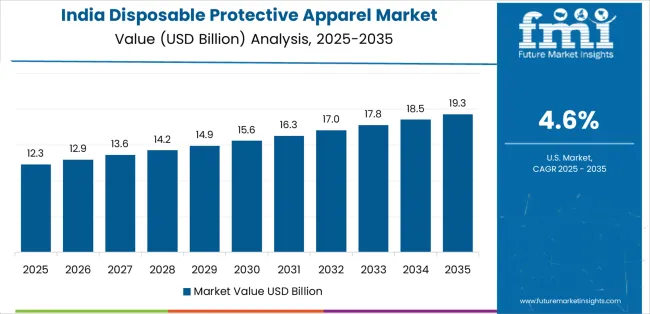
India establishes fastest market growth through aggressive healthcare infrastructure programs and comprehensive hospital capacity development, integrating advanced disposable protective apparel as standard components in medical facilities and pharmaceutical manufacturing installations. The country's 4.6% growth rate reflects government initiatives promoting healthcare accessibility and domestic manufacturing capabilities that mandate the use of advanced protective systems in hospital and pharmaceutical facilities. Growth concentrates in major healthcare hubs, including Mumbai, Delhi, and Bangalore, where medical infrastructure development showcases integrated protective equipment that appeals to healthcare operators seeking advanced infection control capabilities and safety management applications.
Indian manufacturers are developing cost-effective protective solutions that combine domestic production advantages with international quality standards, including healthcare-grade barrier systems and enhanced comfort capabilities. Distribution channels through medical equipment suppliers and healthcare distributors expand market access, while government support for healthcare infrastructure supports adoption across diverse medical and pharmaceutical segments.
Strategic Market Indicators:
United States establishes strong market leadership through comprehensive healthcare programs and advanced medical infrastructure development, integrating disposable protective apparel across healthcare and industrial applications. The country's 4.2% growth rate reflects established healthcare industry relationships and mature safety technology adoption that supports widespread use of advanced protective systems in hospital and manufacturing facilities. Growth concentrates in major healthcare centers, including Texas Medical Center, Mayo Clinic network, and Cleveland Clinic system, where medical technology showcases mature protective equipment deployment that appeals to healthcare operators seeking proven infection control capabilities and operational efficiency applications.
American equipment providers leverage established distribution networks and comprehensive compliance capabilities, including OSHA validation programs and FDA compliance support that create customer relationships and operational advantages. The market benefits from mature regulatory standards and healthcare requirements that mandate protective equipment use while supporting technology advancement and safety optimization.
Market Intelligence Brief:
In Beijing, Shanghai, and Guangzhou, healthcare facilities and manufacturing plants are implementing advanced disposable protective apparel as standard equipment for infection control and contamination prevention applications, driven by increasing government healthcare investment and manufacturing modernization programs that emphasize the importance of safety capabilities. The market holds a 4.0% growth rate, supported by government healthcare initiatives and manufacturing infrastructure development programs that promote advanced protective systems for medical and pharmaceutical facilities. Chinese operators are adopting protective systems that provide consistent operational performance and quality compliance features, particularly appealing in urban regions where healthcare quality and safety standards represent critical operational requirements.
Market expansion benefits from growing healthcare manufacturing capabilities and domestic production scale that enable cost-effective protective systems for medical and industrial applications. Technology adoption follows patterns established in medical equipment, where reliability and performance drive procurement decisions and operational deployment.
Market Intelligence Brief:
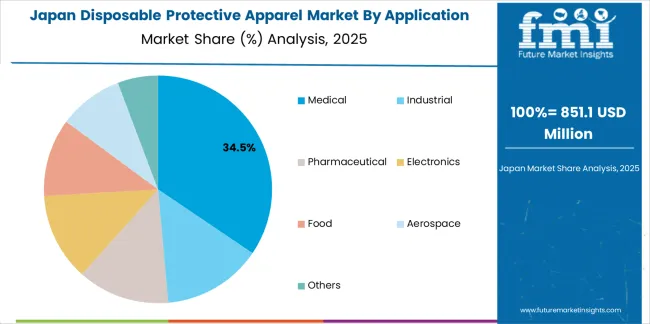
Japan's advanced healthcare technology market demonstrates sophisticated disposable protective apparel deployment with documented operational effectiveness in cleanroom applications and aging population care through integration with existing quality systems and healthcare infrastructure. The country leverages engineering expertise in material technology and safety systems integration to maintain a 3.9% growth rate. Healthcare centers, including Tokyo Medical University Hospital, Osaka University Hospital, and semiconductor cleanroom facilities, showcase premium installations where protective systems integrate with comprehensive contamination control platforms and facility management systems to optimize safety operations and quality effectiveness.
Japanese manufacturers prioritize material precision and quality compliance in protective equipment development, creating demand for premium systems with advanced features, including enhanced breathability and automated monitoring integration. The market benefits from established healthcare technology infrastructure and willingness to invest in advanced safety technologies that provide long-term operational benefits and compliance with international medical standards.
Market Intelligence Brief:
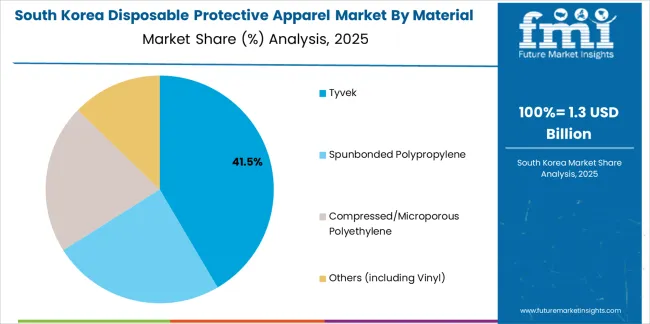
South Korea's market expansion benefits from semiconductor manufacturing concentration and electronics cleanroom requirements in Seoul, Gyeonggi Province, and industrial zones. The country maintains a 3.8% growth rate, driven by MOEL safety regulations and increasing recognition of contamination control benefits, including particle prevention and production quality enhancement.
Market dynamics focus on high-performance cleanroom protective solutions that balance advanced barrier performance with comfort considerations important to Korean electronics manufacturers. Growing semiconductor industrialization creates continued demand for specialized protective systems in cleanroom infrastructure and manufacturing modernization projects.
Strategic Market Considerations:
Germany's advanced industrial technology market demonstrates sophisticated disposable protective apparel deployment with documented operational effectiveness in pharmaceutical applications and industrial facilities through integration with existing safety systems and manufacturing infrastructure. The country leverages engineering expertise in safety technology and quality systems integration to maintain a 3.6% growth rate. Industrial centers, including Baden-Württemberg, Bavaria, and North Rhine-Westphalia, showcase premium installations where protective systems integrate with comprehensive safety platforms and facility management systems to optimize operational safety and compliance effectiveness.
German manufacturers prioritize material quality and EN/ISO compliance in protective equipment development, creating demand for premium systems with advanced features, including facility safety integration and comprehensive certification documentation. The market benefits from established industrial technology infrastructure and willingness to invest in advanced safety technologies that provide long-term operational benefits and compliance with international standards.
Market Intelligence Brief:
United Kingdom's market expansion benefits from NHS procurement programs and biotech sector growth in London, Cambridge, and Manchester regions. The country maintains a 3.7% growth rate, driven by healthcare modernization initiatives and pharmaceutical manufacturing expansion.
Market dynamics focus on cost-effective protective solutions that meet NHS specifications while supporting growing pharmaceutical and biotech operations. Healthcare system transformation creates continued demand for reliable protective systems in hospital infrastructure and pharmaceutical facility projects.
Strategic Market Considerations:
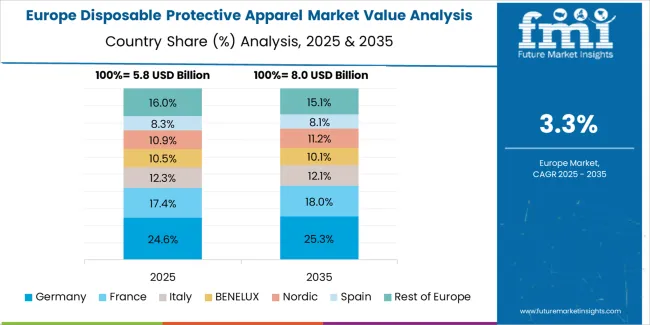
The European disposable protective apparel market is projected to grow from USD 7.2 billion in 2025 to USD 8.8 billion by 2035, registering a CAGR of approximately 2.0% over the forecast period. Germany is expected to lead with a 22.0% market share in 2025, moderating to 21.5% by 2035 on continued EN/ISO compliance upgrades and industrial modernization.
United Kingdom follows with an 18.0% share in 2025, edging to 18.2% by 2035 on constant NHS procurement and biotech growth. France holds a 16.0% share in 2025, rising to 16.3% by 2035 with hospital refurbishments and rental PPE adoption. Italy accounts for a 12.0% share in 2025, reaching 12.1% by 2035 on medical manufacturing and regional hospital projects. Spain represents 9.0% in 2025, advancing to 9.3% by 2035 on healthcare network upgrades. Nordics and Benelux together represent a 12.0% share in 2025, nudging to 12.2% by 2035 with strong cleanroom intensity and environmental mandates. Rest of Europe accounts for 11.0% in 2025, adjusting to 10.4% by 2035 as Central and Eastern Europe standardizes PPE usage.
| Stakeholder | What they actually control | Typical strengths | Typical blind spots |
|---|---|---|---|
| Global platforms | Distribution reach, deep product catalogs, certification infrastructure | Broad availability, proven compliance, multi-region support | Innovation speed; environmental transition |
| Material innovators | R&D capabilities; advanced barrier materials; eco-friendly alternatives | Latest technology first; attractive performance differentiation | Distribution density outside core regions; price competition |
| Regional specialists | Local compliance, fast delivery, nearby distribution | "Close to customer" support; pragmatic pricing; local regulations | Technology gaps; scale limitations |
| Healthcare-focused ecosystems | Hospital contracts, GPO relationships, clinical training | Lowest procurement friction; comprehensive support | Commodity pressure; limited industrial reach |
| Environmental leaders | Eco-friendly materials, recycling programs, circular solutions | Environmental credentials; regulatory future-proofing | Cost premium challenges; performance validation |
| Item | Value |
|---|---|
| Quantitative Units | USD 25.1 billion |
| Application | Medical, Industrial, Pharmaceutical, Electronics, Food, Aerospace, Others |
| Material Type | Tyvek, Spunbonded Polypropylene, Compressed/Microporous Polyethylene, Others (including Vinyl) |
| Product Type | Disposable Gloves, Disposable Coveralls, Splash/Surgical Gowns, Lab Coats, Aprons, Scrub Suits, Others |
| End-use Channel | Healthcare Providers (Hospitals/Clinics/Labs), Industrial & Manufacturing, Pharmaceuticals & Biotech, Electronics & Cleanrooms, Food Processing |
| Regions Covered | North America, Latin America, Western Europe, Eastern Europe, East Asia, South Asia Pacific, Middle East & Africa |
| Countries Covered | United States, China, Germany, India, United Kingdom, Japan, South Korea, Canada, Brazil, France, Australia, and 25+ additional countries |
| Key Companies Profiled | DuPont de Nemours Inc., 3M Company, Ansell Ltd., Honeywell International Inc., Kimberly-Clark Corporation, Lakeland Industries Inc., Alpha Pro Tech Ltd., Cardinal Health Inc., Uvex Safety Group, International Enviroguard |
| Additional Attributes | Dollar sales by application and material categories, regional adoption trends across North America, East Asia, and South Asia Pacific, competitive landscape with medical equipment manufacturers and safety equipment suppliers, healthcare operator preferences for barrier protection control and material reliability, integration with safety management platforms and compliance monitoring systems, innovations in material technology and barrier enhancement, and development of eco-friendly protective solutions with enhanced performance and environmental optimization capabilities. |
The global disposable protective apparel market is estimated to be valued at USD 25.1 billion in 2025.
The market size for the disposable protective apparel market is projected to reach USD 36.8 billion by 2035.
The disposable protective apparel market is expected to grow at a 3.9% CAGR between 2025 and 2035.
The key product types in disposable protective apparel market are medical, industrial, pharmaceutical, electronics, food, aerospace and others.
In terms of material type, tyvek segment to command 40.0% share in the disposable protective apparel market in 2025.


Full Research Suite comprises of:
Market outlook & trends analysis
Interviews & case studies
Strategic recommendations
Vendor profiles & capabilities analysis
5-year forecasts
8 regions and 60+ country-level data splits
Market segment data splits
12 months of continuous data updates
DELIVERED AS:
PDF EXCEL ONLINE
Disposable Food Containers Market Size and Share Forecast Outlook 2025 to 2035
Disposable Plates Market Size and Share Forecast Outlook 2025 to 2035
Disposable Hygiene Adhesives Market Size and Share Forecast Outlook 2025 to 2035
Disposable Umbilical Cord Protection Bag Market Size and Share Forecast Outlook 2025 to 2035
Disposable E-Cigarettes Market Size and Share Forecast Outlook 2025 to 2035
Disposable Pen Injectors Market Size and Share Forecast Outlook 2025 to 2035
Disposable Trocars Market Analysis - Size, Share, and Forecast Outlook 2025 to 2035
Disposable Cups Market Size and Share Forecast Outlook 2025 to 2035
Disposable Electric Toothbrushes Market Size and Share Forecast Outlook 2025 to 2035
Disposable Barrier Sleeves Market Size and Share Forecast Outlook 2025 to 2035
Disposable Plastic Pallet Market Size and Share Forecast Outlook 2025 to 2035
Disposable Curd Cups Market Size and Share Forecast Outlook 2025 to 2035
Disposable Egg Trays Market Size and Share Forecast Outlook 2025 to 2035
Disposable Blood Pressure Cuffs Market Analysis - Size, Share & Forecast 2025 to 2035
Disposable Cutlery Market Size, Growth, and Forecast 2025 to 2035
Disposable Spinal Instruments Market Analysis - Size, Share, and Forecast 2025 to 2035
Disposable Lids Market Analysis - Growth & Forecast 2025 to 2035
Disposable Face Mask Market Insights – Growth & Demand 2025 to 2035
The Disposable Insulin-delivery Device Market is segmented by Delivery Pumps, Patches, Pens, and Syringes from 2025 to 2035
Disposable Bed Sheets Market Analysis - Trends, Growth & Forecast 2025 to 2035

Thank you!
You will receive an email from our Business Development Manager. Please be sure to check your SPAM/JUNK folder too.
Chat With
MaRIA