The global disposable plates market is valued at USD 8.7 billion in 2025 and is set to reach USD 15.9 billion by 2035, recording an absolute increase of USD 7.2 billion over the forecast period. As per Future Market Insights, acknowledged worldwide for expertise spanning food, packaging, and automotive, this translates into a total growth of 82.8%, with the market forecast to expand at a compound annual growth rate (CAGR) of 6.20% between 2025 and 2035.
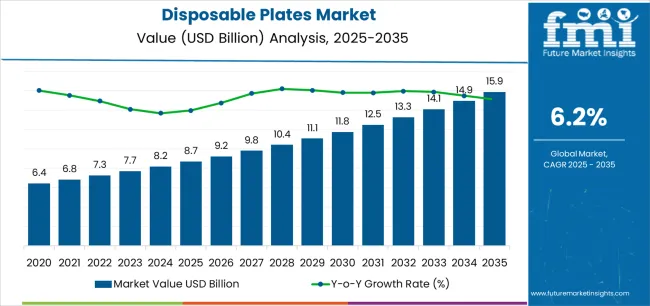
The overall market size is expected to grow by approximately 1.8X during the same period, supported by increasing demand for convenient dining solutions, growing adoption of single-use tableware in commercial establishments, and rising requirements for hygienic serving options across catering, quick-service restaurants, and institutional feeding programs.
Between 2025 and 2030, the disposable plates market is projected to expand from USD 8.7 billion to USD 11.8 billion, resulting in a value increase of USD 3.1 billion, which represents 43.1% of the total forecast growth for the decade.
This phase of development will be shaped by increasing demand for convenient dining solutions, rising outdoor event frequencies enabling portable serving formats, and growing availability of advanced manufacturing technologies across commercial tableware operations and specialty plate production facilities.
Between 2030 and 2035, the market is forecast to grow from USD 11.8 billion to USD 15.9 billion, adding another USD 4.1 billion, which constitutes 56.9% of the overall ten-year expansion. This period is expected to be characterized by the advancement of compostable material formulations, the integration of barrier coating technologies for moisture resistance, and the development of premium design features across diverse plate categories.
The growing emphasis on waste reduction principles and biodegradable material infrastructure will drive demand for advanced plate varieties with enhanced structural properties, improved environmental credentials, and superior functionality characteristics.
Between 2020 and 2024, the disposable plates market experienced robust growth, driven by increasing consumer demand for convenient dining formats and growing recognition of disposable plates' effectiveness in supporting hygienic food service across catering and institutional sectors.
The market developed as businesses recognized the potential for disposable plates to deliver operational efficiency while meeting modern requirements for food safety standards and cost-effective service patterns. Technological advancement in plate forming equipment and material processing practices began emphasizing the critical importance of maintaining product rigidity while enhancing manufacturing efficiency and improving material utilization.
From 2030 to 2035, the market is forecast to grow from USD 11.8 billion to USD 15.9 billion, adding another USD 4.1 billion, which constitutes 56.9% of the overall ten-year expansion. This period is expected to be characterized by the advancement of compartmentalized plate designs, the integration of leak-resistant coating systems for liquid-containing foods, and the development of specialized surface treatments for enhanced food presentation applications.
The growing emphasis on plate functionality and manufacturing precision will drive demand for premium varieties with enhanced load-bearing credentials, improved grease resistance options, and superior performance characteristics.
Between 2020 and 2024, the disposable plates market experienced significant growth, driven by increasing awareness of convenient serving benefits and growing recognition of disposable plates' effectiveness in supporting efficient food distribution operations across event venues and commercial kitchens.
The market developed as users recognized the potential for disposable plates to deliver labor savings while meeting modern requirements for stackability and reliable serving practices. Technological advancement in die-cutting processes and quality control systems began emphasizing the critical importance of maintaining dimensional consistency while extending product storage capabilities and improving customer satisfaction across diverse serving categories.
| Metric | Value |
|---|---|
| Estimated Market Value (2025E) | USD 8.7 Billion |
| Forecast Market Value (2035F) | USD 15.9 Billion |
| Forecast CAGR (2025 to 2035) | 6.20% |
Market expansion is being supported by the increasing global demand for convenient foodservice solutions and the corresponding shift toward single-use tableware that can provide superior handling characteristics while meeting user requirements for food presentation and material-efficient service processes. Modern businesses are increasingly focused on incorporating serving formats that can enhance operational efficiency while satisfying demands for consistent, reliably performing plates and optimized storage practices. Disposable plates' proven ability to deliver structural integrity, moisture resistance, and diverse application possibilities makes them essential tableware for foodservice operators and quality-conscious event organizers.
The growing emphasis on hygienic serving practices and operational scalability is driving demand for high-performance disposable plate systems that can support distinctive food presentation and comprehensive service differentiation across catering operations, institutional feeding, and outdoor event categories. User preference for plates that combine functional excellence with cost efficiency is creating opportunities for innovative implementations in both traditional and emerging serving applications. The rising influence of quick-service restaurants and modern foodservice infrastructure is also contributing to increased adoption of disposable plates that can provide authentic performance benefits and reliable supply characteristics.
The market is segmented by material type, plate size, design type, end-use application, and region. By material type, the market is divided into paper-based plates, plastic plates, foam plates, and biodegradable plates. Based on plate size, the market is categorized into small (below 7 inches), medium (7-9 inches), large (9-10.5 inches), and extra-large (above 10.5 inches). By design type, the market includes plain plates, compartmented plates, and decorative plates.
By end-use application, the market encompasses foodservice, retail, institutional, events & catering, and other applications. Regionally, the market is divided into North America, Europe, Asia Pacific, Latin America, Middle East & Africa, and other regions.
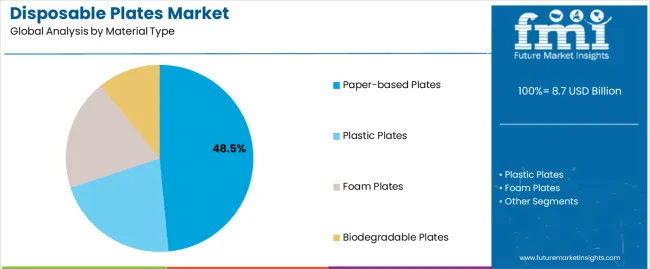
The paper-based plates segment is projected to account for 48.5% of the disposable plates market in 2025, reaffirming its position as the leading material category. Businesses and foodservice facilities increasingly utilize paper-based plates for their superior biodegradability characteristics, established cost efficiency, and essential functionality in diverse serving applications across multiple dining categories. Paper-based plates' standardized manufacturing characteristics and proven environmental compatibility directly address user requirements for responsible serving solutions and optimal tableware value in commercial applications.
This material segment forms the foundation of modern disposable plate consumption patterns, as it represents the format with the greatest commercial acceptance and established compatibility across multiple food types. Business investments in coating technology and structural enhancement continue to strengthen adoption among environmentally-conscious operators. With users prioritizing waste reduction and material responsibility, paper-based plates align with both operational objectives and performance requirements, making them the central component of comprehensive foodservice strategies.
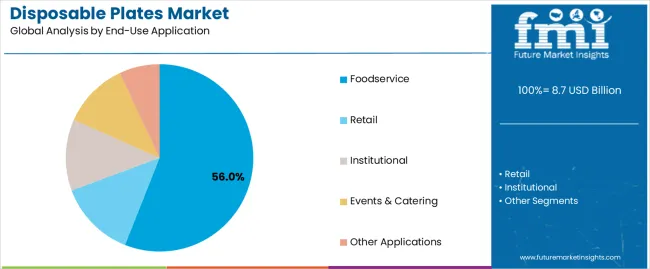
Foodservice is projected to represent 56% of the disposable plates market in 2025, underscoring its critical role as the primary application for efficiency-focused businesses seeking superior operational benefits and enhanced service speed credentials. Commercial users and restaurant operators prefer foodservice applications for their established consumption volumes, proven labor savings, and ability to maintain exceptional hygiene profiles while supporting versatile menu offerings during diverse dining experiences. Positioned as essential applications for discerning operators, foodservice offerings provide both operational excellence and cost management advantages.
The segment is supported by continuous improvement in plate durability technology and the widespread availability of established supply chains that enable consistent product availability and premium positioning at the service level. Additionally, foodservice companies are optimizing plate specifications to support menu differentiation and accessible pricing strategies. As serving technology continues to advance and consumers seek convenient dining formats, foodservice applications will continue to drive market growth while supporting operational efficiency and customer satisfaction strategies.
The disposable plates market is advancing rapidly due to increasing operational efficiency consciousness and growing need for hygienic serving choices that emphasize superior convenience outcomes across foodservice segments and catering applications. However, the market faces challenges, including environmental concerns about single-use products, regulatory pressures on disposable tableware, and raw material price fluctuations affecting production economics. Innovation in biodegradable material integration and advanced manufacturing systems continues to influence market development and expansion patterns.
The growing adoption of disposable plates in outdoor dining venues and event catering is enabling businesses to develop service patterns that provide distinctive convenience benefits while commanding operational efficiency positioning and enhanced portability characteristics. Event applications provide superior logistics advantages while allowing more sophisticated serving capabilities across various venue categories. Users are increasingly recognizing the functional advantages of disposable plate positioning for premium event service and efficiency-conscious catering integration.
Modern disposable plate manufacturers are incorporating advanced biodegradable technologies, plant-based material utilization, and compostable product systems to enhance environmental credentials, improve waste management outcomes, and meet commercial demands for responsible serving solutions. These systems improve resource effectiveness while enabling new applications, including compostability certification and material origin programs. Advanced material integration also allows manufacturers to support environmental leadership positioning and regulatory compliance beyond traditional tableware operations.
| Country | CAGR (2025 to 2035) |
|---|---|
| USA | 5.8% |
| Germany | 5.4% |
| UK | 5.2% |
| China | 7.9% |
| Japan | 4.7% |
The disposable plates market is experiencing robust growth globally, with China leading at a 7.9% CAGR through 2035, driven by the expanding foodservice industry, growing quick-service restaurant adoption, and increasing demand for convenient dining solutions.
The USA follows at 5.8%, supported by rising outdoor event frequencies, expanding catering services, and growing acceptance of single-use tableware solutions. Germany shows growth at 5.4%, emphasizing established foodservice capabilities and comprehensive serving development. The UK records 5.2%, focusing on convenience dining trends and distribution expansion. Japan demonstrates 4.7% growth, prioritizing quality tableware solutions and technological advancement.
The report covers an in-depth analysis of 40+ countries top-performing countries are highlighted below.
Revenue from disposable plates consumption and sales in the USA is projected to exhibit strong growth with a CAGR of 5.8% through 2035, driven by the country's rapidly expanding outdoor dining sector, favorable consumer attitudes toward convenient serving solutions, and initiatives promoting efficient foodservice operations across major consumption regions. The USA's position as a leading foodservice market and increasing focus on operational efficiency development are creating substantial demand for high-quality disposable plates in both commercial and specialty markets. Major restaurant chains and catering companies are establishing comprehensive supply capabilities to serve growing demand and emerging market opportunities.
Revenue from disposable plates products in Germany is expanding at a CAGR of 5.4%, supported by rising serving sophistication, growing institutional feeding requirements, and expanding catering infrastructure. The country's developing event capabilities and increasing commercial investment in efficient foodservice are driving demand for disposable plates across both imported and domestically produced applications.
International tableware companies and domestic manufacturers are establishing comprehensive operational networks to address growing market demand for quality disposable plates and efficient serving solutions.
Revenue from disposable plates products in the UK is projected to grow at a CAGR of 5.2% through 2035, supported by the country's mature foodservice market, established takeaway culture, and leadership in convenience dining. Britain's sophisticated catering infrastructure and strong support for outdoor events are creating steady demand for both traditional and innovative disposable plate varieties.
Leading foodservice brands and specialty distributors are establishing comprehensive operational strategies to serve both domestic markets and growing event opportunities.
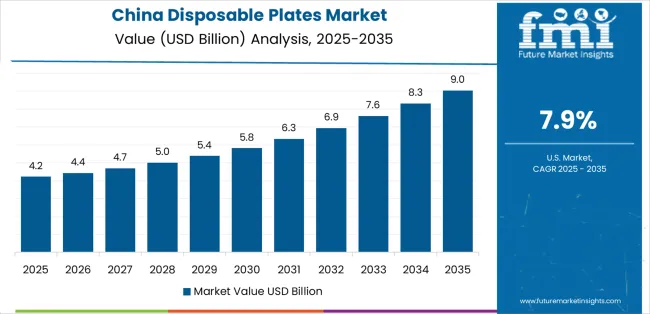
Revenue from disposable plates products in China is projected to grow at a CAGR of 7.9% through 2035, driven by the country's emphasis on quick-service expansion, foodservice leadership, and sophisticated production capabilities for tableware requiring specialized material varieties.
Chinese manufacturers and distributors consistently seek commercial-grade plates that enhance service differentiation and support dining operations for both traditional and innovative foodservice applications. The country's position as an Asian manufacturing leader continues to drive innovation in specialty disposable plate applications and commercial production standards.
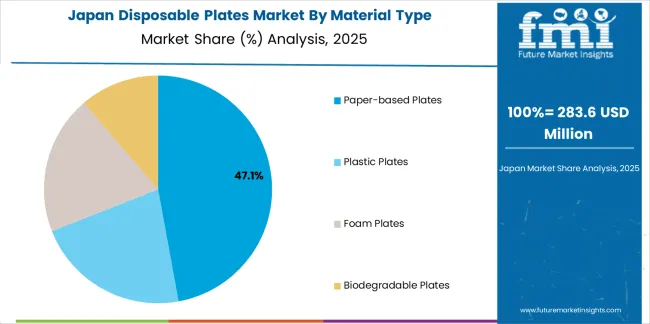
Revenue from disposable plates products in Japan is projected to grow at a CAGR of 4.7% through 2035, supported by the country's emphasis on hygiene standards, serving quality, and advanced material integration requiring efficient tableware solutions.
Japanese businesses and foodservice operators prioritize material safety and product consistency, making disposable plates essential tableware for both traditional and modern dining applications. The country's comprehensive quality excellence and advancing serving patterns support continued market expansion.
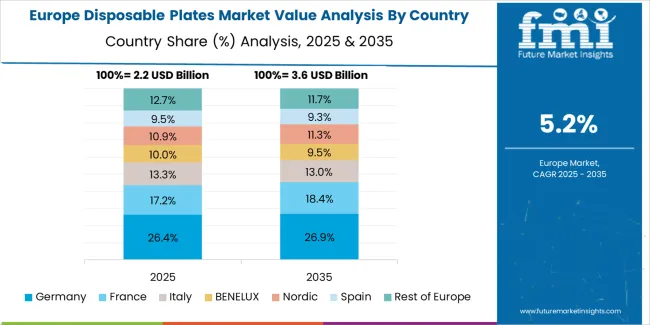
The Europe disposable plates market is projected to grow from USD 2.8 billion in 2025 to USD 4.9 billion by 2035, recording a CAGR of 5.8% over the forecast period. Germany leads the region with a 35.5% share in 2025, moderating slightly to 35.0% by 2035, supported by its strong foodservice base and demand for efficient, technically advanced serving products.
The United Kingdom follows with 23.5% in 2025, easing to 23.0% by 2035, driven by a sophisticated catering market and emphasis on convenience dining standards. France accounts for 17.5% in 2025, rising to 18.0% by 2035, reflecting steady adoption of outdoor dining solutions and event catering optimization. Italy holds 12.0% in 2025, expanding to 12.5% by 2035 as foodservice innovation and specialty serving applications grow.
Spain contributes 7.5% in 2025, growing to 8.0% by 2035, supported by expanding tourism sector and outdoor dining culture. The Nordic countries rise from 2.5% in 2025 to 2.8% by 2035 on the back of strong event culture and advanced material technologies. BENELUX remains at 1.5% share in 2025, rising slightly to 1.7% by 2035, reflecting mature, efficiency-focused markets.
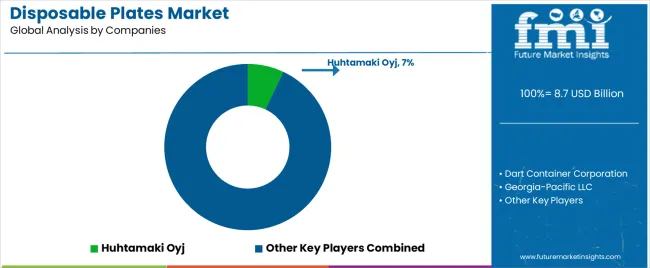
The disposable plates market is characterized by competition among established tableware manufacturers, specialized disposable product producers, and integrated foodservice solution companies. Companies are investing in plate forming technologies, advanced material processing systems, product innovation capabilities, and comprehensive distribution networks to deliver consistent, high-quality, and reliable disposable plate systems. Innovation in biodegradability enhancement, structural integrity methods, and application-specific product development is central to strengthening market position and customer satisfaction.
Huhtamaki Oyj leads the market with a strong focus on foodservice innovation and comprehensive disposable plate solutions, offering commercial tableware systems with emphasis on manufacturing excellence and technological heritage. Dart Container Corporation provides specialized disposable capabilities with a focus on North American market applications and material engineering networks. Georgia-Pacific LLC delivers integrated paper product solutions with a focus on foodservice positioning and operational efficiency. Pactiv LLC specializes in comprehensive plate manufacturing with an emphasis on commercial applications. Genpak LLC focuses on comprehensive foodservice containers with advanced design and premium positioning capabilities.
The success of disposable plates in meeting commercial foodservice demands, operator-driven convenience requirements, and performance integration will not only enhance service efficiency outcomes but also strengthen global tableware manufacturing capabilities. It will consolidate emerging regions' positions as hubs for efficient plate production and align advanced economies with commercial serving systems. This calls for a concerted effort by all stakeholders - governments, industry bodies, manufacturers, distributors, and investors. Each can be a crucial enabler in preparing the market for its next phase of growth.
How Governments Could Spur Local Production and Adoption?
How Industry Bodies Could Support Market Development?
How Distributors and Foodservice Industry Players Could Strengthen the Ecosystem?
How Manufacturers Could Navigate the Shift?
| Item | Value |
|---|---|
| Quantitative Units (2025) | USD 8.7 billion |
| Material Type | Paper-based Plates; Plastic Plates; Foam Plates; Biodegradable Plates |
| Plate Size | Small (Below 7 inches); Medium (7–9 inches); Large (9–10.5 inches); Extra-large (Above 10.5 inches) |
| Design Type | Plain Plates; Compartmented Plates; Decorative Plates |
| End-Use Application | Foodservice; Retail; Institutional; Events & Catering; Other Applications |
| Regions | North America; Europe; Asia Pacific; Latin America; Middle East & Africa; Other Regions |
| Key Countries | United States; Germany; United Kingdom; China; Japan; and 40+ additional countries |
| Key Companies | Huhtamaki Oyj; Dart Container Corporation; Georgia-Pacific LLC; Pactiv LLC; Genpak LLC; other leading disposable plate companies |
| Additional Attributes | Dollar sales by material type, plate size, design type, end-use, and region; Regional demand trends; Competitive landscape; Technological advancements in plate forming engineering; Biodegradability integration initiatives; Barrier coating programs; Premium product development strategies |
The global disposable plates market is estimated to be valued at USD 8.7 billion in 2025.
The market size for the disposable plates market is projected to reach USD 15.9 billion by 2035.
The disposable plates market is expected to grow at a 6.2% CAGR between 2025 and 2035.
The key product types in disposable plates market are paper-based plates, plastic plates, foam plates and biodegradable plates.
In terms of end-use application, foodservice segment to command 56.0% share in the disposable plates market in 2025.


Full Research Suite comprises of:
Market outlook & trends analysis
Interviews & case studies
Strategic recommendations
Vendor profiles & capabilities analysis
5-year forecasts
8 regions and 60+ country-level data splits
Market segment data splits
12 months of continuous data updates
DELIVERED AS:
PDF EXCEL ONLINE
Market Share Breakdown of Disposable Plates Providers
Aluminum Disposable Plates Market Size and Share Forecast Outlook 2025 to 2035
Disposable Food Containers Market Size and Share Forecast Outlook 2025 to 2035
Disposable Protective Apparel Market Size and Share Forecast Outlook 2025 to 2035
Disposable Hygiene Adhesives Market Size and Share Forecast Outlook 2025 to 2035
Disposable Umbilical Cord Protection Bag Market Size and Share Forecast Outlook 2025 to 2035
Disposable E-Cigarettes Market Size and Share Forecast Outlook 2025 to 2035
Disposable Pen Injectors Market Size and Share Forecast Outlook 2025 to 2035
Disposable Trocars Market Analysis - Size, Share, and Forecast Outlook 2025 to 2035
Disposable Cups Market Size and Share Forecast Outlook 2025 to 2035
Disposable Electric Toothbrushes Market Size and Share Forecast Outlook 2025 to 2035
Disposable Barrier Sleeves Market Size and Share Forecast Outlook 2025 to 2035
Disposable Plastic Pallet Market Size and Share Forecast Outlook 2025 to 2035
Disposable Curd Cups Market Size and Share Forecast Outlook 2025 to 2035
Disposable Egg Trays Market Size and Share Forecast Outlook 2025 to 2035
Disposable Blood Pressure Cuffs Market Analysis - Size, Share & Forecast 2025 to 2035
Disposable Cutlery Market Size, Growth, and Forecast 2025 to 2035
Disposable Spinal Instruments Market Analysis - Size, Share, and Forecast 2025 to 2035
Disposable Lids Market Analysis - Growth & Forecast 2025 to 2035
Disposable Face Mask Market Insights – Growth & Demand 2025 to 2035

Thank you!
You will receive an email from our Business Development Manager. Please be sure to check your SPAM/JUNK folder too.
Chat With
MaRIA