Reports

- Global Locations -

Headquarters

Future Market Insights, Inc.

Christiana Corporate, 200
Continental Drive, Suite 401,
Newark, Delaware - 19713,
United States

T: +1-845-579-5705

Americas

Future Market Insights, Inc.

616 Corporate Way, Suite 2-9018,
Valley Cottage, NY 10989, United States

T: +1-347-918-3531

MEA

Future Market Insights

1602-6 Jumeirah Bay X2 Tower, Plot No: JLT-PH2-X2A,
Jumeirah Lakes Towers, Dubai,
United Arab Emirates

Europe

Future Market Insights

3rd Floor, 207 Regent Street,
W1B 3HH London
United Kingdom

T: + 44 (0) 20 8123 9659
D: +44 (0) 20 3287 4268

Asia Pacific

Future Market Insights

IndiaLand Global Tech Park, Unit UG-1, Behind Grand HighStreet, Phase 1, Hinjawadi, MH, Pune – 411057, India

Disposable Food Containers Market Outlook (2023 to 2033)

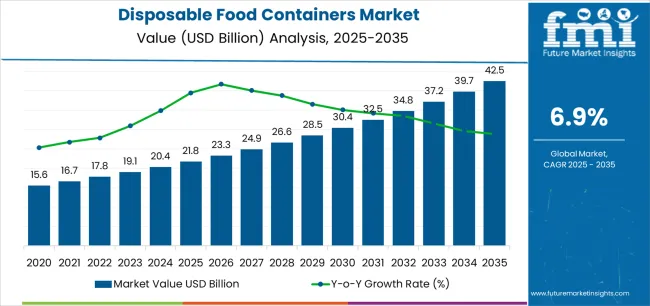
The global disposable food containers sales totaled US$ 16.9 billion in 2022 and are likely to reach a valuation of US$ 17.76 billion in 2023. With the rising adoption of disposable food containers across sectors like restaurants and eateries due to their low cost and sanitary nature, the global disposable food containers market size is projected to grow at 5.1% CAGR during the forecast period of 2023 and 2033.

Over the years, increased acceptance of single-use containers across the globe has resulted in a meteoric rise in demand for disposable food containers, and the trend is likely to continue during the forecast period.

Disposable food containers are packaging solutions made from polypropylene, polystyrene, paper, aluminum, polyethylene, etc. These containers are gaining wider acceptance worldwide because of their extensive applicability in varied industries and households.

These lightweight and cost-effective containers offer benefits such as better sanitation, convenience, and minimum food spoilage. As a result, these disposable packaging solutions are widely used in restaurants, hotels, institutions, offices, hospitals, and households.

Growing demand for takeout, fast food, and ready-made food due to changing lifestyles and increasing disposable income is likely to catalyze growth in the global disposable food containers market.

Demand is especially soaring for paper-based food containers due to their eco-friendly nature. They are preferred over other containers as paper packaging does not damage the environment and can be 100% recycled.

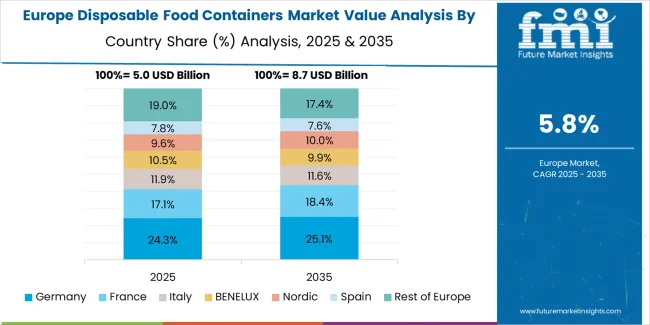
Regionally, Europe may remain the leading disposable food containers market, with total sales valued at US$ 4.8 Billion in 2023. The huge uproar in demand for sustainable packaging products in the region positively contributes to the expansion of the disposable food containers market.

Disposable Food Containers Industry (From 2018 to 2022)

Attribute Details
CAGR 3.1%
Market Size - 2018 US$ 14.96 billion
Market Size - 2022 US$ 16.9 billion

Disposable Food Containers Industry (From 2023 to 2033)

Attribute Details
CAGR 5.1%
Market Size - 2023 US$ 17.76 billion
Market Size - 2033 US$ 29.21 billion

Don't pay for what you don't need

Customize your report by selecting specific countries or regions and save 30%!

Innovation Unleashed: The Dynamic Disposable Food Containers Market Landscape from 2018 to the Explosive 2033

The global disposable food containers market witnessed growth at a moderate CAGR of 3.1% from 2018 to 2022. With the rise in the number of young consumers preferring on-the-go meals over traditional ones and worldwide acceptance of disposable food packaging, the overall demand for disposable food containers is anticipated to escalate at 5.1% CAGR between 2023 and 2033, totaling around US$ 29.21 billion by 2033.

Over the past few decades, due to rapid urbanization and globalization, the world’s largest food chains have increased their geographical presence to stay ahead of their competitors.

  • For example, in 2010, Domino’s Pizza operated more than 9,351 outlets worldwide, but in 2021, the total number of pizza outlets operated by Domino’s reached 18,300. Today, it works in more than 90 international markets across the globe.

Global food giants depend heavily on attractive packaging to maintain brand recall value among consumers. As a result, they are adopting packaging solutions like disposable food containers, especially for takeout food products.

Leading packaging giants such as Mondi and the WestRock Company are continuously innovating to improve the sustainability of their products to help their customers meet sustainability goals. They are expanding their existing production capabilities to cope with the huge rise in demand for portable food containers from international food chains across the globe.

The rise in the number of outlets is likely to augment the demand for disposable food containers and easy-to-dispose packaging products worldwide over the next ten years.

What are the Key Trends Driving the Global Disposable Food Containers Industry?

Customized Disposable Food Containers from Sustainable Raw Materials and Minimal Design to Gain Traction

Globally renowned food producers opt for packaging solutions, which allow them to offer differentiated products compared to competitors' products. To fulfill consumers' advanced needs, packaging manufacturers offer customized food containers, which helps marketers and international food chains stay ahead of their competitors.

Minimalism is gaining traction across the food packaging industry. This includes simplistic, clear labeling and packaging of the consumables. Marketers use such packaging to highlight the product's value, keeping it simple and making it look clean. Adopting such packaging reduces the overall cost of designing and printing the package.

Sustainably sourced raw materials are being used by packaging manufacturers around the world to target environmentally concerned consumer bases. Disposable food container manufacturers are also using renewable raw materials to position themselves as sustainable practitioners and gain popularity among the masses.

Low Cost and Enhanced Hygiene Features to Bolster Sales of Disposable Food Containers

The easy availability of disposable food containers made up of different materials such as plastic, paper, and aluminum makes them the most preferred food packaging solution by food manufacturers worldwide.

Growing awareness regarding hygiene and the spread of diseases through touch promotes single-use packaging products, which results in increased demand for disposable packaging solutions to fulfill the advanced needs of the consumer base.

People prefer disposable food containers over reusable ones, as these containers can be easily disposed of and are comparatively cost-effective compared to reusable containers. The disposable food containers do not require additional labor costs for cleaning, which is mandatory for reusable containers.

The factors mentioned above make disposable food containers the most demanded food-packaging solution for restaurants, cafeterias, canteens, QSRs, and many other facilities where food is served to customers.

Disposable food packaging giants offer containers specifically designed for certain items, making it more convenient for consumers to carry those items. All these factors are leading to a heavy rise in disposable food container sales globally.

Ismail Sutaria
Ismail Sutaria

Principal Consultant

Talk to Analyst

Find your sweet spots for generating winning opportunities in this market.

Category- Wise Outlook

Segment Material
Segment Name Paper and Paperboard
Attributes CAGR - 5.1%
Segment End Use
Segment Name Restaurants and Eateries
Attributes Segment Share - 39%

Which is the Most Used Material for Disposable Food Containers?

Paper and Paperboard May Remain the Most Preferred Material

The innovation-driven packaging industry has enabled manufacturers to use advanced manufacturing techniques and produce high-quality packaging products, even using recycled raw materials as input.

Paper & paperboard are estimated to be the most accepted materials for producing disposable food containers. The growing market popularity of paper-based food containers can also be attributed to the harmful impact of plastics on the ecosystem and increased awareness among consumer bases.

FMI predicts the disposable food container sales made of paper & paperboard to surge at a progressive CAGR of 5.1% between 2023 and 2033.

Similarly, changing environmental policies by international trade bodies and federal governments aiming at reducing the production and consumption of plastic products globally may push the demand for disposable food containers made using paper.

Which is the Leading End User of Disposable Food Containers?

Disposable Food Container Sales to Remain Concentrated in Restaurants and Eateries

As per FMI’s analysis, restaurants and eateries are expected to account for almost 39% of total disposable food containers sold across the globe in 2023. Increased awareness regarding takeaway and online deliveries of food in the HORECA sector of developing markets of Asia and Latin America are factors spurring sales of disposable food containers across restaurants and eateries.

Regional Outlook

What Makes the United States a Prominent Market for Disposable Food Containers Across the Globe?

Stringent Regulations About Plastic Usage Encouraging Adoption of Disposable Food Containers in the United States

The various regulations laid down by the United States Food & Drug Administration have greatly reduced the harmful food packaging materials from food packaging across the country. These regulations allow food manufacturers to use only specific types of plastics for food-contact applications.

Increasing efforts of the regulating authorities and packaging manufacturers to promote disposable food packaging as a cost-effective alternative to reusable food packaging is playing a crucial role in triggering the growth of the disposable food containers market in the United States.

The total sales of disposable food containers across the United States are projected to reach US$ 4.8 Billion in 2023, owing to an exuberating rise in demand for single-use food containers across the country, the growing popularity of eco-friendly food containers, increasing investments in Research and Development, and strong presence of leading packaging giants.

Over the years, the growing popularity of takeout food has resulted in the generation of waste by single-use plastic containers. To tackle this situation, packaging manufacturers and researchers are creating novel disposable food containers that are more eco-friendly.

  • In June 2022, engineers at the University of Maine created a grease-proof, water-resistant container from recyclable cellulose nanocomposites that are believed to be the next big thing in takeout technology.
  • In 2020, Footprint, the United States-based company, launched PFAS-free, plant-based containers that are compostable and biodegradable.

Why is Germany Emerging as a Lucrative Disposable Food Containers Market in Europe?

Growing Adoption of Paper-based Disposable Food Containers to Curb Plastic Pollution Pushing Demand in Germany

As per the latest guidelines by the European Union, it has issued a Single-use Plastics Directive in which it orders all member countries to report annual data on single-use plastic products used in packaging to reduce their consumption. The regulation mentioned above offers a profitable growth opportunity for packaging manufacturers offering disposable food containers made up of paper & paperboard across Germany.

Regarding value projection, the German disposable food containers market is likely to create a lucrative growth opportunity of US$ 491 million between 2023 and 2033. A huge uproar in demand for paper-based disposable food containers and rising consumer bases which are environmentally concerned, make its leading market for one-use food containers across Europe.

Similarly, various leading packaging businesses based in Germany are continuously looking to develop more sustainable plastic that can decompose without polluting nature. This may positively impact sales in the German disposable food containers market during the assessment period.

Food delivery companies across Germany are putting various efforts to reduce plastic waste.

  • In 2019, German food delivery company Delivery Hero announced an investment in biodegradable packaging manufacturer Bio-Lutions.

Get the data you need at a Fraction of the cost

Personalize your report by choosing insights you need
and save 40%!

What Marketing Tactics Can Manufacturers Utilize To Promote Disposable Food Containers Market?

  • Social media marketing to engage new customers and attract a larger audience.
  • Work with eateries and food suppliers to co-brand packaging to promote their brands.
  • To demonstrate the usability and convenience of disposable food containers, provide product samples and product demonstrations.
  • Use environmentally friendly messages to draw in customers who care about the environment.
  • To promote group purchases and client loyalty, give discounts and special deals.
  • To generate interest in and credibility for the product, use influencer marketing.
  • To present the product to a specific audience, go to trade events and exhibits in the food business.
  • Use online marketing tactics like search engine optimization (SEO) to increase visibility in search results.

Competitive Landscape

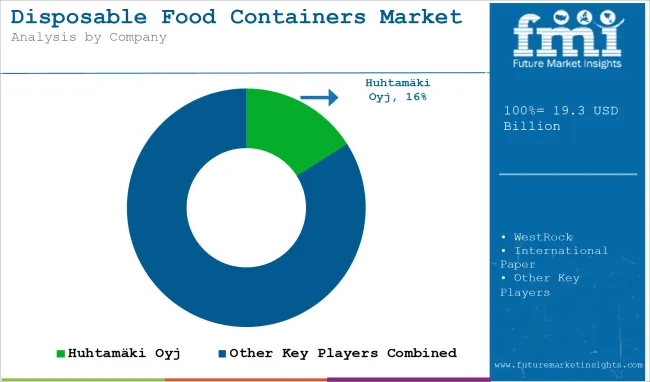
The worldwide disposable food containers market must be more cohesive and competitive with numerous local and regional competitors. Key disposable food container manufacturers, including the WestRock Company and Mondi, use various marketing techniques, including mergers & acquisitions, expansions, collaborations, and partnerships.

Stora Enso Oyj, The WestRock Company, and Mondi - Making the Earth Greener with Renewable and Eco-friendly Disposable Food Containers

Stora Enso Oyj, The WestRock Company, and Mondi are the top 3 companies changing this planet by introducing eco-friendly disposable food containers. Stora Enso is a leading bio-economy-based company that assists clients in fulfilling the demand for renewable, eco-friendly goods by producing solutions based on wood and biomass for various sectors.

The company is the first to step toward renewable energy and recyclable materials. For instance, on March 23rd, 2022, the company announced the launch of CarrEco Brown, a recyclable takeaway bag made from 100% fresh fibers for food containers.

Stora Enso's primary goal is to Do good for the people and planet. In line with the company's conviction that everything that can be created from fossil fuels today may also be made from trees tomorrow, Stora Enso's mission statement, Replace non-renewable resources with renewable goods, emphasizes the company's ability to contribute to a greener economy.

Likewise, WestRock is another company stepping on the recyclable and renewable energy ladder. It is considered one of the leading packaging giants, with over 320 manufacturing facilities, design centers, research labs, and sales offices worldwide. Since its establishment, WestRock has been innovating to produce environmentally friendly packaging solutions and, for instance, recently launched a new 100% recyclable and sustainable container.

Another global manufacturer and supplier of disposable food containers is Mondi. The company constantly strives to contribute to a better world by making sustainable and innovative packaging and paper solutions.

Mondi also adopts new product launches, partnerships, and acquisitions to expand its customer base. For instance, in August 2022, Mondi agreed to acquire Duino Mill for a total consideration of US$ 40 million.

Recently, the company announced that it invested nearly €65 million in three Consumer Flexibles packaging facilities in Europe to address the rising demand from consumers for environmentally friendly pet food packaging options.

Essential Disposable Food Containers Manufacturers

  • Stora Enso Oyj
  • The WestRock Company
  • DS Smith Plc
  • Mondi Group Plc
  • Smurfit Kappa Group
  • Sonoco Products Company
  • Sealed Air Corporation
  • Georgia Pacific LLC
  • DOpla SpA
  • Dart Container Corporation
  • Huhtamäki Oyj
  • D&W Fine Pack
  • Gold Plast SPA
  • SOLIA, Inc.
  • Vegware Ltd
  • Tn food container manufacturers
  • ENPAK Eco-Friendly Food Container
  • Lacerta Group, Inc.
  • South Plastic Industry Co., Ltd.
  • Arafhat Plastics

Recent Developments

Besides this, they are continuously launching new products with innovative materials and designs. Some of the recent developments in the disposable food containers market are listed below:

Company Footprint
Strategy Footprint's Innovative Plant-Based Clamshell Containers
Details In November 2020, Footprint, a sustainable technology firm specializing in materials science engineering, launched its new plant-based clamshell food containers.
Company Stora Enso Oyj
Strategy Stora Enso Oyj and Picadeli's Eco-Friendly Collaboration
Details In February 2022, Stora Enso Oyj collaborated with Picadeli to replace plastic packaging in salad packaging by producing a plastic-free, recyclable alternative for takeaway packaging.
Company The WestRock Company
Strategy WestRock and Swiss Chalet Join Forces
Details In April 2022, The WestRock Company collaborated with Swiss Chalet to launch recyclable paperboard packaging for its restaurant chain in Canada.

Key Segments

By Material:

  • Polypropylene (PP)
  • Polystyrene (PS)
  • Polyethylene Terephthalate (PET)
  • Paper and Paperboard
  • Aluminium
  • Bagasse
  • Starch-based

By Application:

  • Fresh food
  • Good takeaway
  • Retail

By End Use:

  • Restaurants and eateries
  • Take-away and online delivery
  • Catering services
  • Institutional

By Region:

  • North America
  • Latin America
  • Europe
  • South Asia
  • East Asia
  • Middle East & Africa
  • Oceania

Frequently Asked Questions

What is the market value in 2023?

The market is valued at US$ 17.7 billion in 2023.

What is the CAGR from 2023 to 2033?

The market’s CAGR from 2023 to 2033 will be 5.1%.

Who are the key market players?

Stora Enso Oyj, The WestRock Company, and DS Smith Plc. are key market players.

Which is the key segment by end user?

Restaurants & eateries segment is likely to remain preferred through 2033.

What will the market size be in 2033?

The market will reach US$ 29.2 billion by 2033.

Table of Content

1. Executive Summary

    1.1. Global Market Outlook

    1.2. Demand-side Trends

    1.3. Supply-side Trends

    1.4. Technology Roadmap Analysis

    1.5. Analysis and Recommendations

2. Market Overview

    2.1. Market Coverage / Taxonomy

    2.2. Market Definition / Scope / Limitations

3. Market Background

    3.1. Market Dynamics

        3.1.1. Drivers

        3.1.2. Restraints

        3.1.3. Opportunity

        3.1.4. Trends

    3.2. Scenario Forecast

        3.2.1. Demand in Optimistic Scenario

        3.2.2. Demand in Likely Scenario

        3.2.3. Demand in Conservative Scenario

    3.3. Opportunity Map Analysis

    3.4. Product Life Cycle Analysis

    3.5. Supply Chain Analysis

        3.5.1. Supply Side Participants and their Roles

            3.5.1.1. Producers

            3.5.1.2. Mid-Level Participants (Traders/ Agents/ Brokers)

            3.5.1.3. Wholesalers and Distributors

        3.5.2. Value Added and Value Created at Node in the Supply Chain

        3.5.3. List of Raw Material Suppliers

        3.5.4. List of Existing and Potential Buyer’s

    3.6. Investment Feasibility Matrix

    3.7. Value Chain Analysis

        3.7.1. Profit Margin Analysis

        3.7.2. Wholesalers and Distributors

        3.7.3. Retailers

    3.8. PESTLE and Porter’s Analysis

    3.9. Regulatory Landscape

        3.9.1. By Key Regions

        3.9.2. By Key Countries

    3.10. Regional Parent Market Outlook

    3.11. Production and Consumption Statistics

    3.12. Import and Export Statistics

4. Global Market Analysis 2018 to 2022 and Forecast, 2023 to 2033

    4.1. Historical Market Size Value (US$ Million) & Volume (Units) Analysis, 2018 to 2022

    4.2. Current and Future Market Size Value (US$ Million) & Volume (Units) Projections, 2023 to 2033

        4.2.1. Y-o-Y Growth Trend Analysis

        4.2.2. Absolute $ Opportunity Analysis

5. Global Market Analysis 2018 to 2022 and Forecast 2023 to 2033, By Material

    5.1. Introduction / Key Findings

    5.2. Historical Market Size Value (US$ Million) & Volume (Units) Analysis By Material, 2018 to 2022

    5.3. Current and Future Market Size Value (US$ Million) & Volume (Units) Analysis and Forecast By Material, 2023 to 2033

        5.3.1. Polypropylene (PP)

        5.3.2. Polystyrene (PS)

        5.3.3. Polyethylene Terephthalate (PET)

        5.3.4. Paper and Paperboard

        5.3.5. Aluminium

        5.3.6. Bagasse

        5.3.7. Starch-based

    5.4. Y-o-Y Growth Trend Analysis By Material, 2018 to 2022

    5.5. Absolute $ Opportunity Analysis By Material, 2023 to 2033

6. Global Market Analysis 2018 to 2022 and Forecast 2023 to 2033, By Application

    6.1. Introduction / Key Findings

    6.2. Historical Market Size Value (US$ Million) & Volume (Units) Analysis By Application, 2018 to 2022

    6.3. Current and Future Market Size Value (US$ Million) & Volume (Units) Analysis and Forecast By Application, 2023 to 2033

        6.3.1. Fresh Food

        6.3.2. Good Takeaway

        6.3.3. Retail

    6.4. Y-o-Y Growth Trend Analysis By Application, 2018 to 2022

    6.5. Absolute $ Opportunity Analysis By Application, 2023 to 2033

7. Global Market Analysis 2018 to 2022 and Forecast 2023 to 2033, By End Use

    7.1. Introduction / Key Findings

    7.2. Historical Market Size Value (US$ Million) & Volume (Units) Analysis By End Use, 2018 to 2022

    7.3. Current and Future Market Size Value (US$ Million) & Volume (Units) Analysis and Forecast By End Use, 2023 to 2033

        7.3.1. Restaurants and Eateries

        7.3.2. Take-away and Online Delivery

        7.3.3. Catering Services

        7.3.4. Institutional

    7.4. Y-o-Y Growth Trend Analysis By End Use, 2018 to 2022

    7.5. Absolute $ Opportunity Analysis By End Use, 2023 to 2033

8. Global Market Analysis 2018 to 2022 and Forecast 2023 to 2033, By Region

    8.1. Introduction

    8.2. Historical Market Size Value (US$ Million) & Volume (Units) Analysis By Region, 2018 to 2022

    8.3. Current Market Size Value (US$ Million) & Volume (Units) Analysis and Forecast By Region, 2023 to 2033

        8.3.1. North America

        8.3.2. Latin America

        8.3.3. Western Europe

        8.3.4. Eastern Europe

        8.3.5. South Asia and Pacific

        8.3.6. East Asia

        8.3.7. Middle East and Africa

    8.4. Market Attractiveness Analysis By Region

9. North America Market Analysis 2018 to 2022 and Forecast 2023 to 2033, By Country

    9.1. Historical Market Size Value (US$ Million) & Volume (Units) Trend Analysis By Market Taxonomy, 2018 to 2022

    9.2. Market Size Value (US$ Million) & Volume (Units) Forecast By Market Taxonomy, 2023 to 2033

        9.2.1. By Country

            9.2.1.1. USA

            9.2.1.2. Canada

        9.2.2. By Material

        9.2.3. By Application

        9.2.4. By End Use

    9.3. Market Attractiveness Analysis

        9.3.1. By Country

        9.3.2. By Material

        9.3.3. By Application

        9.3.4. By End Use

    9.4. Key Takeaways

10. Latin America Market Analysis 2018 to 2022 and Forecast 2023 to 2033, By Country

    10.1. Historical Market Size Value (US$ Million) & Volume (Units) Trend Analysis By Market Taxonomy, 2018 to 2022

    10.2. Market Size Value (US$ Million) & Volume (Units) Forecast By Market Taxonomy, 2023 to 2033

        10.2.1. By Country

            10.2.1.1. Brazil

            10.2.1.2. Mexico

            10.2.1.3. Rest of Latin America

        10.2.2. By Material

        10.2.3. By Application

        10.2.4. By End Use

    10.3. Market Attractiveness Analysis

        10.3.1. By Country

        10.3.2. By Material

        10.3.3. By Application

        10.3.4. By End Use

    10.4. Key Takeaways

11. Western Europe Market Analysis 2018 to 2022 and Forecast 2023 to 2033, By Country

    11.1. Historical Market Size Value (US$ Million) & Volume (Units) Trend Analysis By Market Taxonomy, 2018 to 2022

    11.2. Market Size Value (US$ Million) & Volume (Units) Forecast By Market Taxonomy, 2023 to 2033

        11.2.1. By Country

            11.2.1.1. Germany

            11.2.1.2. UK

            11.2.1.3. France

            11.2.1.4. Spain

            11.2.1.5. Italy

            11.2.1.6. Rest of Western Europe

        11.2.2. By Material

        11.2.3. By Application

        11.2.4. By End Use

    11.3. Market Attractiveness Analysis

        11.3.1. By Country

        11.3.2. By Material

        11.3.3. By Application

        11.3.4. By End Use

    11.4. Key Takeaways

12. Eastern Europe Market Analysis 2018 to 2022 and Forecast 2023 to 2033, By Country

    12.1. Historical Market Size Value (US$ Million) & Volume (Units) Trend Analysis By Market Taxonomy, 2018 to 2022

    12.2. Market Size Value (US$ Million) & Volume (Units) Forecast By Market Taxonomy, 2023 to 2033

        12.2.1. By Country

            12.2.1.1. Poland

            12.2.1.2. Russia

            12.2.1.3. Czech Republic

            12.2.1.4. Romania

            12.2.1.5. Rest of Eastern Europe

        12.2.2. By Material

        12.2.3. By Application

        12.2.4. By End Use

    12.3. Market Attractiveness Analysis

        12.3.1. By Country

        12.3.2. By Material

        12.3.3. By Application

        12.3.4. By End Use

    12.4. Key Takeaways

13. South Asia and Pacific Market Analysis 2018 to 2022 and Forecast 2023 to 2033, By Country

    13.1. Historical Market Size Value (US$ Million) & Volume (Units) Trend Analysis By Market Taxonomy, 2018 to 2022

    13.2. Market Size Value (US$ Million) & Volume (Units) Forecast By Market Taxonomy, 2023 to 2033

        13.2.1. By Country

            13.2.1.1. India

            13.2.1.2. Bangladesh

            13.2.1.3. Australia

            13.2.1.4. New Zealand

            13.2.1.5. Rest of South Asia and Pacific

        13.2.2. By Material

        13.2.3. By Application

        13.2.4. By End Use

    13.3. Market Attractiveness Analysis

        13.3.1. By Country

        13.3.2. By Material

        13.3.3. By Application

        13.3.4. By End Use

    13.4. Key Takeaways

14. East Asia Market Analysis 2018 to 2022 and Forecast 2023 to 2033, By Country

    14.1. Historical Market Size Value (US$ Million) & Volume (Units) Trend Analysis By Market Taxonomy, 2018 to 2022

    14.2. Market Size Value (US$ Million) & Volume (Units) Forecast By Market Taxonomy, 2023 to 2033

        14.2.1. By Country

            14.2.1.1. China

            14.2.1.2. Japan

            14.2.1.3. South Korea

        14.2.2. By Material

        14.2.3. By Application

        14.2.4. By End Use

    14.3. Market Attractiveness Analysis

        14.3.1. By Country

        14.3.2. By Material

        14.3.3. By Application

        14.3.4. By End Use

    14.4. Key Takeaways

15. Middle East and Africa Market Analysis 2018 to 2022 and Forecast 2023 to 2033, By Country

    15.1. Historical Market Size Value (US$ Million) & Volume (Units) Trend Analysis By Market Taxonomy, 2018 to 2022

    15.2. Market Size Value (US$ Million) & Volume (Units) Forecast By Market Taxonomy, 2023 to 2033

        15.2.1. By Country

            15.2.1.1. GCC Countries

            15.2.1.2. South Africa

            15.2.1.3. Israel

            15.2.1.4. Rest of MEA

        15.2.2. By Material

        15.2.3. By Application

        15.2.4. By End Use

    15.3. Market Attractiveness Analysis

        15.3.1. By Country

        15.3.2. By Material

        15.3.3. By Application

        15.3.4. By End Use

    15.4. Key Takeaways

16. Key Countries Market Analysis

    16.1. USA

        16.1.1. Pricing Analysis

        16.1.2. Market Share Analysis, 2022

            16.1.2.1. By Material

            16.1.2.2. By Application

            16.1.2.3. By End Use

    16.2. Canada

        16.2.1. Pricing Analysis

        16.2.2. Market Share Analysis, 2022

            16.2.2.1. By Material

            16.2.2.2. By Application

            16.2.2.3. By End Use

    16.3. Brazil

        16.3.1. Pricing Analysis

        16.3.2. Market Share Analysis, 2022

            16.3.2.1. By Material

            16.3.2.2. By Application

            16.3.2.3. By End Use

    16.4. Mexico

        16.4.1. Pricing Analysis

        16.4.2. Market Share Analysis, 2022

            16.4.2.1. By Material

            16.4.2.2. By Application

            16.4.2.3. By End Use

    16.5. Germany

        16.5.1. Pricing Analysis

        16.5.2. Market Share Analysis, 2022

            16.5.2.1. By Material

            16.5.2.2. By Application

            16.5.2.3. By End Use

    16.6. UK

        16.6.1. Pricing Analysis

        16.6.2. Market Share Analysis, 2022

            16.6.2.1. By Material

            16.6.2.2. By Application

            16.6.2.3. By End Use

    16.7. France

        16.7.1. Pricing Analysis

        16.7.2. Market Share Analysis, 2022

            16.7.2.1. By Material

            16.7.2.2. By Application

            16.7.2.3. By End Use

    16.8. Spain

        16.8.1. Pricing Analysis

        16.8.2. Market Share Analysis, 2022

            16.8.2.1. By Material

            16.8.2.2. By Application

            16.8.2.3. By End Use

    16.9. Italy

        16.9.1. Pricing Analysis

        16.9.2. Market Share Analysis, 2022

            16.9.2.1. By Material

            16.9.2.2. By Application

            16.9.2.3. By End Use

    16.10. Poland

        16.10.1. Pricing Analysis

        16.10.2. Market Share Analysis, 2022

            16.10.2.1. By Material

            16.10.2.2. By Application

            16.10.2.3. By End Use

    16.11. Russia

        16.11.1. Pricing Analysis

        16.11.2. Market Share Analysis, 2022

            16.11.2.1. By Material

            16.11.2.2. By Application

            16.11.2.3. By End Use

    16.12. Czech Republic

        16.12.1. Pricing Analysis

        16.12.2. Market Share Analysis, 2022

            16.12.2.1. By Material

            16.12.2.2. By Application

            16.12.2.3. By End Use

    16.13. Romania

        16.13.1. Pricing Analysis

        16.13.2. Market Share Analysis, 2022

            16.13.2.1. By Material

            16.13.2.2. By Application

            16.13.2.3. By End Use

    16.14. India

        16.14.1. Pricing Analysis

        16.14.2. Market Share Analysis, 2022

            16.14.2.1. By Material

            16.14.2.2. By Application

            16.14.2.3. By End Use

    16.15. Bangladesh

        16.15.1. Pricing Analysis

        16.15.2. Market Share Analysis, 2022

            16.15.2.1. By Material

            16.15.2.2. By Application

            16.15.2.3. By End Use

    16.16. Australia

        16.16.1. Pricing Analysis

        16.16.2. Market Share Analysis, 2022

            16.16.2.1. By Material

            16.16.2.2. By Application

            16.16.2.3. By End Use

    16.17. New Zealand

        16.17.1. Pricing Analysis

        16.17.2. Market Share Analysis, 2022

            16.17.2.1. By Material

            16.17.2.2. By Application

            16.17.2.3. By End Use

    16.18. China

        16.18.1. Pricing Analysis

        16.18.2. Market Share Analysis, 2022

            16.18.2.1. By Material

            16.18.2.2. By Application

            16.18.2.3. By End Use

    16.19. Japan

        16.19.1. Pricing Analysis

        16.19.2. Market Share Analysis, 2022

            16.19.2.1. By Material

            16.19.2.2. By Application

            16.19.2.3. By End Use

    16.20. South Korea

        16.20.1. Pricing Analysis

        16.20.2. Market Share Analysis, 2022

            16.20.2.1. By Material

            16.20.2.2. By Application

            16.20.2.3. By End Use

    16.21. GCC Countries

        16.21.1. Pricing Analysis

        16.21.2. Market Share Analysis, 2022

            16.21.2.1. By Material

            16.21.2.2. By Application

            16.21.2.3. By End Use

    16.22. South Africa

        16.22.1. Pricing Analysis

        16.22.2. Market Share Analysis, 2022

            16.22.2.1. By Material

            16.22.2.2. By Application

            16.22.2.3. By End Use

    16.23. Israel

        16.23.1. Pricing Analysis

        16.23.2. Market Share Analysis, 2022

            16.23.2.1. By Material

            16.23.2.2. By Application

            16.23.2.3. By End Use

17. Market Structure Analysis

    17.1. Competition Dashboard

    17.2. Competition Benchmarking

    17.3. Market Share Analysis of Top Players

        17.3.1. By Regional

        17.3.2. By Material

        17.3.3. By Application

        17.3.4. By End Use

18. Competition Analysis

    18.1. Competition Deep Dive

        18.1.1. Stora Enso Oyj

            18.1.1.1. Overview

            18.1.1.2. Product Portfolio

            18.1.1.3. Profitability by Market Segments

            18.1.1.4. Sales Footprint

            18.1.1.5. Strategy Overview

                18.1.1.5.1. Marketing Strategy

                18.1.1.5.2. Product Strategy

                18.1.1.5.3. Channel Strategy

        18.1.2. The WestRock Company

            18.1.2.1. Overview

            18.1.2.2. Product Portfolio

            18.1.2.3. Profitability by Market Segments

            18.1.2.4. Sales Footprint

            18.1.2.5. Strategy Overview

                18.1.2.5.1. Marketing Strategy

                18.1.2.5.2. Product Strategy

                18.1.2.5.3. Channel Strategy

        18.1.3. DS Smith Plc

            18.1.3.1. Overview

            18.1.3.2. Product Portfolio

            18.1.3.3. Profitability by Market Segments

            18.1.3.4. Sales Footprint

            18.1.3.5. Strategy Overview

                18.1.3.5.1. Marketing Strategy

                18.1.3.5.2. Product Strategy

                18.1.3.5.3. Channel Strategy

        18.1.4. Mondi Group Plc

            18.1.4.1. Overview

            18.1.4.2. Product Portfolio

            18.1.4.3. Profitability by Market Segments

            18.1.4.4. Sales Footprint

            18.1.4.5. Strategy Overview

                18.1.4.5.1. Marketing Strategy

                18.1.4.5.2. Product Strategy

                18.1.4.5.3. Channel Strategy

        18.1.5. Smurfit Kappa Group

            18.1.5.1. Overview

            18.1.5.2. Product Portfolio

            18.1.5.3. Profitability by Market Segments

            18.1.5.4. Sales Footprint

            18.1.5.5. Strategy Overview

                18.1.5.5.1. Marketing Strategy

                18.1.5.5.2. Product Strategy

                18.1.5.5.3. Channel Strategy

        18.1.6. Sonoco Products Company

            18.1.6.1. Overview

            18.1.6.2. Product Portfolio

            18.1.6.3. Profitability by Market Segments

            18.1.6.4. Sales Footprint

            18.1.6.5. Strategy Overview

                18.1.6.5.1. Marketing Strategy

                18.1.6.5.2. Product Strategy

                18.1.6.5.3. Channel Strategy

        18.1.7. Sealed Air Corporation

            18.1.7.1. Overview

            18.1.7.2. Product Portfolio

            18.1.7.3. Profitability by Market Segments

            18.1.7.4. Sales Footprint

            18.1.7.5. Strategy Overview

                18.1.7.5.1. Marketing Strategy

                18.1.7.5.2. Product Strategy

                18.1.7.5.3. Channel Strategy

        18.1.8. Georgia Pacific LLC

            18.1.8.1. Overview

            18.1.8.2. Product Portfolio

            18.1.8.3. Profitability by Market Segments

            18.1.8.4. Sales Footprint

            18.1.8.5. Strategy Overview

                18.1.8.5.1. Marketing Strategy

                18.1.8.5.2. Product Strategy

                18.1.8.5.3. Channel Strategy

        18.1.9. DOpla SpA

            18.1.9.1. Overview

            18.1.9.2. Product Portfolio

            18.1.9.3. Profitability by Market Segments

            18.1.9.4. Sales Footprint

            18.1.9.5. Strategy Overview

                18.1.9.5.1. Marketing Strategy

                18.1.9.5.2. Product Strategy

                18.1.9.5.3. Channel Strategy

        18.1.10. Dart Container Corporation

            18.1.10.1. Overview

            18.1.10.2. Product Portfolio

            18.1.10.3. Profitability by Market Segments

            18.1.10.4. Sales Footprint

            18.1.10.5. Strategy Overview

                18.1.10.5.1. Marketing Strategy

                18.1.10.5.2. Product Strategy

                18.1.10.5.3. Channel Strategy

        18.1.11. Huhtamäki Oyj

            18.1.11.1. Overview

            18.1.11.2. Product Portfolio

            18.1.11.3. Profitability by Market Segments

            18.1.11.4. Sales Footprint

            18.1.11.5. Strategy Overview

                18.1.11.5.1. Marketing Strategy

                18.1.11.5.2. Product Strategy

                18.1.11.5.3. Channel Strategy

        18.1.12. D&W Fine Pack

            18.1.12.1. Overview

            18.1.12.2. Product Portfolio

            18.1.12.3. Profitability by Market Segments

            18.1.12.4. Sales Footprint

            18.1.12.5. Strategy Overview

                18.1.12.5.1. Marketing Strategy

                18.1.12.5.2. Product Strategy

                18.1.12.5.3. Channel Strategy

        18.1.13. Gold Plast SPA

            18.1.13.1. Overview

            18.1.13.2. Product Portfolio

            18.1.13.3. Profitability by Market Segments

            18.1.13.4. Sales Footprint

            18.1.13.5. Strategy Overview

                18.1.13.5.1. Marketing Strategy

                18.1.13.5.2. Product Strategy

                18.1.13.5.3. Channel Strategy

        18.1.14. SOLIA, Inc.

            18.1.14.1. Overview

            18.1.14.2. Product Portfolio

            18.1.14.3. Profitability by Market Segments

            18.1.14.4. Sales Footprint

            18.1.14.5. Strategy Overview

                18.1.14.5.1. Marketing Strategy

                18.1.14.5.2. Product Strategy

                18.1.14.5.3. Channel Strategy

        18.1.15. Vegware Ltd

            18.1.15.1. Overview

            18.1.15.2. Product Portfolio

            18.1.15.3. Profitability by Market Segments

            18.1.15.4. Sales Footprint

            18.1.15.5. Strategy Overview

                18.1.15.5.1. Marketing Strategy

                18.1.15.5.2. Product Strategy

                18.1.15.5.3. Channel Strategy

        18.1.16. Tn food container manufacturers

            18.1.16.1. Overview

            18.1.16.2. Product Portfolio

            18.1.16.3. Profitability by Market Segments

            18.1.16.4. Sales Footprint

            18.1.16.5. Strategy Overview

                18.1.16.5.1. Marketing Strategy

                18.1.16.5.2. Product Strategy

                18.1.16.5.3. Channel Strategy

        18.1.17. ENPAK Eco-Friendly Food Container

            18.1.17.1. Overview

            18.1.17.2. Product Portfolio

            18.1.17.3. Profitability by Market Segments

            18.1.17.4. Sales Footprint

            18.1.17.5. Strategy Overview

                18.1.17.5.1. Marketing Strategy

                18.1.17.5.2. Product Strategy

                18.1.17.5.3. Channel Strategy

        18.1.18. Lacerta Group, Inc.

            18.1.18.1. Overview

            18.1.18.2. Product Portfolio

            18.1.18.3. Profitability by Market Segments

            18.1.18.4. Sales Footprint

            18.1.18.5. Strategy Overview

                18.1.18.5.1. Marketing Strategy

                18.1.18.5.2. Product Strategy

                18.1.18.5.3. Channel Strategy

        18.1.19. South Plastic Industry Co., Ltd.

            18.1.19.1. Overview

            18.1.19.2. Product Portfolio

            18.1.19.3. Profitability by Market Segments

            18.1.19.4. Sales Footprint

            18.1.19.5. Strategy Overview

                18.1.19.5.1. Marketing Strategy

                18.1.19.5.2. Product Strategy

                18.1.19.5.3. Channel Strategy

        18.1.20. Arafhat Plastics

            18.1.20.1. Overview

            18.1.20.2. Product Portfolio

            18.1.20.3. Profitability by Market Segments

            18.1.20.4. Sales Footprint

            18.1.20.5. Strategy Overview

                18.1.20.5.1. Marketing Strategy

                18.1.20.5.2. Product Strategy

                18.1.20.5.3. Channel Strategy

19. Assumptions & Acronyms Used

20. Research Methodology

Don't pay for what you don't need

Customize your report by selecting specific countries or regions and save 30%!

List of Tables

Table 1: Global Market Value (US$ Million) Forecast by Region, 2018 to 2022

Table 2: Global Market Volume (Units) Forecast by Region, 2018 to 2022

Table 3: Global Market Value (US$ Million) Forecast by Material, 2018 to 2022

Table 4: Global Market Volume (Units) Forecast by Material, 2018 to 2022

Table 5: Global Market Value (US$ Million) Forecast by Application, 2018 to 2022

Table 6: Global Market Volume (Units) Forecast by Application, 2018 to 2022

Table 7: Global Market Value (US$ Million) Forecast by End Use, 2018 to 2022

Table 8: Global Market Volume (Units) Forecast by End Use, 2018 to 2022

Table 9: North America Market Value (US$ Million) Forecast by Country, 2018 to 2022

Table 10: North America Market Volume (Units) Forecast by Country, 2018 to 2022

Table 11: North America Market Value (US$ Million) Forecast by Material, 2018 to 2022

Table 12: North America Market Volume (Units) Forecast by Material, 2018 to 2022

Table 13: North America Market Value (US$ Million) Forecast by Application, 2018 to 2022

Table 14: North America Market Volume (Units) Forecast by Application, 2018 to 2022

Table 15: North America Market Value (US$ Million) Forecast by End Use, 2018 to 2022

Table 16: North America Market Volume (Units) Forecast by End Use, 2018 to 2022

Table 17: Latin America Market Value (US$ Million) Forecast by Country, 2018 to 2022

Table 18: Latin America Market Volume (Units) Forecast by Country, 2018 to 2022

Table 19: Latin America Market Value (US$ Million) Forecast by Material, 2018 to 2022

Table 20: Latin America Market Volume (Units) Forecast by Material, 2018 to 2022

Table 21: Latin America Market Value (US$ Million) Forecast by Application, 2018 to 2022

Table 22: Latin America Market Volume (Units) Forecast by Application, 2018 to 2022

Table 23: Latin America Market Value (US$ Million) Forecast by End Use, 2018 to 2022

Table 24: Latin America Market Volume (Units) Forecast by End Use, 2018 to 2022

Table 25: Western Europe Market Value (US$ Million) Forecast by Country, 2018 to 2022

Table 26: Western Europe Market Volume (Units) Forecast by Country, 2018 to 2022

Table 27: Western Europe Market Value (US$ Million) Forecast by Material, 2018 to 2022

Table 28: Western Europe Market Volume (Units) Forecast by Material, 2018 to 2022

Table 29: Western Europe Market Value (US$ Million) Forecast by Application, 2018 to 2022

Table 30: Western Europe Market Volume (Units) Forecast by Application, 2018 to 2022

Table 31: Western Europe Market Value (US$ Million) Forecast by End Use, 2018 to 2022

Table 32: Western Europe Market Volume (Units) Forecast by End Use, 2018 to 2022

Table 33: Eastern Europe Market Value (US$ Million) Forecast by Country, 2018 to 2022

Table 34: Eastern Europe Market Volume (Units) Forecast by Country, 2018 to 2022

Table 35: Eastern Europe Market Value (US$ Million) Forecast by Material, 2018 to 2022

Table 36: Eastern Europe Market Volume (Units) Forecast by Material, 2018 to 2022

Table 37: Eastern Europe Market Value (US$ Million) Forecast by Application, 2018 to 2022

Table 38: Eastern Europe Market Volume (Units) Forecast by Application, 2018 to 2022

Table 39: Eastern Europe Market Value (US$ Million) Forecast by End Use, 2018 to 2022

Table 40: Eastern Europe Market Volume (Units) Forecast by End Use, 2018 to 2022

Table 41: South Asia and Pacific Market Value (US$ Million) Forecast by Country, 2018 to 2022

Table 42: South Asia and Pacific Market Volume (Units) Forecast by Country, 2018 to 2022

Table 43: South Asia and Pacific Market Value (US$ Million) Forecast by Material, 2018 to 2022

Table 44: South Asia and Pacific Market Volume (Units) Forecast by Material, 2018 to 2022

Table 45: South Asia and Pacific Market Value (US$ Million) Forecast by Application, 2018 to 2022

Table 46: South Asia and Pacific Market Volume (Units) Forecast by Application, 2018 to 2022

Table 47: South Asia and Pacific Market Value (US$ Million) Forecast by End Use, 2018 to 2022

Table 48: South Asia and Pacific Market Volume (Units) Forecast by End Use, 2018 to 2022

Table 49: East Asia Market Value (US$ Million) Forecast by Country, 2018 to 2022

Table 50: East Asia Market Volume (Units) Forecast by Country, 2018 to 2022

Table 51: East Asia Market Value (US$ Million) Forecast by Material, 2018 to 2022

Table 52: East Asia Market Volume (Units) Forecast by Material, 2018 to 2022

Table 53: East Asia Market Value (US$ Million) Forecast by Application, 2018 to 2022

Table 54: East Asia Market Volume (Units) Forecast by Application, 2018 to 2022

Table 55: East Asia Market Value (US$ Million) Forecast by End Use, 2018 to 2022

Table 56: East Asia Market Volume (Units) Forecast by End Use, 2018 to 2022

Table 57: Middle East and Africa Market Value (US$ Million) Forecast by Country, 2018 to 2022

Table 58: Middle East and Africa Market Volume (Units) Forecast by Country, 2018 to 2022

Table 59: Middle East and Africa Market Value (US$ Million) Forecast by Material, 2018 to 2022

Table 60: Middle East and Africa Market Volume (Units) Forecast by Material, 2018 to 2022

Table 61: Middle East and Africa Market Value (US$ Million) Forecast by Application, 2018 to 2022

Table 62: Middle East and Africa Market Volume (Units) Forecast by Application, 2018 to 2022

Table 63: Middle East and Africa Market Value (US$ Million) Forecast by End Use, 2018 to 2022

Table 64: Middle East and Africa Market Volume (Units) Forecast by End Use, 2018 to 2022
Ismail Sutaria
Ismail Sutaria

Principal Consultant

Talk to Analyst

Find your sweet spots for generating winning opportunities in this market.

List of Charts

Figure 1: Global Market Value (US$ Million) by Material, 2023 to 2033

Figure 2: Global Market Value (US$ Million) by Application, 2023 to 2033

Figure 3: Global Market Value (US$ Million) by End Use, 2023 to 2033

Figure 4: Global Market Value (US$ Million) by Region, 2023 to 2033

Figure 5: Global Market Value (US$ Million) Analysis by Region, 2018 to 2022

Figure 6: Global Market Volume (Units) Analysis by Region, 2018 to 2022

Figure 7: Global Market Value Share (%) and BPS Analysis by Region, 2023 to 2033

Figure 8: Global Market Y-o-Y Growth (%) Projections by Region, 2023 to 2033

Figure 9: Global Market Value (US$ Million) Analysis by Material, 2018 to 2022

Figure 10: Global Market Volume (Units) Analysis by Material, 2018 to 2022

Figure 11: Global Market Value Share (%) and BPS Analysis by Material, 2023 to 2033

Figure 12: Global Market Y-o-Y Growth (%) Projections by Material, 2023 to 2033

Figure 13: Global Market Value (US$ Million) Analysis by Application, 2018 to 2022

Figure 14: Global Market Volume (Units) Analysis by Application, 2018 to 2022

Figure 15: Global Market Value Share (%) and BPS Analysis by Application, 2023 to 2033

Figure 16: Global Market Y-o-Y Growth (%) Projections by Application, 2023 to 2033

Figure 17: Global Market Value (US$ Million) Analysis by End Use, 2018 to 2022

Figure 18: Global Market Volume (Units) Analysis by End Use, 2018 to 2022

Figure 19: Global Market Value Share (%) and BPS Analysis by End Use, 2023 to 2033

Figure 20: Global Market Y-o-Y Growth (%) Projections by End Use, 2023 to 2033

Figure 21: Global Market Attractiveness by Material, 2023 to 2033

Figure 22: Global Market Attractiveness by Application, 2023 to 2033

Figure 23: Global Market Attractiveness by End Use, 2023 to 2033

Figure 24: Global Market Attractiveness by Region, 2023 to 2033

Figure 25: North America Market Value (US$ Million) by Material, 2023 to 2033

Figure 26: North America Market Value (US$ Million) by Application, 2023 to 2033

Figure 27: North America Market Value (US$ Million) by End Use, 2023 to 2033

Figure 28: North America Market Value (US$ Million) by Country, 2023 to 2033

Figure 29: North America Market Value (US$ Million) Analysis by Country, 2018 to 2022

Figure 30: North America Market Volume (Units) Analysis by Country, 2018 to 2022

Figure 31: North America Market Value Share (%) and BPS Analysis by Country, 2023 to 2033

Figure 32: North America Market Y-o-Y Growth (%) Projections by Country, 2023 to 2033

Figure 33: North America Market Value (US$ Million) Analysis by Material, 2018 to 2022

Figure 34: North America Market Volume (Units) Analysis by Material, 2018 to 2022

Figure 35: North America Market Value Share (%) and BPS Analysis by Material, 2023 to 2033

Figure 36: North America Market Y-o-Y Growth (%) Projections by Material, 2023 to 2033

Figure 37: North America Market Value (US$ Million) Analysis by Application, 2018 to 2022

Figure 38: North America Market Volume (Units) Analysis by Application, 2018 to 2022

Figure 39: North America Market Value Share (%) and BPS Analysis by Application, 2023 to 2033

Figure 40: North America Market Y-o-Y Growth (%) Projections by Application, 2023 to 2033

Figure 41: North America Market Value (US$ Million) Analysis by End Use, 2018 to 2022

Figure 42: North America Market Volume (Units) Analysis by End Use, 2018 to 2022

Figure 43: North America Market Value Share (%) and BPS Analysis by End Use, 2023 to 2033

Figure 44: North America Market Y-o-Y Growth (%) Projections by End Use, 2023 to 2033

Figure 45: North America Market Attractiveness by Material, 2023 to 2033

Figure 46: North America Market Attractiveness by Application, 2023 to 2033

Figure 47: North America Market Attractiveness by End Use, 2023 to 2033

Figure 48: North America Market Attractiveness by Country, 2023 to 2033

Figure 49: Latin America Market Value (US$ Million) by Material, 2023 to 2033

Figure 50: Latin America Market Value (US$ Million) by Application, 2023 to 2033

Figure 51: Latin America Market Value (US$ Million) by End Use, 2023 to 2033

Figure 52: Latin America Market Value (US$ Million) by Country, 2023 to 2033

Figure 53: Latin America Market Value (US$ Million) Analysis by Country, 2018 to 2022

Figure 54: Latin America Market Volume (Units) Analysis by Country, 2018 to 2022

Figure 55: Latin America Market Value Share (%) and BPS Analysis by Country, 2023 to 2033

Figure 56: Latin America Market Y-o-Y Growth (%) Projections by Country, 2023 to 2033

Figure 57: Latin America Market Value (US$ Million) Analysis by Material, 2018 to 2022

Figure 58: Latin America Market Volume (Units) Analysis by Material, 2018 to 2022

Figure 59: Latin America Market Value Share (%) and BPS Analysis by Material, 2023 to 2033

Figure 60: Latin America Market Y-o-Y Growth (%) Projections by Material, 2023 to 2033

Figure 61: Latin America Market Value (US$ Million) Analysis by Application, 2018 to 2022

Figure 62: Latin America Market Volume (Units) Analysis by Application, 2018 to 2022

Figure 63: Latin America Market Value Share (%) and BPS Analysis by Application, 2023 to 2033

Figure 64: Latin America Market Y-o-Y Growth (%) Projections by Application, 2023 to 2033

Figure 65: Latin America Market Value (US$ Million) Analysis by End Use, 2018 to 2022

Figure 66: Latin America Market Volume (Units) Analysis by End Use, 2018 to 2022

Figure 67: Latin America Market Value Share (%) and BPS Analysis by End Use, 2023 to 2033

Figure 68: Latin America Market Y-o-Y Growth (%) Projections by End Use, 2023 to 2033

Figure 69: Latin America Market Attractiveness by Material, 2023 to 2033

Figure 70: Latin America Market Attractiveness by Application, 2023 to 2033

Figure 71: Latin America Market Attractiveness by End Use, 2023 to 2033

Figure 72: Latin America Market Attractiveness by Country, 2023 to 2033

Figure 73: Western Europe Market Value (US$ Million) by Material, 2023 to 2033

Figure 74: Western Europe Market Value (US$ Million) by Application, 2023 to 2033

Figure 75: Western Europe Market Value (US$ Million) by End Use, 2023 to 2033

Figure 76: Western Europe Market Value (US$ Million) by Country, 2023 to 2033

Figure 77: Western Europe Market Value (US$ Million) Analysis by Country, 2018 to 2022

Figure 78: Western Europe Market Volume (Units) Analysis by Country, 2018 to 2022

Figure 79: Western Europe Market Value Share (%) and BPS Analysis by Country, 2023 to 2033

Figure 80: Western Europe Market Y-o-Y Growth (%) Projections by Country, 2023 to 2033

Figure 81: Western Europe Market Value (US$ Million) Analysis by Material, 2018 to 2022

Figure 82: Western Europe Market Volume (Units) Analysis by Material, 2018 to 2022

Figure 83: Western Europe Market Value Share (%) and BPS Analysis by Material, 2023 to 2033

Figure 84: Western Europe Market Y-o-Y Growth (%) Projections by Material, 2023 to 2033

Figure 85: Western Europe Market Value (US$ Million) Analysis by Application, 2018 to 2022

Figure 86: Western Europe Market Volume (Units) Analysis by Application, 2018 to 2022

Figure 87: Western Europe Market Value Share (%) and BPS Analysis by Application, 2023 to 2033

Figure 88: Western Europe Market Y-o-Y Growth (%) Projections by Application, 2023 to 2033

Figure 89: Western Europe Market Value (US$ Million) Analysis by End Use, 2018 to 2022

Figure 90: Western Europe Market Volume (Units) Analysis by End Use, 2018 to 2022

Figure 91: Western Europe Market Value Share (%) and BPS Analysis by End Use, 2023 to 2033

Figure 92: Western Europe Market Y-o-Y Growth (%) Projections by End Use, 2023 to 2033

Figure 93: Western Europe Market Attractiveness by Material, 2023 to 2033

Figure 94: Western Europe Market Attractiveness by Application, 2023 to 2033

Figure 95: Western Europe Market Attractiveness by End Use, 2023 to 2033

Figure 96: Western Europe Market Attractiveness by Country, 2023 to 2033

Figure 97: Eastern Europe Market Value (US$ Million) by Material, 2023 to 2033

Figure 98: Eastern Europe Market Value (US$ Million) by Application, 2023 to 2033

Figure 99: Eastern Europe Market Value (US$ Million) by End Use, 2023 to 2033

Figure 100: Eastern Europe Market Value (US$ Million) by Country, 2023 to 2033

Figure 101: Eastern Europe Market Value (US$ Million) Analysis by Country, 2018 to 2022

Figure 102: Eastern Europe Market Volume (Units) Analysis by Country, 2018 to 2022

Figure 103: Eastern Europe Market Value Share (%) and BPS Analysis by Country, 2023 to 2033

Figure 104: Eastern Europe Market Y-o-Y Growth (%) Projections by Country, 2023 to 2033

Figure 105: Eastern Europe Market Value (US$ Million) Analysis by Material, 2018 to 2022

Figure 106: Eastern Europe Market Volume (Units) Analysis by Material, 2018 to 2022

Figure 107: Eastern Europe Market Value Share (%) and BPS Analysis by Material, 2023 to 2033

Figure 108: Eastern Europe Market Y-o-Y Growth (%) Projections by Material, 2023 to 2033

Figure 109: Eastern Europe Market Value (US$ Million) Analysis by Application, 2018 to 2022

Figure 110: Eastern Europe Market Volume (Units) Analysis by Application, 2018 to 2022

Figure 111: Eastern Europe Market Value Share (%) and BPS Analysis by Application, 2023 to 2033

Figure 112: Eastern Europe Market Y-o-Y Growth (%) Projections by Application, 2023 to 2033

Figure 113: Eastern Europe Market Value (US$ Million) Analysis by End Use, 2018 to 2022

Figure 114: Eastern Europe Market Volume (Units) Analysis by End Use, 2018 to 2022

Figure 115: Eastern Europe Market Value Share (%) and BPS Analysis by End Use, 2023 to 2033

Figure 116: Eastern Europe Market Y-o-Y Growth (%) Projections by End Use, 2023 to 2033

Figure 117: Eastern Europe Market Attractiveness by Material, 2023 to 2033

Figure 118: Eastern Europe Market Attractiveness by Application, 2023 to 2033

Figure 119: Eastern Europe Market Attractiveness by End Use, 2023 to 2033

Figure 120: Eastern Europe Market Attractiveness by Country, 2023 to 2033

Figure 121: South Asia and Pacific Market Value (US$ Million) by Material, 2023 to 2033

Figure 122: South Asia and Pacific Market Value (US$ Million) by Application, 2023 to 2033

Figure 123: South Asia and Pacific Market Value (US$ Million) by End Use, 2023 to 2033

Figure 124: South Asia and Pacific Market Value (US$ Million) by Country, 2023 to 2033

Figure 125: South Asia and Pacific Market Value (US$ Million) Analysis by Country, 2018 to 2022

Figure 126: South Asia and Pacific Market Volume (Units) Analysis by Country, 2018 to 2022

Figure 127: South Asia and Pacific Market Value Share (%) and BPS Analysis by Country, 2023 to 2033

Figure 128: South Asia and Pacific Market Y-o-Y Growth (%) Projections by Country, 2023 to 2033

Figure 129: South Asia and Pacific Market Value (US$ Million) Analysis by Material, 2018 to 2022

Figure 130: South Asia and Pacific Market Volume (Units) Analysis by Material, 2018 to 2022

Figure 131: South Asia and Pacific Market Value Share (%) and BPS Analysis by Material, 2023 to 2033

Figure 132: South Asia and Pacific Market Y-o-Y Growth (%) Projections by Material, 2023 to 2033

Figure 133: South Asia and Pacific Market Value (US$ Million) Analysis by Application, 2018 to 2022

Figure 134: South Asia and Pacific Market Volume (Units) Analysis by Application, 2018 to 2022

Figure 135: South Asia and Pacific Market Value Share (%) and BPS Analysis by Application, 2023 to 2033

Figure 136: South Asia and Pacific Market Y-o-Y Growth (%) Projections by Application, 2023 to 2033

Figure 137: South Asia and Pacific Market Value (US$ Million) Analysis by End Use, 2018 to 2022

Figure 138: South Asia and Pacific Market Volume (Units) Analysis by End Use, 2018 to 2022

Figure 139: South Asia and Pacific Market Value Share (%) and BPS Analysis by End Use, 2023 to 2033

Figure 140: South Asia and Pacific Market Y-o-Y Growth (%) Projections by End Use, 2023 to 2033

Figure 141: South Asia and Pacific Market Attractiveness by Material, 2023 to 2033

Figure 142: South Asia and Pacific Market Attractiveness by Application, 2023 to 2033

Figure 143: South Asia and Pacific Market Attractiveness by End Use, 2023 to 2033

Figure 144: South Asia and Pacific Market Attractiveness by Country, 2023 to 2033

Figure 145: East Asia Market Value (US$ Million) by Material, 2023 to 2033

Figure 146: East Asia Market Value (US$ Million) by Application, 2023 to 2033

Figure 147: East Asia Market Value (US$ Million) by End Use, 2023 to 2033

Figure 148: East Asia Market Value (US$ Million) by Country, 2023 to 2033

Figure 149: East Asia Market Value (US$ Million) Analysis by Country, 2018 to 2022

Figure 150: East Asia Market Volume (Units) Analysis by Country, 2018 to 2022

Figure 151: East Asia Market Value Share (%) and BPS Analysis by Country, 2023 to 2033

Figure 152: East Asia Market Y-o-Y Growth (%) Projections by Country, 2023 to 2033

Figure 153: East Asia Market Value (US$ Million) Analysis by Material, 2018 to 2022

Figure 154: East Asia Market Volume (Units) Analysis by Material, 2018 to 2022

Figure 155: East Asia Market Value Share (%) and BPS Analysis by Material, 2023 to 2033

Figure 156: East Asia Market Y-o-Y Growth (%) Projections by Material, 2023 to 2033

Figure 157: East Asia Market Value (US$ Million) Analysis by Application, 2018 to 2022

Figure 158: East Asia Market Volume (Units) Analysis by Application, 2018 to 2022

Figure 159: East Asia Market Value Share (%) and BPS Analysis by Application, 2023 to 2033

Figure 160: East Asia Market Y-o-Y Growth (%) Projections by Application, 2023 to 2033

Figure 161: East Asia Market Value (US$ Million) Analysis by End Use, 2018 to 2022

Figure 162: East Asia Market Volume (Units) Analysis by End Use, 2018 to 2022

Figure 163: East Asia Market Value Share (%) and BPS Analysis by End Use, 2023 to 2033

Figure 164: East Asia Market Y-o-Y Growth (%) Projections by End Use, 2023 to 2033

Figure 165: East Asia Market Attractiveness by Material, 2023 to 2033

Figure 166: East Asia Market Attractiveness by Application, 2023 to 2033

Figure 167: East Asia Market Attractiveness by End Use, 2023 to 2033

Figure 168: East Asia Market Attractiveness by Country, 2023 to 2033

Figure 169: Middle East and Africa Market Value (US$ Million) by Material, 2023 to 2033

Figure 170: Middle East and Africa Market Value (US$ Million) by Application, 2023 to 2033

Figure 171: Middle East and Africa Market Value (US$ Million) by End Use, 2023 to 2033

Figure 172: Middle East and Africa Market Value (US$ Million) by Country, 2023 to 2033

Figure 173: Middle East and Africa Market Value (US$ Million) Analysis by Country, 2018 to 2022

Figure 174: Middle East and Africa Market Volume (Units) Analysis by Country, 2018 to 2022

Figure 175: Middle East and Africa Market Value Share (%) and BPS Analysis by Country, 2023 to 2033

Figure 176: Middle East and Africa Market Y-o-Y Growth (%) Projections by Country, 2023 to 2033

Figure 177: Middle East and Africa Market Value (US$ Million) Analysis by Material, 2018 to 2022

Figure 178: Middle East and Africa Market Volume (Units) Analysis by Material, 2018 to 2022

Figure 179: Middle East and Africa Market Value Share (%) and BPS Analysis by Material, 2023 to 2033

Figure 180: Middle East and Africa Market Y-o-Y Growth (%) Projections by Material, 2023 to 2033

Figure 181: Middle East and Africa Market Value (US$ Million) Analysis by Application, 2018 to 2022

Figure 182: Middle East and Africa Market Volume (Units) Analysis by Application, 2018 to 2022

Figure 183: Middle East and Africa Market Value Share (%) and BPS Analysis by Application, 2023 to 2033

Figure 184: Middle East and Africa Market Y-o-Y Growth (%) Projections by Application, 2023 to 2033

Figure 185: Middle East and Africa Market Value (US$ Million) Analysis by End Use, 2018 to 2022

Figure 186: Middle East and Africa Market Volume (Units) Analysis by End Use, 2018 to 2022

Figure 187: Middle East and Africa Market Value Share (%) and BPS Analysis by End Use, 2023 to 2033

Figure 188: Middle East and Africa Market Y-o-Y Growth (%) Projections by End Use, 2023 to 2033

Figure 189: Middle East and Africa Market Attractiveness by Material, 2023 to 2033

Figure 190: Middle East and Africa Market Attractiveness by Application, 2023 to 2033

Figure 191: Middle East and Africa Market Attractiveness by End Use, 2023 to 2033

Figure 192: Middle East and Africa Market Attractiveness by Country, 2023 to 2033

Recommendations

Packaging

Hinged Food Containers Market

Published : March 2023

Packaging

Rigid Food Containers Market

Published : September 2022

Packaging

Insulated Food Containers Market

Published : July 2021

Explore Packaging Insights

View Reports

Disposable Food Containers Market