Apparel Re-commerce Market Size and Share Forecast Outlook 2025 to 2035

The Apparel Re-commerce Market is estimated to be valued at USD 139.5 billion in 2025 and is projected to reach USD 1258.3 billion by 2035, registering a compound annual growth rate (CAGR) of 24.6% over the forecast period.
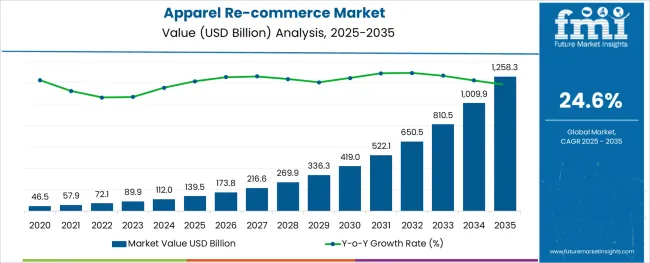
Quick Stats for Apparel Re-commerce Market

  • Apparel Re-commerce Market Industry Value (2025): USD 139.5 billion
  • Apparel Re-commerce Market Forecast Value (2035): USD 1258.3 billion
  • Apparel Re-commerce Market Forecast CAGR: 24.6%
  • Leading Segment in Apparel Re-commerce Market in 2025: Tier-1 Companies (63.0%)
  • Key Growth Region in Apparel Re-commerce Market: North America, Asia-Pacific, Europe
  • Top Key Players in Apparel Re-commerce Market: Vestiaire Collective, The RealReal, Tradesy, Poshmark, ThredUP, Vinted, SnobSwap, Threadfli

Apparel Re Commerce Market

Rationale for Segmental Growth in the Stainless Steel Valve Tag Market

Market Overview

The stainless steel valve tag market is expanding steadily as industrial sectors prioritize asset management, safety compliance, and equipment traceability. Increasing investments in infrastructure and process automation have heightened demand for robust and clear identification solutions capable of withstanding harsh environments.

The shift toward digital transformation in industries such as oil and gas, manufacturing, and utilities is encouraging the adoption of advanced tagging systems that support maintenance and audit operations. Growing awareness around regulatory compliance for equipment labeling and enhanced safety protocols is also influencing market expansion.

The rise of e-commerce platforms has facilitated easier procurement of valve tags, increasing accessibility for small to medium enterprises and broadening geographic reach. Material innovations and customization options continue to enhance product longevity and visibility, creating opportunities for market penetration across diverse industrial applications.

Segmental Analysis

The market is segmented by Company Tier, Product Type, and End User and region. By Company Tier, the market is divided into Tier-1 Companies, Tier-2 Companies, and Tier-3 Companies. In terms of Product Type, the market is classified into Clothing and garments, Footwear, Accessories, Handbags, and Others. Based on End User, the market is segmented into Adult and Kids. Regionally, the market is classified into North America, Latin America, Western Europe, Eastern Europe, Balkan & Baltic Countries, Russia & Belarus, Central Asia, East Asia, South Asia & Pacific, and the Middle East & Africa.
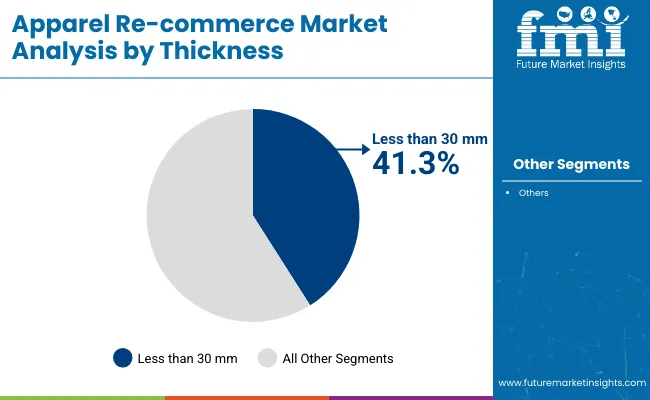
Insights into the Less than 30 mm Thickness Segment

Apparel Re Commerce Market By Thickness

The less than 30 mm thickness segment is expected to hold 41.3% of the revenue share in 2025 within the thickness category. This segment’s leadership is supported by its suitability for a wide range of valve sizes and equipment types, providing sufficient durability while minimizing material costs.

The thinner tags offer flexibility in installation, especially in tight spaces and complex piping systems, making them preferable for industries where compactness is critical. Their compatibility with standard mounting hardware and ability to endure corrosion and wear have reinforced demand in sectors emphasizing both performance and cost efficiency.

This balance between robustness and adaptability has contributed to the segment’s dominant position.
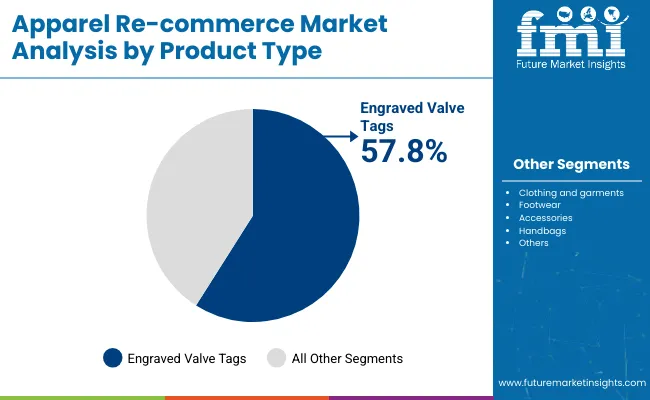
Insights into the Engraved Product Type Segment

Apparel Re Commerce Market By Product Type

Within the product type category, engraved valve tags are projected to command 57.8% of the market revenue share in 2025, marking them as the leading product form. The prominence of engraved tags is due to their superior legibility, permanence, and resistance to environmental degradation such as fading, scratching, and chemical exposure.

Engraving allows precise and customizable marking, meeting stringent industry standards for traceability and safety. The technique supports complex information including serial numbers, barcodes, and QR codes, enhancing integration with digital asset management systems.

Manufacturers’ emphasis on delivering long-lasting, tamper-proof tags that reduce maintenance costs has reinforced the adoption of engraved tags in heavy industries.
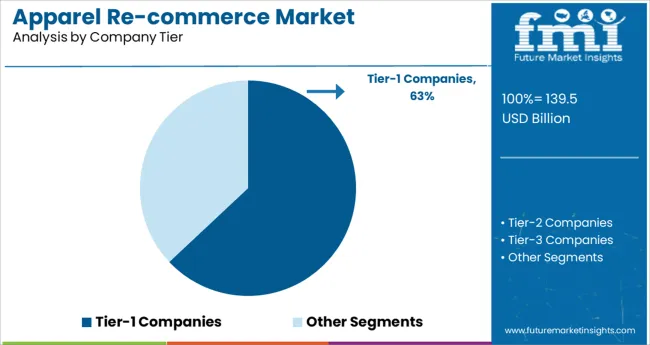
Insights into the Online Distribution Channel Segment

Apparel Re Commerce Market Analysis By Company Tier

The online distribution channel is expected to generate 63.7% of market revenue in 2025, making it the most dominant sales route. The growth of e-commerce platforms has revolutionized procurement by offering convenience, broader product selections, and competitive pricing to end-users across industries.

Online channels enable buyers to access detailed product specifications, customization options, and customer reviews, simplifying purchase decisions. This has particularly benefited small and medium-sized enterprises lacking traditional supply chain networks.

Additionally, digital platforms have streamlined order fulfillment and reduced lead times, fostering faster adoption. Vendors are increasingly investing in online marketplaces and direct-to-customer websites to expand reach and improve customer engagement, reinforcing the online channel’s leadership in the stainless steel valve tag market.

Availability of number of products in affordable prices, changing fashion trends and entry of multiple manufacturers are some factors boosting the market growth

The apparel re-commerce markets are giving customers an opportunity to own their desired clothes and fashion accessories at affordable prices and without leaving the house. There are multiple facilities provided to the customers, including showcasing the products on sale. The online website has images and product information, which helps educate the customer about the product.

Using these as a reference, customers can choose the size, color, and other choices for their desired products. There is also a peer-to-peer marketplace, where customers can compare the prices of the same or similar products on sale over different marketplaces or websites.

Along with ease in shopping, customers can also connect to the seller directly, if they have any queries or issues related to the product. The apparel re-commerce business is growing as a result of how simple online buying is.

Many companies and manufacturers have entered and invested in the re-commerce sector as a result of the market's overwhelmingly positive response, offering a number of apparel combos, luxury goods, and reselling clothing.

Supply and demand for season-specific apparel and accessories, the increasing popularity of branded apparel, and the increasing penetration of customers, especially millennials are helping the apparel re-commerce market grow.

Lack of brand loyalty, counterfeit products and exploitation of return policies are the main restraints to apparel re-commerce market

There are some major problems faced by the apparel re-commerce market, that are limiting the market growth in many regions. The first commonly faced problem is the lack of brand loyalty.

Many brands are providing quality products to customers, making sure that they do not go anywhere else. As there are multiple products available all over the market, customers do not prefer any single brand or product. Such competition and a vast number of products then lead to the weakening of brand trust and loyalty.

Some of these products are provided by counterfeit manufacturers. These products are relatively cheaper, but they also lack quality. This is another reason for weakening the trust between a brand and its customers.

High return rates of the sold products are another problem faced by the re-commerce market. when the customer is not satisfied with the product or receives the wrong product, they can return that product to the seller. There are different policies on returning the products, differing from seller to seller.

Due to freedom for returns in specified days, users are exploiting these policies and returning products after using them for a few days. Due to such problems, sellers are applying no-return policies on their products, increasing complications for customers. These problems are restraining the apparel re-commerce market.
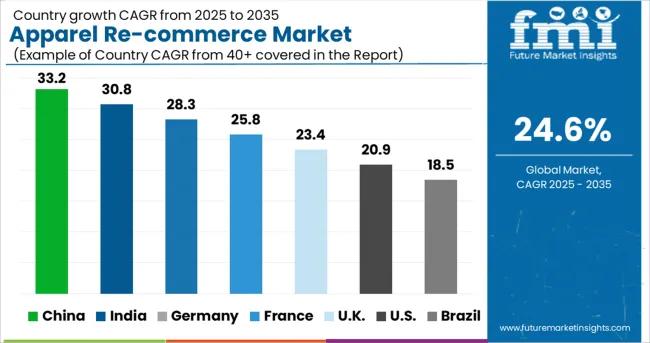
Country Insights

Apparel Re Commerce Market Cagr Analysis By Country

American youth is supporting re-commerce market; as new fashion trends are taking over.

Millennials and Generation Z in the USA are interested in second-hand apparel products. There are multiple fashion trends in the USA and updating one wardrobe from time to time is necessary. At such a time, resale marketplaces are the go-to place for American youth.

Not just apparel and fashion products, there are several luxury products available for resale on these marketplaces. Due to changing lifestyles and increasing environmental awareness, Americans are embracing the apparel re-commerce market.

Chinese customers are not fans of second-hand products, social status, and superstitions are the reasons.

China is the biggest manufacturer and consumer of apparel and accessories products. There is a number of brands and counterfeit manufacturers, providing different products to customers. Even though, purchasing second-hand clothing at a low price and using them is not attracting Chinese customers.

Chinese customers are ignoring the resale markets, due to their social image and superstitions related to second-hand clothing. Also, fake and counterfeit products are the biggest concern for them. Again, viral infections and health concerns are other reasons that apparel re-commerce is not popular in China.
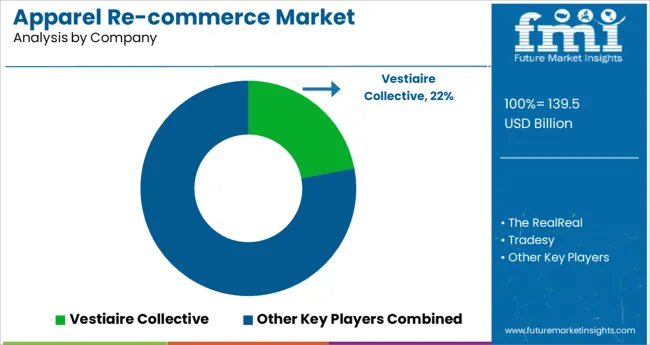
Competitive Landscape

Apparel Re Commerce Market Analysis By Company

Some key players in the Apparel Re-Commerce market are Vestiaire Collective, The RealReal, Tradesy, Poshmark, ThredUP, Vinted, SnobSwap, Threadflip, and others. These are popular and well-known brands all over the world.

  • Vestiaire Collective, a popular second-hand apparel market is relaunching its brand identity in March 2025, with the motto ‘Long Live Fashion!’. They also introduced five icon puppets, promoting the use of pre-loved clothing and also showcasing the diversity of the community, loving their services. Another reason is to spread awareness about the environmental effects of throwing away clothes and the sustainable future of the fashion market.
  • Realreal, an authentic online marketplace for luxury goods has introduced a sustainability calculator. This calculator shows the impact of the resale of products like handbags, jewelry, and many others. The calculator calculates the carbon emission and water footprint reduction due to the resale of any specific product, indicating the positive environmental effects of second-hand products.

Scope of Report

Attribute Details
Growth Rate CAGR of ~24.6% from 2025 to 2035
The base year for estimation 2024
Historical Data Available for 2020 to 2024
Forecast Period 2025 to 2035
Quantitative units Revenue in billion, volume in Units, and CAGR from 2025 to 2035
Report Coverage Revenue forecast, volume forecast, company ranking, competitive landscape, growth factors, and trends, pricing analysis
Segments Covered Companies, Product Type, End Users, Region
Country scope United States of America, Canada, Mexico, Germany, United Kingdom, France, Italy, Spain, Russia, India, Thailand, China, India, Japan, Australia, Brazil, Argentina, Colombia, Saudi Arabia, UAE, South Africa
Key Companies Profiled Vestiaire Collective; The RealReal; Tradesy; Poshmark; ThredUP; Vinted; SnobSwap; Threadflip; Others
Customization scope Free report customization (equivalent to up to 8 analysts' working days) with purchase. Addition or alteration to country, regional & segment scope.
Pricing and purchase options Avail customized purchase options to meet your exact research needs.

Key Segments Profiled in the Apparel Re-Commerce Market

By Companies:

  • Tier-1 Companies
  • Tier-2 Companies
  • Tier-3 Companies

By Product Type:

  • Clothing and garments
  • Footwear
  • Accessories
  • Handbags
  • Others

By End User:

  • Adult
  • Kids

By Region:

  • North America
  • Latin America
  • Europe
  • East Asia
  • South Asia
  • Oceania
  • Middle East and Africa

Table of Content

  1. Executive Summary
    • Global Market Outlook
    • Demand-side Trends
    • Supply-side Trends
    • Technology Roadmap Analysis
    • Analysis and Recommendations
  2. Market Overview
    • Market Coverage / Taxonomy
    • Market Definition / Scope / Limitations
  3. Market Background
    • Market Dynamics
      • Drivers
      • Restraints
      • Opportunity
      • Trends
    • Scenario Forecast
      • Demand in Optimistic Scenario
      • Demand in Likely Scenario
      • Demand in Conservative Scenario
    • Opportunity Map Analysis
    • Product Life Cycle Analysis
    • Supply Chain Analysis
    • Investment Feasibility Matrix
    • Value Chain Analysis
    • PESTLE and Porter’s Analysis
    • Regulatory Landscape
    • Regional Parent Market Outlook
    • Production and Consumption Statistics
    • Import and Export Statistics
  4. Global Market Analysis 2020-2024 and Forecast, 2025-2035
    • Historical Market Size Value (USD Million) Analysis, 2020-2024
    • Current and Future Market Size Value (USD Million) Projections, 2025-2035
      • Y-o-Y Growth Trend Analysis
      • Absolute $ Opportunity Analysis
  5. Global Market Pricing Analysis 2020-2024 and Forecast 2025-2035
  6. Global Market Analysis 2020-2024 and Forecast 2025-2035, By Company Tier
    • Introduction / Key Findings
    • Historical Market Size Value (USD Million) Analysis By Company Tier , 2020-2024
    • Current and Future Market Size Value (USD Million) Analysis and Forecast By Company Tier , 2025-2035
      • Tier-1 Companies
      • Tier-2 Companies
      • Tier-3 Companies
    • Y-o-Y Growth Trend Analysis By Company Tier , 2020-2024
    • Absolute $ Opportunity Analysis By Company Tier , 2025-2035
  7. Global Market Analysis 2020-2024 and Forecast 2025-2035, By Product Type
    • Introduction / Key Findings
    • Historical Market Size Value (USD Million) Analysis By Product Type, 2020-2024
    • Current and Future Market Size Value (USD Million) Analysis and Forecast By Product Type, 2025-2035
      • Clothing and garments
      • Footwear
      • Accessories
      • Handbags
      • Others
    • Y-o-Y Growth Trend Analysis By Product Type, 2020-2024
    • Absolute $ Opportunity Analysis By Product Type, 2025-2035
  8. Global Market Analysis 2020-2024 and Forecast 2025-2035, By End User
    • Introduction / Key Findings
    • Historical Market Size Value (USD Million) Analysis By End User, 2020-2024
    • Current and Future Market Size Value (USD Million) Analysis and Forecast By End User, 2025-2035
      • Adult
      • Kids
    • Y-o-Y Growth Trend Analysis By End User, 2020-2024
    • Absolute $ Opportunity Analysis By End User, 2025-2035
  9. Global Market Analysis 2020-2024 and Forecast 2025-2035, By Region
    • Introduction
    • Historical Market Size Value (USD Million) Analysis By Region, 2020-2024
    • Current Market Size Value (USD Million) Analysis and Forecast By Region, 2025-2035
      • North America
      • Latin America
      • Western Europe
      • Eastern Europe
      • East Asia
      • South Asia and Pacific
      • Middle East & Africa
    • Market Attractiveness Analysis By Region
  10. North America Market Analysis 2020-2024 and Forecast 2025-2035, By Country
    • Historical Market Size Value (USD Million) Trend Analysis By Market Taxonomy, 2020-2024
    • Market Size Value (USD Million) Forecast By Market Taxonomy, 2025-2035
      • By Country
        • U.S.
        • Canada
        • Mexico
      • By Company Tier
      • By Product Type
      • By End User
    • Market Attractiveness Analysis
      • By Country
      • By Company Tier
      • By Product Type
      • By End User
    • Key Takeaways
  11. Latin America Market Analysis 2020-2024 and Forecast 2025-2035, By Country
    • Historical Market Size Value (USD Million) Trend Analysis By Market Taxonomy, 2020-2024
    • Market Size Value (USD Million) Forecast By Market Taxonomy, 2025-2035
      • By Country
        • Brazil
        • Chile
        • Rest of Latin America
      • By Company Tier
      • By Product Type
      • By End User
    • Market Attractiveness Analysis
      • By Country
      • By Company Tier
      • By Product Type
      • By End User
    • Key Takeaways
  12. Western Europe Market Analysis 2020-2024 and Forecast 2025-2035, By Country
    • Historical Market Size Value (USD Million) Trend Analysis By Market Taxonomy, 2020-2024
    • Market Size Value (USD Million) Forecast By Market Taxonomy, 2025-2035
      • By Country
        • Germany
        • U.K.
        • Italy
        • Spain
        • France
        • Nordic
        • BENELUX
        • Rest of Western Europe
      • By Company Tier
      • By Product Type
      • By End User
    • Market Attractiveness Analysis
      • By Country
      • By Company Tier
      • By Product Type
      • By End User
    • Key Takeaways
  13. Eastern Europe Market Analysis 2020-2024 and Forecast 2025-2035, By Country
    • Historical Market Size Value (USD Million) Trend Analysis By Market Taxonomy, 2020-2024
    • Market Size Value (USD Million) Forecast By Market Taxonomy, 2025-2035
      • By Country
        • Russia
        • Poland
        • Hungary
        • Balkan & Baltic
        • Rest of Eastern Europe
      • By Company Tier
      • By Product Type
      • By End User
    • Market Attractiveness Analysis
      • By Country
      • By Company Tier
      • By Product Type
      • By End User
    • Key Takeaways
  14. East Asia Market Analysis 2020-2024 and Forecast 2025-2035, By Country
    • Historical Market Size Value (USD Million) Trend Analysis By Market Taxonomy, 2020-2024
    • Market Size Value (USD Million) Forecast By Market Taxonomy, 2025-2035
      • By Country
        • China
        • Japan
        • South Korea
      • By Company Tier
      • By Product Type
      • By End User
    • Market Attractiveness Analysis
      • By Country
      • By Company Tier
      • By Product Type
      • By End User
    • Key Takeaways
  15. South Asia and Pacific Market Analysis 2020-2024 and Forecast 2025-2035, By Country
    • Historical Market Size Value (USD Million) Trend Analysis By Market Taxonomy, 2020-2024
    • Market Size Value (USD Million) Forecast By Market Taxonomy, 2025-2035
      • By Country
        • India
        • ASEAN
        • Australia & New Zealand
        • Rest of South Asia and Pacific
      • By Company Tier
      • By Product Type
      • By End User
    • Market Attractiveness Analysis
      • By Country
      • By Company Tier
      • By Product Type
      • By End User
    • Key Takeaways
  16. Middle East & Africa Market Analysis 2020-2024 and Forecast 2025-2035, By Country
    • Historical Market Size Value (USD Million) Trend Analysis By Market Taxonomy, 2020-2024
    • Market Size Value (USD Million) Forecast By Market Taxonomy, 2025-2035
      • By Country
        • Kingdom of Saudi Arabia
        • Other GCC Countries
        • Turkiye
        • South Africa
        • Other African Union
        • Rest of Middle East & Africa
      • By Company Tier
      • By Product Type
      • By End User
    • Market Attractiveness Analysis
      • By Country
      • By Company Tier
      • By Product Type
      • By End User
    • Key Takeaways
  17. Key Countries Market Analysis
    • U.S.
      • Pricing Analysis
      • Market Share Analysis, 2024
        • By Company Tier
        • By Product Type
        • By End User
    • Canada
      • Pricing Analysis
      • Market Share Analysis, 2024
        • By Company Tier
        • By Product Type
        • By End User
    • Mexico
      • Pricing Analysis
      • Market Share Analysis, 2024
        • By Company Tier
        • By Product Type
        • By End User
    • Brazil
      • Pricing Analysis
      • Market Share Analysis, 2024
        • By Company Tier
        • By Product Type
        • By End User
    • Chile
      • Pricing Analysis
      • Market Share Analysis, 2024
        • By Company Tier
        • By Product Type
        • By End User
    • Germany
      • Pricing Analysis
      • Market Share Analysis, 2024
        • By Company Tier
        • By Product Type
        • By End User
    • U.K.
      • Pricing Analysis
      • Market Share Analysis, 2024
        • By Company Tier
        • By Product Type
        • By End User
    • Italy
      • Pricing Analysis
      • Market Share Analysis, 2024
        • By Company Tier
        • By Product Type
        • By End User
    • Spain
      • Pricing Analysis
      • Market Share Analysis, 2024
        • By Company Tier
        • By Product Type
        • By End User
    • France
      • Pricing Analysis
      • Market Share Analysis, 2024
        • By Company Tier
        • By Product Type
        • By End User
    • India
      • Pricing Analysis
      • Market Share Analysis, 2024
        • By Company Tier
        • By Product Type
        • By End User
    • ASEAN
      • Pricing Analysis
      • Market Share Analysis, 2024
        • By Company Tier
        • By Product Type
        • By End User
    • Australia & New Zealand
      • Pricing Analysis
      • Market Share Analysis, 2024
        • By Company Tier
        • By Product Type
        • By End User
    • China
      • Pricing Analysis
      • Market Share Analysis, 2024
        • By Company Tier
        • By Product Type
        • By End User
    • Japan
      • Pricing Analysis
      • Market Share Analysis, 2024
        • By Company Tier
        • By Product Type
        • By End User
    • South Korea
      • Pricing Analysis
      • Market Share Analysis, 2024
        • By Company Tier
        • By Product Type
        • By End User
    • Russia
      • Pricing Analysis
      • Market Share Analysis, 2024
        • By Company Tier
        • By Product Type
        • By End User
    • Poland
      • Pricing Analysis
      • Market Share Analysis, 2024
        • By Company Tier
        • By Product Type
        • By End User
    • Hungary
      • Pricing Analysis
      • Market Share Analysis, 2024
        • By Company Tier
        • By Product Type
        • By End User
    • Kingdom of Saudi Arabia
      • Pricing Analysis
      • Market Share Analysis, 2024
        • By Company Tier
        • By Product Type
        • By End User
    • Turkiye
      • Pricing Analysis
      • Market Share Analysis, 2024
        • By Company Tier
        • By Product Type
        • By End User
    • South Africa
      • Pricing Analysis
      • Market Share Analysis, 2024
        • By Company Tier
        • By Product Type
        • By End User
  18. Market Structure Analysis
    • Competition Dashboard
    • Competition Benchmarking
    • Market Share Analysis of Top Players
      • By Regional
      • By Company Tier
      • By Product Type
      • By End User
  19. Competition Analysis
    • Competition Deep Dive
      • Vestiaire Collective
        • Overview
        • Product Portfolio
        • Profitability by Market Segments (Product/Age /Sales Channel/Region)
        • Sales Footprint
        • Strategy Overview
          • Marketing Strategy
          • Product Strategy
          • Channel Strategy
      • The RealReal
      • Tradesy
      • Poshmark
      • ThredUP
      • Vinted
      • SnobSwap
      • Threadflip
  20. Assumptions & Acronyms Used
  21. Research Methodology

List of Tables

  • Table 1: Global Market Value (USD Million) Forecast by Region, 2020-2035
  • Table 2: North America Market Value (USD Million) Forecast by Country, 2020-2035
  • Table 3: Latin America Market Value (USD Million) Forecast by Country, 2020-2035
  • Table 4: Western Europe Market Value (USD Million) Forecast by Country, 2020-2035
  • Table 5: Eastern Europe Market Value (USD Million) Forecast by Country, 2020-2035
  • Table 6: East Asia Market Value (USD Million) Forecast by Country, 2020-2035
  • Table 7: South Asia and Pacific Market Value (USD Million) Forecast by Country, 2020-2035
  • Table 8: Middle East & Africa Market Value (USD Million) Forecast by Country, 2020-2035

List of Figures

  • Figure 1: Global Market Pricing Analysis
  • Figure 2: Global Market Value (USD Million) Forecast 2020-2035
  • Figure 3: Global Market Value (USD Million) Share and BPS Analysis by Region, 2025 and 2035
  • Figure 4: Global Market Y-o-Y Growth Comparison by Region, 2025-2035
  • Figure 5: Global Market Attractiveness Analysis by Region
  • Figure 6: North America Market Incremental $ Opportunity, 2025-2035
  • Figure 7: Latin America Market Incremental $ Opportunity, 2025-2035
  • Figure 8: Western Europe Market Incremental $ Opportunity, 2025-2035
  • Figure 9: Eastern Europe Market Incremental $ Opportunity, 2025-2035
  • Figure 10: East Asia Market Incremental $ Opportunity, 2025-2035
  • Figure 11: South Asia and Pacific Market Incremental $ Opportunity, 2025-2035
  • Figure 12: Middle East & Africa Market Incremental $ Opportunity, 2025-2035
  • Figure 13: North America Market Value Share and BPS Analysis by Country, 2025 and 2035
  • Figure 14: Latin America Market Value Share and BPS Analysis by Country, 2025 and 2035
  • Figure 15: Western Europe Market Value Share and BPS Analysis by Country, 2025 and 2035
  • Figure 16: Eastern Europe Market Value Share and BPS Analysis by Country, 2025 and 2035
  • Figure 17: East Asia Market Value Share and BPS Analysis by Country, 2025 and 2035
  • Figure 18: South Asia and Pacific Market Value Share and BPS Analysis by Country, 2025 and 2035
  • Figure 19: Middle East & Africa Market Value Share and BPS Analysis by Country, 2025 and 2035
  • Figure 20: Global Market - Tier Structure Analysis
  • Figure 21: Global Market - Company Share Analysis

Frequently Asked Questions

How big is the apparel re-commerce market in 2025?

The global apparel re-commerce market is estimated to be valued at USD 139.5 billion in 2025.

What will be the market size for the apparel re-commerce market in 2035?

It is projected to reach USD 1,258.3 billion by 2035.

How much will be the CAGR of the apparel re-commerce market between 2025 and 2035?

The market is expected to grow at a 24.6% CAGR between 2025 and 2035.

What are the key product types in the apparel re-commerce market?

The key product types are tier-1 companies, tier-2 companies and tier-3 companies.

Which clothing and garments segment is expected to dominate the apparel re-commerce market in 2025?

clothing and garments segment is expected to dominate with a 48.0% industry share in 2025.

Explore Similar Insights

Future Market Insights

Apparel Re-commerce Market