Reports

- Global Locations -

Headquarters

Future Market Insights, Inc.

Christiana Corporate, 200
Continental Drive, Suite 401,
Newark, Delaware - 19713,
United States

T: +1-845-579-5705

Americas

Future Market Insights, Inc.

616 Corporate Way, Suite 2-9018,
Valley Cottage, NY 10989, United States

T: +1-347-918-3531

MEA

Future Market Insights

1602-6 Jumeirah Bay X2 Tower, Plot No: JLT-PH2-X2A,
Jumeirah Lakes Towers, Dubai,
United Arab Emirates

Europe

Future Market Insights

3rd Floor, 207 Regent Street,
W1B 3HH London
United Kingdom

T: + 44 (0) 20 8123 9659
D: +44 (0) 20 3287 4268

Asia Pacific

Future Market Insights

IndiaLand Global Tech Park, Unit UG-1, Behind Grand HighStreet, Phase 1, Hinjawadi, MH, Pune – 411057, India

Crossfit Apparel Market Outlook (2022 to 2032)

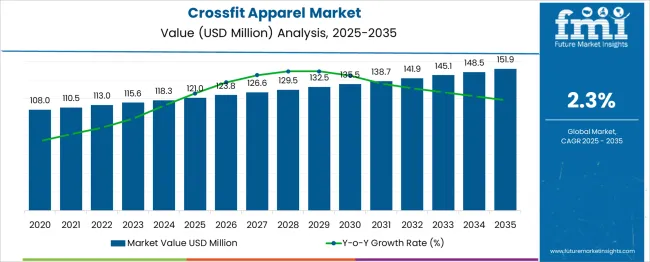
[306 Pages Report] The crossfit apparel market is poised to attain a CAGR of 2.3% during the forecast period (2022 to 2032).

The crossfit apparel market is likely to garner a revenue of US$ 113 million in 2022 and is projected to reach US$ 149 million by 2032.

Fitness influencers' aggressive efforts to promote activewear and attract consumers have resulted in the athleisure cult, which, in turn, augments the sales of CrossFit apparel to a significant extent.

Crossfit apparel market growth is likely to be fostered by the increasing number of sports tournaments around the globe.

The market's growing emphasis on product performance and comfort is also contributing to the emerging trends in the crossfit apparel market.

Attributes Details
CrossFit Apparel Market CAGR (2022 to 2032) 2.3%
CrossFit Apparel Market Value (2022) US$ 113 Million
CrossFit Apparel Market Value (2032) US$ 149 Million

Don't pay for what you don't need

Customize your report by selecting specific countries or regions and save 30%!

What Consequences has the COVD-19 Entailed in the Crossfit Apparel Market?

Notwithstanding the fact that the COVID-19 pandemic continues to have an impact on businesses around the world, the crossfit apparel market has managed to return to pre-COVID-19 levels of growth despite difficult economic conditions.

Executives in the crossfit apparel market focused on three key trends in 2020: consumer shifts, the digital leap, and industry disruptions.

These crossfit apparel market trends continued, accelerated in some cases, or took interesting new turns in 2021.

With many people still working from home, athleisure has grown in popularity, reflecting changing attitudes toward traditional workwear, thereby soaring the sales of crossfit apparel.

Demand for crossfit apparel is on the surge as many people have a new perspective on sports and general fitness as a result of increased health awareness.

E-commerce has thrived as consumers continue to shop online despite the relaxation of lockdown measures, in turn, enlarging the crossfit apparel market size to a considerable extent.

Individual or community-based digital forms of exercise and physical activity have grown in popularity, opening up new crossfit apparel market opportunities for major players.

Meanwhile, with the COP26 Climate Change Conference emphasizing the need for companies to increase their efforts to decarbonize as they seek to differentiate their offerings, sustainability is more important than ever.

With a few exceptions, sporting-goods companies saw a significant drop in sales and narrower margins at the start of the pandemic and these changes narrowed down the CrossFit apparel market trends and forecast.

In 2020, a few specialized players were able to pull ahead, with margins and sales of crossfit apparel growth exceeding 15%.

Nonetheless, most crossfit apparel companies maintained above-average economic profits and experienced a broad recovery in 2021.

Globally, the crossfit apparel market almost entirely recovered to pre-COVID-19 levels in 2021, driven by consumers in China and the USA.

As more people commit to living healthier, more active lives, crossfit apparel brands are expected to have an opportunity to expand into new markets.

What Factors are Holding a Sway over the Crossfit Apparel Market?

The increasing number of sports tournaments is significantly driving the crossfit apparel market growth, though factors such as volatile raw material prices may impede the market.

The rise in sales of crossfit apparel is also due to the growing interest in sports activities among the world's population.

For example, as the number of registered baseball players has increased, so has the number of baseball and softball tournaments and matches.

The American Athletic Conference Baseball Tournament, for example, was established in 2014 as a college-level baseball conference championship tournament.

Such tournaments are expected to help popularise baseball around the world while also benefiting the global baseball equipment market. During the forecast period, this is considered to augur well for the global crossfit apparel market's future trends.

Fashionable sports apparel is in high demand as it is versatile, convenient, trendy, and can be worn for a variety of occasions.

The crossfit apparel market share is enlarged by the market players as they are successful in capitalizing on the increased emphasis on style.

These market players have introduced innovative, technologically advanced products that are both comfortable and practical to meet this demand, opening up a wide array of crossfit apparel market opportunities.

Another factor fostering the crossfit apparel market growth is the demand for fashionable color combinations in various sports activities.

The profit margins of the major crossfit clothing brands, such as Nike, PUMA, and Adidas, are unstable, and the same is due to fluctuating raw material prices and increasing market competition among crossfit clothing companies.

Price wars among top crossfit clothing brands result from the emergence of local players, and the same forces vendors to lower the prices of their products, which reduces their profit margins as well as crossfit apparel market share.

As a result, rising raw material prices have a negative impact on vendors' profit margins, limiting the crossfit apparel market growth.

The crossfit market statistics are likely to witness a positive phase due to the increase in adventure sports, growing geriatric population, and rising obese population as people shift their focus to healthy living for the aforementioned reasons.

However, several factors, such as labor shortages and unprecedented growth in e-commerce changing consumer preferences, are likely to have a negative impact on the crossfit apparel market growth.

Sneha Verghese
Sneha Verghese

Principal Consultant

Talk to Analyst

Find your sweet spots for generating winning opportunities in this market.

Comparative View of Crossfit Apparel Market

Crossfit Apparel Market:

Attributes Crossfit Apparel Market
CAGR (2022 to 2032) 2.8%
Market Value (2026) US$ 131.5 Million
Growth Factor The growing number of sports tournaments is significantly driving the growth of the crossfit apparel market in various regions around the globe.
Opportunity Innovative, technologically advanced products that are both comfortable and practical introduced and launched by the market players are expected to create numerous opportunities in the market.
Key Trends The recent rise in demand for fashionable sports apparel owing to its versatility, convenience, and trend is considered a key crossfit apparel market trend.

Activewear Market:

Attributes Activewear Market
CAGR (2022 to 2032) 6.4%
Market Value (2026) US$ 563 Billion
Growth Factor Increased participation in physical activities by the youth and elderly population drives demand for sports-related products, driving the market growth.
Opportunity Many organizations are taking initiatives to empower women and running campaigns to promote sports participation, which is expected to provide growth opportunities for the activewear market.
Key Trends The increased use of green textiles and the production of activewear using sustainable methods is a key market trend.

Plus Size Clothing Market:

Attributes Plus Size Clothing Market
CAGR (2022 to 2032) 5.7%
Market Value (2026) US$ 784 Billion
Growth Factor With the adoption of global fashion trends, rising purchasing power, and consumer preference for sophisticated products that are typically exclusive and designed by fashion industry experts, market growth is likely to skyrocket.
Opportunity The increased availability of plus-size clothing via omnichannel retail and the expansion of brand presence in the industry is expected to create numerous plus-size clothing market opportunities.
Key Trends The trend of body positivity and increased confidence among plus-size women, fueled by strong fashion advertisements and promotional campaigns, hold a great influence over the market.

Social media continues to be an effective platform for influencers and digital communities to connect consumers and commerce, and leading crossfit apparel companies are capitalizing on this emerging trend in the crossfit apparel market.

Companies that were able to streamline this link between engagement and sales in 2021 were able to significantly augment their crossfit apparel market share.

These crossfit clothing companies have even built digital consumer-engagement ecosystems spanning from the company's website to its own app and retail stores, using the generated data to inform areas such as product development.

The crossfit apparel market demand analysis is also greatly influenced by constantly changing social media platforms: live streaming as a promotional tool and a shopping channel is now well-established in Asia and is expected to spread globally.

Early adopters in the sporting goods industry are attempting to gain a foothold in this metaverse, and others are expected to follow suit, thereby positively impacting the crossfit apparel market statistics.

How is the Crossfit Apparel Market Categorized?

On the basis of product, the crossfit apparel market is segmented into shirts, pants, and others, including shorts, sweatshirts & hoodies, and tank-top.

The top wear segment is estimated to be at the forefront of the crossfit apparel market during the forecast period.

The USA is the largest regional market for the top wear segment, accounting for a major crossfit apparel market share.

By material type, the market is categorized into nylon, wool, polyester, and others.

The crossfit apparel market, based on consumer orientation, is segmented into men, women, and unisex.

During the forecast period, the women's crossfit apparel market share is expected to grow significantly.

Some of the factors driving this segment are an increase in the demand from developing countries, the number of working women, and the recovery from the recession.

Another factor contributing to the segment's growth is the significant increase in women's participation in sports and fitness activities in various countries around the globe.

This has narrowed the gender participation gap and augmented per-unit sales of crossfit apparel, propelling the overall market growth.

Women are more fashion-conscious than men, requiring top crossfit clothing companies to update their product line with new designs and styles in order to encourage more female consumers.

On account of all of these factors, the segment is expected to grow rapidly during the forecast period, majorly contributing to the overall crossfit apparel market size.

Based on sales channels, the market is divided into direct Sales, franchised Stores, specialty stores, online retailers, and other sales channels such as mono-brand stores, and wholesalers/retailers.
Get the data you need at a Fraction of the cost

Personalize your report by choosing insights you need
and save 40%!

What is the Regional Outlook for the Crossfit Apparel Market?

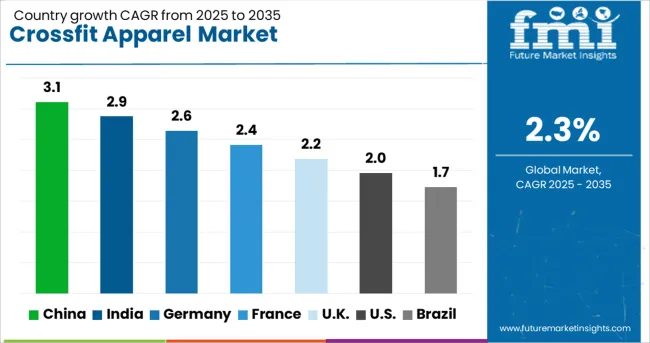
The USA is anticipated to hold a major crossfit apparel market share on account of the highly evolved retail structure and increased adoption of sports apparel as a result of aggressive advertising and celebrity brand endorsement.

Increased consumer spending on fitness apparel as a fashion statement contributes to the crossfit apparel market size in this region.

Due to rapidly improving retail infrastructure and rising disposable income in China, the region is expected to witness a huge demand for crossfit apparel.

China is also aided by government initiatives to encourage active participation in sports, leading to rising sales of crossfit apparel in the region.

The crossfit apparel market in India is fostered by the growing appetite for foreign brands, a desire to live a healthier lifestyle, and rising disposable income in the region.

How Strong is the Competition in the Crossfit Apparel Market?

The crossfit apparel market is fragmented, with only a few notable international and regional players.

The crossfit apparel brands are competing by deploying growth strategies such as quality, price, brand, and variety, in turn, shaping the crossfit apparel market's key trends & opportunities.

The players in the crossfit apparel market have adopted acquisition as their primary development strategy in order to increase profitability and augment their crossfit apparel market share.

Product launches have also been used by key players to improve their product portfolios, stay relevant, and consolidate their position in the global market.

Some of the recent developments in crossfit apparel market are as follows:

  • As part of a three-year strategic partnership agreement signed with the franchise, global sports brand PUMA launched a Royal Challenger Bangalore (RCB) athleisure range.
  • Eastbay and Champs Sports have announced the launch of Eastbay Performance, a new apparel line. The collection includes compression tops, tanks, tights, tees, jackets, and shorts for training, and fleece pants and hoodies for casual wear.
  • Kappa, a leading Italian fashion sports brand, and Hyosung, a comprehensive fiber manufacturer that produces world-class products and provides value chain solutions from textile mill to the brand to consumer, have announced a partnership to launch Kappa's new K-Spirit e-sports apparel collection at the Tencent Global E-Sports Arena (TGA).

Key Companies

  • Adidas AG
  • Reebok International Limited
  • Anta Sports Products Limited
  • ASICS Corporation
  • Columbia Sportswear Company
  • Elite Sportswear
  • LP
  • Hanesbrands Inc.
  • NIKE, Inc.
  • Patagonia Inc.
  • Puma SE
  • Under Armour Inc.

Key Segments

By Product:

  • Shirts
  • Pants
  • Others
  • Shorts
  • Sweatshirts & Hoodies
  • Tank-top

By Material Type:

  • Nylon
  • Wool
  • Polyester
  • Others

By Sales Channel:

  • Direct Sales
  • Franchised Stores
  • Specialty stores
  • Online retailers
  • Other sales channels
  • mono-brand stores
  • wholesalers/retailers

By Consumer Orientation:

  • Men
  • Women
  • Unisex

By Region:

  • North America
  • Latin America
  • Europe
  • East Asia
  • South Asia
  • Oceania
  • Middle East and Africa

Frequently Asked Questions

What is the Growth Outlook for the Crossfit Apparel Market?

The crossfit apparel market is projected to register a CAGR of 2.8% during the forecast period (2022 to 2032).

Which is the Leading Region in the Crossfit Apparel Market?

During the projected period, North America is expected to lead the crossfit apparel market during the forecast period.

Which Segment is Expected to Dominate the Crossfit Apparel Market by Consumer Orientation?

The segment of women is likely to dominate the crossfit apparel market over the forecast period.

What is the Estimated Crossfit Apparel Market Size by 2032?

The crossfit apparel market is expected to be valued at US$ 149 Million by 2032.

Which was the Historical Size of the Crossfit Apparel Market?

The crossfit apparel market size accounted for about US$ 105.4 Million in 2021.

Table of Content

1. Executive Summary | Crossfit Apparel Market

    1.1. Global Market Outlook

    1.2. Demand-side Trends

    1.3. Supply-side Trends

    1.4. Technology Roadmap Analysis

    1.5. Analysis and Recommendations

2. Market Overview

    2.1. Market Coverage / Taxonomy

    2.2. Market Definition / Scope / Limitations

3. Market Background

    3.1. Market Dynamics

        3.1.1. Drivers

        3.1.2. Restraints

        3.1.3. Opportunity

        3.1.4. Trends

    3.2. Scenario Forecast

        3.2.1. Demand in Optimistic Scenario

        3.2.2. Demand in Likely Scenario

        3.2.3. Demand in Conservative Scenario

    3.3. Opportunity Map Analysis

    3.4. Supply Chain Analysis

    3.5. Investment Feasibility Matrix

    3.6. Value Chain Analysis

        3.6.1. Profit Margin Analysis

        3.6.2. Wholesalers and Distributors

        3.6.3. Retailers

    3.7. PESTLE and Porter’s Analysis

4. Global Market Analysis 2017 to 2021 and Forecast, 2022 to 2032

    4.1. Historical Market Size Value (US$ Million) & Volume (Units) Analysis, 2017 to 2021

    4.2. Current and Future Market Size Value (US$ Million) & Volume (Units) Projections, 2022 to 2032

        4.2.1. Y-o-Y Growth Trend Analysis

        4.2.2. Absolute $ Opportunity Analysis

5. Global Market Analysis 2017 to 2021 and Forecast 2022 to 2032, By Product Type

    5.1. Introduction / Key Findings

    5.2. Historical Market Size Value (US$ Million) & Volume (Units) Analysis By Product Type, 2017 to 2021

    5.3. Current and Future Market Size Value (US$ Million) & Volume (Units) Analysis and Forecast By Product Type, 2022 to 2032

        5.3.1. Shirts

        5.3.2. Pants

        5.3.3. Others

    5.4. Y-o-Y Growth Trend Analysis By Product Type, 2017 to 2021

    5.5. Absolute $ Opportunity Analysis By Product Type, 2022 to 2032

6. Global Market Analysis 2017 to 2021 and Forecast 2022 to 2032, By Material Type

    6.1. Introduction / Key Findings

    6.2. Historical Market Size Value (US$ Million) & Volume (Units) Analysis By Material Type, 2017 to 2021

    6.3. Current and Future Market Size Value (US$ Million) & Volume (Units) Analysis and Forecast By Material Type, 2022 to 2032

        6.3.1. Nylon

        6.3.2. Wool

        6.3.3. Polyester

        6.3.4. Others

    6.4. Y-o-Y Growth Trend Analysis By Material Type, 2017 to 2021

    6.5. Absolute $ Opportunity Analysis By Material Type, 2022 to 2032

7. Global Market Analysis 2017 to 2021 and Forecast 2022 to 2032, By Consumer Orientation

    7.1. Introduction / Key Findings

    7.2. Historical Market Size Value (US$ Million) & Volume (Units) Analysis By Consumer Orientation, 2017 to 2021

    7.3. Current and Future Market Size Value (US$ Million) & Volume (Units) Analysis and Forecast By Consumer Orientation, 2022 to 2032

        7.3.1. Men

        7.3.2. Women

        7.3.3. Unisex

    7.4. Y-o-Y Growth Trend Analysis By Consumer Orientation, 2017 to 2021

    7.5. Absolute $ Opportunity Analysis By Consumer Orientation, 2022 to 2032

8. Global Market Analysis 2017 to 2021 and Forecast 2022 to 2032, By Sales Channel

    8.1. Introduction / Key Findings

    8.2. Historical Market Size Value (US$ Million) & Volume (Units) Analysis By Sales Channel, 2017 to 2021

    8.3. Current and Future Market Size Value (US$ Million) & Volume (Units) Analysis and Forecast By Sales Channel, 2022 to 2032

        8.3.1. Direct Sales

        8.3.2. Franchise Stores

        8.3.3. Specialty Stores

        8.3.4. Online Retailers

        8.3.5. Other Sales Channel

    8.4. Y-o-Y Growth Trend Analysis By Sales Channel, 2017 to 2021

    8.5. Absolute $ Opportunity Analysis By Sales Channel, 2022 to 2032

9. Global Market Analysis 2017 to 2021 and Forecast 2022 to 2032, By Region

    9.1. Introduction

    9.2. Historical Market Size Value (US$ Million) & Volume (Units) Analysis By Region, 2017 to 2021

    9.3. Current Market Size Value (US$ Million) & Volume (Units) Analysis and Forecast By Region, 2022 to 2032

        9.3.1. North America

        9.3.2. Latin America

        9.3.3. Europe

        9.3.4. East Asia

        9.3.5. South Asia

        9.3.6. Oceania

        9.3.7. Middle East and Africa (MEA)

    9.4. Market Attractiveness Analysis By Region

10. North America Market Analysis 2017 to 2021 and Forecast 2022 to 2032, By Country

    10.1. Historical Market Size Value (US$ Million) & Volume (Units) Trend Analysis By Market Taxonomy, 2017 to 2021

    10.2. Market Size Value (US$ Million) & Volume (Units) Forecast By Market Taxonomy, 2022 to 2032

        10.2.1. By Country

            10.2.1.1. United States of America

            10.2.1.2. Canada

        10.2.2. By Product Type

        10.2.3. By Material Type

        10.2.4. By Consumer Orientation

        10.2.5. By Sales Channel

    10.3. Market Attractiveness Analysis

        10.3.1. By Country

        10.3.2. By Product Type

        10.3.3. By Material Type

        10.3.4. By Consumer Orientation

        10.3.5. By Sales Channel

    10.4. Key Takeaways

11. Latin America Market Analysis 2017 to 2021 and Forecast 2022 to 2032, By Country

    11.1. Historical Market Size Value (US$ Million) & Volume (Units) Trend Analysis By Market Taxonomy, 2017 to 2021

    11.2. Market Size Value (US$ Million) & Volume (Units) Forecast By Market Taxonomy, 2022 to 2032

        11.2.1. By Country

            11.2.1.1. Brazil

            11.2.1.2. Mexico

            11.2.1.3. Argentina

            11.2.1.4. Rest of Latin America

        11.2.2. By Product Type

        11.2.3. By Material Type

        11.2.4. By Consumer Orientation

        11.2.5. By Sales Channel

    11.3. Market Attractiveness Analysis

        11.3.1. By Country

        11.3.2. By Product Type

        11.3.3. By Material Type

        11.3.4. By Consumer Orientation

        11.3.5. By Sales Channel

    11.4. Key Takeaways

12. Europe Market Analysis 2017 to 2021 and Forecast 2022 to 2032, By Country

    12.1. Historical Market Size Value (US$ Million) & Volume (Units) Trend Analysis By Market Taxonomy, 2017 to 2021

    12.2. Market Size Value (US$ Million) & Volume (Units) Forecast By Market Taxonomy, 2022 to 2032

        12.2.1. By Country

            12.2.1.1. Germany

            12.2.1.2. Italy

            12.2.1.3. France

            12.2.1.4. United Kingdom

            12.2.1.5. Spain

            12.2.1.6. Russia

            12.2.1.7. BENELUX

            12.2.1.8. Rest of Europe

        12.2.2. By Product Type

        12.2.3. By Material Type

        12.2.4. By Consumer Orientation

        12.2.5. By Sales Channel

    12.3. Market Attractiveness Analysis

        12.3.1. By Country

        12.3.2. By Product Type

        12.3.3. By Material Type

        12.3.4. By Consumer Orientation

        12.3.5. By Sales Channel

    12.4. Key Takeaways

13. East Asia Market Analysis 2017 to 2021 and Forecast 2022 to 2032, By Country

    13.1. Historical Market Size Value (US$ Million) & Volume (Units) Trend Analysis By Market Taxonomy, 2017 to 2021

    13.2. Market Size Value (US$ Million) & Volume (Units) Forecast By Market Taxonomy, 2022 to 2032

        13.2.1. By Country

            13.2.1.1. China

            13.2.1.2. Japan

            13.2.1.3. South Korea

        13.2.2. By Product Type

        13.2.3. By Material Type

        13.2.4. By Consumer Orientation

        13.2.5. By Sales Channel

    13.3. Market Attractiveness Analysis

        13.3.1. By Country

        13.3.2. By Product Type

        13.3.3. By Material Type

        13.3.4. By Consumer Orientation

        13.3.5. By Sales Channel

    13.4. Key Takeaways

14. South Asia Market Analysis 2017 to 2021 and Forecast 2022 to 2032, By Country

    14.1. Historical Market Size Value (US$ Million) & Volume (Units) Trend Analysis By Market Taxonomy, 2017 to 2021

    14.2. Market Size Value (US$ Million) & Volume (Units) Forecast By Market Taxonomy, 2022 to 2032

        14.2.1. By Country

            14.2.1.1. India

            14.2.1.2. Thailand

            14.2.1.3. Malaysia

            14.2.1.4. Indonesia

            14.2.1.5. Rest of South Asia

        14.2.2. By Product Type

        14.2.3. By Material Type

        14.2.4. By Consumer Orientation

        14.2.5. By Sales Channel

    14.3. Market Attractiveness Analysis

        14.3.1. By Country

        14.3.2. By Product Type

        14.3.3. By Material Type

        14.3.4. By Consumer Orientation

        14.3.5. By Sales Channel

    14.4. Key Takeaways

15. Oceania Market Analysis 2017 to 2021 and Forecast 2022 to 2032, By Country

    15.1. Historical Market Size Value (US$ Million) & Volume (Units) Trend Analysis By Market Taxonomy, 2017 to 2021

    15.2. Market Size Value (US$ Million) & Volume (Units) Forecast By Market Taxonomy, 2022 to 2032

        15.2.1. By Country

            15.2.1.1. Australia

            15.2.1.2. New Zealand

        15.2.2. By Product Type

        15.2.3. By Material Type

        15.2.4. By Consumer Orientation

        15.2.5. By Sales Channel

    15.3. Market Attractiveness Analysis

        15.3.1. By Country

        15.3.2. By Product Type

        15.3.3. By Material Type

        15.3.4. By Consumer Orientation

        15.3.5. By Sales Channel

    15.4. Key Takeaways

16. MEA Market Analysis 2017 to 2021 and Forecast 2022 to 2032, By Country

    16.1. Historical Market Size Value (US$ Million) & Volume (Units) Trend Analysis By Market Taxonomy, 2017 to 2021

    16.2. Market Size Value (US$ Million) & Volume (Units) Forecast By Market Taxonomy, 2022 to 2032

        16.2.1. By Country

            16.2.1.1. GCC Countries

            16.2.1.2. South Africa

            16.2.1.3. North Africa

            16.2.1.4. Rest of MEA

        16.2.2. By Product Type

        16.2.3. By Material Type

        16.2.4. By Consumer Orientation

        16.2.5. By Sales Channel

    16.3. Market Attractiveness Analysis

        16.3.1. By Country

        16.3.2. By Product Type

        16.3.3. By Material Type

        16.3.4. By Consumer Orientation

        16.3.5. By Sales Channel

    16.4. Key Takeaways

17. Key Countries Market Analysis

    17.1. United States of America

        17.1.1. Pricing Analysis

        17.1.2. Market Share Analysis, 2021

            17.1.2.1. By Product Type

            17.1.2.2. By Material Type

            17.1.2.3. By Consumer Orientation

            17.1.2.4. By Sales Channel

    17.2. Canada

        17.2.1. Pricing Analysis

        17.2.2. Market Share Analysis, 2021

            17.2.2.1. By Product Type

            17.2.2.2. By Material Type

            17.2.2.3. By Consumer Orientation

            17.2.2.4. By Sales Channel

    17.3. Brazil

        17.3.1. Pricing Analysis

        17.3.2. Market Share Analysis, 2021

            17.3.2.1. By Product Type

            17.3.2.2. By Material Type

            17.3.2.3. By Consumer Orientation

            17.3.2.4. By Sales Channel

    17.4. Mexico

        17.4.1. Pricing Analysis

        17.4.2. Market Share Analysis, 2021

            17.4.2.1. By Product Type

            17.4.2.2. By Material Type

            17.4.2.3. By Consumer Orientation

            17.4.2.4. By Sales Channel

    17.5. Argentina

        17.5.1. Pricing Analysis

        17.5.2. Market Share Analysis, 2021

            17.5.2.1. By Product Type

            17.5.2.2. By Material Type

            17.5.2.3. By Consumer Orientation

            17.5.2.4. By Sales Channel

    17.6. UK

        17.6.1. Pricing Analysis

        17.6.2. Market Share Analysis, 2021

            17.6.2.1. By Product Type

            17.6.2.2. By Material Type

            17.6.2.3. By Consumer Orientation

            17.6.2.4. By Sales Channel

    17.7. Germany

        17.7.1. Pricing Analysis

        17.7.2. Market Share Analysis, 2021

            17.7.2.1. By Product Type

            17.7.2.2. By Material Type

            17.7.2.3. By Consumer Orientation

            17.7.2.4. By Sales Channel

    17.8. Italy

        17.8.1. Pricing Analysis

        17.8.2. Market Share Analysis, 2021

            17.8.2.1. By Product Type

            17.8.2.2. By Material Type

            17.8.2.3. By Consumer Orientation

            17.8.2.4. By Sales Channel

    17.9. Spain

        17.9.1. Pricing Analysis

        17.9.2. Market Share Analysis, 2021

            17.9.2.1. By Product Type

            17.9.2.2. By Material Type

            17.9.2.3. By Consumer Orientation

            17.9.2.4. By Sales Channel

    17.10. France

        17.10.1. Pricing Analysis

        17.10.2. Market Share Analysis, 2021

            17.10.2.1. By Product Type

            17.10.2.2. By Material Type

            17.10.2.3. By Consumer Orientation

            17.10.2.4. By Sales Channel

    17.11. Australia

        17.11.1. Pricing Analysis

        17.11.2. Market Share Analysis, 2021

            17.11.2.1. By Product Type

            17.11.2.2. By Material Type

            17.11.2.3. By Consumer Orientation

            17.11.2.4. By Sales Channel

    17.12. New Zealand

        17.12.1. Pricing Analysis

        17.12.2. Market Share Analysis, 2021

            17.12.2.1. By Product Type

            17.12.2.2. By Material Type

            17.12.2.3. By Consumer Orientation

            17.12.2.4. By Sales Channel

    17.13. India

        17.13.1. Pricing Analysis

        17.13.2. Market Share Analysis, 2021

            17.13.2.1. By Product Type

            17.13.2.2. By Material Type

            17.13.2.3. By Consumer Orientation

            17.13.2.4. By Sales Channel

    17.14. Thailand

        17.14.1. Pricing Analysis

        17.14.2. Market Share Analysis, 2021

            17.14.2.1. By Product Type

            17.14.2.2. By Material Type

            17.14.2.3. By Consumer Orientation

            17.14.2.4. By Sales Channel

    17.15. Indonesia

        17.15.1. Pricing Analysis

        17.15.2. Market Share Analysis, 2021

            17.15.2.1. By Product Type

            17.15.2.2. By Material Type

            17.15.2.3. By Consumer Orientation

            17.15.2.4. By Sales Channel

    17.16. China

        17.16.1. Pricing Analysis

        17.16.2. Market Share Analysis, 2021

            17.16.2.1. By Product Type

            17.16.2.2. By Material Type

            17.16.2.3. By Consumer Orientation

            17.16.2.4. By Sales Channel

    17.17. Japan

        17.17.1. Pricing Analysis

        17.17.2. Market Share Analysis, 2021

            17.17.2.1. By Product Type

            17.17.2.2. By Material Type

            17.17.2.3. By Consumer Orientation

            17.17.2.4. By Sales Channel

    17.18. South Korea

        17.18.1. Pricing Analysis

        17.18.2. Market Share Analysis, 2021

            17.18.2.1. By Product Type

            17.18.2.2. By Material Type

            17.18.2.3. By Consumer Orientation

            17.18.2.4. By Sales Channel

    17.19. GCC Countries

        17.19.1. Pricing Analysis

        17.19.2. Market Share Analysis, 2021

            17.19.2.1. By Product Type

            17.19.2.2. By Material Type

            17.19.2.3. By Consumer Orientation

            17.19.2.4. By Sales Channel

18. Market Structure Analysis

    18.1. Competition Dashboard

    18.2. Competition Benchmarking

    18.3. Market Share Analysis of Top Players

        18.3.1. By Regional

        18.3.2. By Product Type

        18.3.3. By Material Type

        18.3.4. By Consumer Orientation

        18.3.5. By Sales Channel

19. Competition Analysis

    19.1. Competition Deep Dive

        19.1.1. Nike Inc

            19.1.1.1. Overview

            19.1.1.2. Product Portfolio

            19.1.1.3. Sales Footprint

            19.1.1.4. Strategy Overview

                19.1.1.4.1. Marketing Strategy

                19.1.1.4.2. Product Strategy

                19.1.1.4.3. Channel Strategy

        19.1.2. Adidas AG

            19.1.2.1. Overview

            19.1.2.2. Product Portfolio

            19.1.2.3. Sales Footprint

            19.1.2.4. Strategy Overview

                19.1.2.4.1. Marketing Strategy

                19.1.2.4.2. Product Strategy

                19.1.2.4.3. Channel Strategy

        19.1.3. Dick's Sports Goods

            19.1.3.1. Overview

            19.1.3.2. Product Portfolio

            19.1.3.3. Sales Footprint

            19.1.3.4. Strategy Overview

                19.1.3.4.1. Marketing Strategy

                19.1.3.4.2. Product Strategy

                19.1.3.4.3. Channel Strategy

        19.1.4. PUMA SE

            19.1.4.1. Overview

            19.1.4.2. Product Portfolio

            19.1.4.3. Sales Footprint

            19.1.4.4. Strategy Overview

                19.1.4.4.1. Marketing Strategy

                19.1.4.4.2. Product Strategy

                19.1.4.4.3. Channel Strategy

        19.1.5. Columbia Sports

            19.1.5.1. Overview

            19.1.5.2. Product Portfolio

            19.1.5.3. Sales Footprint

            19.1.5.4. Strategy Overview

                19.1.5.4.1. Marketing Strategy

                19.1.5.4.2. Product Strategy

                19.1.5.4.3. Channel Strategy

        19.1.6. ASICS Corp

            19.1.6.1. Overview

            19.1.6.2. Product Portfolio

            19.1.6.3. Sales Footprint

            19.1.6.4. Strategy Overview

                19.1.6.4.1. Marketing Strategy

                19.1.6.4.2. Product Strategy

                19.1.6.4.3. Channel Strategy

        19.1.7. VF Corporation

            19.1.7.1. Overview

            19.1.7.2. Product Portfolio

            19.1.7.3. Sales Footprint

            19.1.7.4. Strategy Overview

                19.1.7.4.1. Marketing Strategy

                19.1.7.4.2. Product Strategy

                19.1.7.4.3. Channel Strategy

        19.1.8. PVH Corporation

            19.1.8.1. Overview

            19.1.8.2. Product Portfolio

            19.1.8.3. Sales Footprint

            19.1.8.4. Strategy Overview

                19.1.8.4.1. Marketing Strategy

                19.1.8.4.2. Product Strategy

                19.1.8.4.3. Channel Strategy

        19.1.9. G-III Apparel Group Limited

            19.1.9.1. Overview

            19.1.9.2. Product Portfolio

            19.1.9.3. Sales Footprint

            19.1.9.4. Strategy Overview

                19.1.9.4.1. Marketing Strategy

                19.1.9.4.2. Product Strategy

                19.1.9.4.3. Channel Strategy

        19.1.10. Gildan Activewear Inc

            19.1.10.1. Overview

            19.1.10.2. Product Portfolio

            19.1.10.3. Sales Footprint

            19.1.10.4. Strategy Overview

                19.1.10.4.1. Marketing Strategy

                19.1.10.4.2. Product Strategy

                19.1.10.4.3. Channel Strategy

        19.1.11. Hanes Brands Inc

            19.1.11.1. Overview

            19.1.11.2. Product Portfolio

            19.1.11.3. Sales Footprint

            19.1.11.4. Strategy Overview

                19.1.11.4.1. Marketing Strategy

                19.1.11.4.2. Product Strategy

                19.1.11.4.3. Channel Strategy

        19.1.12. Patagonia Inc

            19.1.12.1. Overview

            19.1.12.2. Product Portfolio

            19.1.12.3. Sales Footprint

            19.1.12.4. Strategy Overview

                19.1.12.4.1. Marketing Strategy

                19.1.12.4.2. Product Strategy

                19.1.12.4.3. Channel Strategy

        19.1.13. Reebok International Ltd

            19.1.13.1. Overview

            19.1.13.2. Product Portfolio

            19.1.13.3. Sales Footprint

            19.1.13.4. Strategy Overview

                19.1.13.4.1. Marketing Strategy

                19.1.13.4.2. Product Strategy

                19.1.13.4.3. Channel Strategy

        19.1.14. Anta Sports Products Ltd

            19.1.14.1. Overview

            19.1.14.2. Product Portfolio

            19.1.14.3. Sales Footprint

            19.1.14.4. Strategy Overview

                19.1.14.4.1. Marketing Strategy

                19.1.14.4.2. Product Strategy

                19.1.14.4.3. Channel Strategy

        19.1.15. Elite Sportswear LP

            19.1.15.1. Overview

            19.1.15.2. Product Portfolio

            19.1.15.3. Sales Footprint

            19.1.15.4. Strategy Overview

                19.1.15.4.1. Marketing Strategy

                19.1.15.4.2. Product Strategy

                19.1.15.4.3. Channel Strategy

        19.1.16. Under Armour Inc.

            19.1.16.1. Overview

            19.1.16.2. Product Portfolio

            19.1.16.3. Sales Footprint

            19.1.16.4. Strategy Overview

                19.1.16.4.1. Marketing Strategy

                19.1.16.4.2. Product Strategy

                19.1.16.4.3. Channel Strategy

20. Assumptions & Acronyms Used

21. Research Methodology

Don't pay for what you don't need

Customize your report by selecting specific countries or regions and save 30%!

List of Tables

Table 1: Global Market Value (US$ Million) Forecast by Region, 2017 to 2032

Table 2: Global Market Volume (Units) Forecast by Region, 2017 to 2032

Table 3: Global Market Value (US$ Million) Forecast by Product Type, 2017 to 2032

Table 4: Global Market Volume (Units) Forecast by Product Type, 2017 to 2032

Table 5: Global Market Value (US$ Million) Forecast by Material Type, 2017 to 2032

Table 6: Global Market Volume (Units) Forecast by Material Type, 2017 to 2032

Table 7: Global Market Value (US$ Million) Forecast by Consumer Orientation, 2017 to 2032

Table 8: Global Market Volume (Units) Forecast by Consumer Orientation, 2017 to 2032

Table 9: Global Market Value (US$ Million) Forecast by Sales Channel, 2017 to 2032

Table 10: Global Market Volume (Units) Forecast by Sales Channel, 2017 to 2032

Table 11: North America Market Value (US$ Million) Forecast by Country, 2017 to 2032

Table 12: North America Market Volume (Units) Forecast by Country, 2017 to 2032

Table 13: North America Market Value (US$ Million) Forecast by Product Type, 2017 to 2032

Table 14: North America Market Volume (Units) Forecast by Product Type, 2017 to 2032

Table 15: North America Market Value (US$ Million) Forecast by Material Type, 2017 to 2032

Table 16: North America Market Volume (Units) Forecast by Material Type, 2017 to 2032

Table 17: North America Market Value (US$ Million) Forecast by Consumer Orientation, 2017 to 2032

Table 18: North America Market Volume (Units) Forecast by Consumer Orientation, 2017 to 2032

Table 19: North America Market Value (US$ Million) Forecast by Sales Channel, 2017 to 2032

Table 20: North America Market Volume (Units) Forecast by Sales Channel, 2017 to 2032

Table 21: Latin America Market Value (US$ Million) Forecast by Country, 2017 to 2032

Table 22: Latin America Market Volume (Units) Forecast by Country, 2017 to 2032

Table 23: Latin America Market Value (US$ Million) Forecast by Product Type, 2017 to 2032

Table 24: Latin America Market Volume (Units) Forecast by Product Type, 2017 to 2032

Table 25: Latin America Market Value (US$ Million) Forecast by Material Type, 2017 to 2032

Table 26: Latin America Market Volume (Units) Forecast by Material Type, 2017 to 2032

Table 27: Latin America Market Value (US$ Million) Forecast by Consumer Orientation, 2017 to 2032

Table 28: Latin America Market Volume (Units) Forecast by Consumer Orientation, 2017 to 2032

Table 29: Latin America Market Value (US$ Million) Forecast by Sales Channel, 2017 to 2032

Table 30: Latin America Market Volume (Units) Forecast by Sales Channel, 2017 to 2032

Table 31: Europe Market Value (US$ Million) Forecast by Country, 2017 to 2032

Table 32: Europe Market Volume (Units) Forecast by Country, 2017 to 2032

Table 33: Europe Market Value (US$ Million) Forecast by Product Type, 2017 to 2032

Table 34: Europe Market Volume (Units) Forecast by Product Type, 2017 to 2032

Table 35: Europe Market Value (US$ Million) Forecast by Material Type, 2017 to 2032

Table 36: Europe Market Volume (Units) Forecast by Material Type, 2017 to 2032

Table 37: Europe Market Value (US$ Million) Forecast by Consumer Orientation, 2017 to 2032

Table 38: Europe Market Volume (Units) Forecast by Consumer Orientation, 2017 to 2032

Table 39: Europe Market Value (US$ Million) Forecast by Sales Channel, 2017 to 2032

Table 40: Europe Market Volume (Units) Forecast by Sales Channel, 2017 to 2032

Table 41: East Asia Market Value (US$ Million) Forecast by Country, 2017 to 2032

Table 42: East Asia Market Volume (Units) Forecast by Country, 2017 to 2032

Table 43: East Asia Market Value (US$ Million) Forecast by Product Type, 2017 to 2032

Table 44: East Asia Market Volume (Units) Forecast by Product Type, 2017 to 2032

Table 45: East Asia Market Value (US$ Million) Forecast by Material Type, 2017 to 2032

Table 46: East Asia Market Volume (Units) Forecast by Material Type, 2017 to 2032

Table 47: East Asia Market Value (US$ Million) Forecast by Consumer Orientation, 2017 to 2032

Table 48: East Asia Market Volume (Units) Forecast by Consumer Orientation, 2017 to 2032

Table 49: East Asia Market Value (US$ Million) Forecast by Sales Channel, 2017 to 2032

Table 50: East Asia Market Volume (Units) Forecast by Sales Channel, 2017 to 2032

Table 51: South Asia Market Value (US$ Million) Forecast by Country, 2017 to 2032

Table 52: South Asia Market Volume (Units) Forecast by Country, 2017 to 2032

Table 53: South Asia Market Value (US$ Million) Forecast by Product Type, 2017 to 2032

Table 54: South Asia Market Volume (Units) Forecast by Product Type, 2017 to 2032

Table 55: South Asia Market Value (US$ Million) Forecast by Material Type, 2017 to 2032

Table 56: South Asia Market Volume (Units) Forecast by Material Type, 2017 to 2032

Table 57: South Asia Market Value (US$ Million) Forecast by Consumer Orientation, 2017 to 2032

Table 58: South Asia Market Volume (Units) Forecast by Consumer Orientation, 2017 to 2032

Table 59: South Asia Market Value (US$ Million) Forecast by Sales Channel, 2017 to 2032

Table 60: South Asia Market Volume (Units) Forecast by Sales Channel, 2017 to 2032

Table 61: Oceania Market Value (US$ Million) Forecast by Country, 2017 to 2032

Table 62: Oceania Market Volume (Units) Forecast by Country, 2017 to 2032

Table 63: Oceania Market Value (US$ Million) Forecast by Product Type, 2017 to 2032

Table 64: Oceania Market Volume (Units) Forecast by Product Type, 2017 to 2032

Table 65: Oceania Market Value (US$ Million) Forecast by Material Type, 2017 to 2032

Table 66: Oceania Market Volume (Units) Forecast by Material Type, 2017 to 2032

Table 67: Oceania Market Value (US$ Million) Forecast by Consumer Orientation, 2017 to 2032

Table 68: Oceania Market Volume (Units) Forecast by Consumer Orientation, 2017 to 2032

Table 69: Oceania Market Value (US$ Million) Forecast by Sales Channel, 2017 to 2032

Table 70: Oceania Market Volume (Units) Forecast by Sales Channel, 2017 to 2032

Table 71: MEA Market Value (US$ Million) Forecast by Country, 2017 to 2032

Table 72: MEA Market Volume (Units) Forecast by Country, 2017 to 2032

Table 73: MEA Market Value (US$ Million) Forecast by Product Type, 2017 to 2032

Table 74: MEA Market Volume (Units) Forecast by Product Type, 2017 to 2032

Table 75: MEA Market Value (US$ Million) Forecast by Material Type, 2017 to 2032

Table 76: MEA Market Volume (Units) Forecast by Material Type, 2017 to 2032

Table 77: MEA Market Value (US$ Million) Forecast by Consumer Orientation, 2017 to 2032

Table 78: MEA Market Volume (Units) Forecast by Consumer Orientation, 2017 to 2032

Table 79: MEA Market Value (US$ Million) Forecast by Sales Channel, 2017 to 2032

Table 80: MEA Market Volume (Units) Forecast by Sales Channel, 2017 to 2032
Sneha Verghese
Sneha Verghese

Principal Consultant

Talk to Analyst

Find your sweet spots for generating winning opportunities in this market.

List of Charts

Figure 1: Global Market Value (US$ Million) by Product Type, 2022 to 2032

Figure 2: Global Market Value (US$ Million) by Material Type, 2022 to 2032

Figure 3: Global Market Value (US$ Million) by Consumer Orientation, 2022 to 2032

Figure 4: Global Market Value (US$ Million) by Sales Channel, 2022 to 2032

Figure 5: Global Market Value (US$ Million) by Region, 2022 to 2032

Figure 6: Global Market Value (US$ Million) Analysis by Region, 2017 to 2032

Figure 7: Global Market Volume (Units) Analysis by Region, 2017 to 2032

Figure 8: Global Market Value Share (%) and BPS Analysis by Region, 2022 to 2032

Figure 9: Global Market Y-o-Y Growth (%) Projections by Region, 2022 to 2032

Figure 10: Global Market Value (US$ Million) Analysis by Product Type, 2017 to 2032

Figure 11: Global Market Volume (Units) Analysis by Product Type, 2017 to 2032

Figure 12: Global Market Value Share (%) and BPS Analysis by Product Type, 2022 to 2032

Figure 13: Global Market Y-o-Y Growth (%) Projections by Product Type, 2022 to 2032

Figure 14: Global Market Value (US$ Million) Analysis by Material Type, 2017 to 2032

Figure 15: Global Market Volume (Units) Analysis by Material Type, 2017 to 2032

Figure 16: Global Market Value Share (%) and BPS Analysis by Material Type, 2022 to 2032

Figure 17: Global Market Y-o-Y Growth (%) Projections by Material Type, 2022 to 2032

Figure 18: Global Market Value (US$ Million) Analysis by Consumer Orientation, 2017 to 2032

Figure 19: Global Market Volume (Units) Analysis by Consumer Orientation, 2017 to 2032

Figure 20: Global Market Value Share (%) and BPS Analysis by Consumer Orientation, 2022 to 2032

Figure 21: Global Market Y-o-Y Growth (%) Projections by Consumer Orientation, 2022 to 2032

Figure 22: Global Market Value (US$ Million) Analysis by Sales Channel, 2017 to 2032

Figure 23: Global Market Volume (Units) Analysis by Sales Channel, 2017 to 2032

Figure 24: Global Market Value Share (%) and BPS Analysis by Sales Channel, 2022 to 2032

Figure 25: Global Market Y-o-Y Growth (%) Projections by Sales Channel, 2022 to 2032

Figure 26: Global Market Attractiveness by Product Type, 2022 to 2032

Figure 27: Global Market Attractiveness by Material Type, 2022 to 2032

Figure 28: Global Market Attractiveness by Consumer Orientation, 2022 to 2032

Figure 29: Global Market Attractiveness by Sales Channel, 2022 to 2032

Figure 30: Global Market Attractiveness by Region, 2022 to 2032

Figure 31: North America Market Value (US$ Million) by Product Type, 2022 to 2032

Figure 32: North America Market Value (US$ Million) by Material Type, 2022 to 2032

Figure 33: North America Market Value (US$ Million) by Consumer Orientation, 2022 to 2032

Figure 34: North America Market Value (US$ Million) by Sales Channel, 2022 to 2032

Figure 35: North America Market Value (US$ Million) by Country, 2022 to 2032

Figure 36: North America Market Value (US$ Million) Analysis by Country, 2017 to 2032

Figure 37: North America Market Volume (Units) Analysis by Country, 2017 to 2032

Figure 38: North America Market Value Share (%) and BPS Analysis by Country, 2022 to 2032

Figure 39: North America Market Y-o-Y Growth (%) Projections by Country, 2022 to 2032

Figure 40: North America Market Value (US$ Million) Analysis by Product Type, 2017 to 2032

Figure 41: North America Market Volume (Units) Analysis by Product Type, 2017 to 2032

Figure 42: North America Market Value Share (%) and BPS Analysis by Product Type, 2022 to 2032

Figure 43: North America Market Y-o-Y Growth (%) Projections by Product Type, 2022 to 2032

Figure 44: North America Market Value (US$ Million) Analysis by Material Type, 2017 to 2032

Figure 45: North America Market Volume (Units) Analysis by Material Type, 2017 to 2032

Figure 46: North America Market Value Share (%) and BPS Analysis by Material Type, 2022 to 2032

Figure 47: North America Market Y-o-Y Growth (%) Projections by Material Type, 2022 to 2032

Figure 48: North America Market Value (US$ Million) Analysis by Consumer Orientation, 2017 to 2032

Figure 49: North America Market Volume (Units) Analysis by Consumer Orientation, 2017 to 2032

Figure 50: North America Market Value Share (%) and BPS Analysis by Consumer Orientation, 2022 to 2032

Figure 51: North America Market Y-o-Y Growth (%) Projections by Consumer Orientation, 2022 to 2032

Figure 52: North America Market Value (US$ Million) Analysis by Sales Channel, 2017 to 2032

Figure 53: North America Market Volume (Units) Analysis by Sales Channel, 2017 to 2032

Figure 54: North America Market Value Share (%) and BPS Analysis by Sales Channel, 2022 to 2032

Figure 55: North America Market Y-o-Y Growth (%) Projections by Sales Channel, 2022 to 2032

Figure 56: North America Market Attractiveness by Product Type, 2022 to 2032

Figure 57: North America Market Attractiveness by Material Type, 2022 to 2032

Figure 58: North America Market Attractiveness by Consumer Orientation, 2022 to 2032

Figure 59: North America Market Attractiveness by Sales Channel, 2022 to 2032

Figure 60: North America Market Attractiveness by Country, 2022 to 2032

Figure 61: Latin America Market Value (US$ Million) by Product Type, 2022 to 2032

Figure 62: Latin America Market Value (US$ Million) by Material Type, 2022 to 2032

Figure 63: Latin America Market Value (US$ Million) by Consumer Orientation, 2022 to 2032

Figure 64: Latin America Market Value (US$ Million) by Sales Channel, 2022 to 2032

Figure 65: Latin America Market Value (US$ Million) by Country, 2022 to 2032

Figure 66: Latin America Market Value (US$ Million) Analysis by Country, 2017 to 2032

Figure 67: Latin America Market Volume (Units) Analysis by Country, 2017 to 2032

Figure 68: Latin America Market Value Share (%) and BPS Analysis by Country, 2022 to 2032

Figure 69: Latin America Market Y-o-Y Growth (%) Projections by Country, 2022 to 2032

Figure 70: Latin America Market Value (US$ Million) Analysis by Product Type, 2017 to 2032

Figure 71: Latin America Market Volume (Units) Analysis by Product Type, 2017 to 2032

Figure 72: Latin America Market Value Share (%) and BPS Analysis by Product Type, 2022 to 2032

Figure 73: Latin America Market Y-o-Y Growth (%) Projections by Product Type, 2022 to 2032

Figure 74: Latin America Market Value (US$ Million) Analysis by Material Type, 2017 to 2032

Figure 75: Latin America Market Volume (Units) Analysis by Material Type, 2017 to 2032

Figure 76: Latin America Market Value Share (%) and BPS Analysis by Material Type, 2022 to 2032

Figure 77: Latin America Market Y-o-Y Growth (%) Projections by Material Type, 2022 to 2032

Figure 78: Latin America Market Value (US$ Million) Analysis by Consumer Orientation, 2017 to 2032

Figure 79: Latin America Market Volume (Units) Analysis by Consumer Orientation, 2017 to 2032

Figure 80: Latin America Market Value Share (%) and BPS Analysis by Consumer Orientation, 2022 to 2032

Figure 81: Latin America Market Y-o-Y Growth (%) Projections by Consumer Orientation, 2022 to 2032

Figure 82: Latin America Market Value (US$ Million) Analysis by Sales Channel, 2017 to 2032

Figure 83: Latin America Market Volume (Units) Analysis by Sales Channel, 2017 to 2032

Figure 84: Latin America Market Value Share (%) and BPS Analysis by Sales Channel, 2022 to 2032

Figure 85: Latin America Market Y-o-Y Growth (%) Projections by Sales Channel, 2022 to 2032

Figure 86: Latin America Market Attractiveness by Product Type, 2022 to 2032

Figure 87: Latin America Market Attractiveness by Material Type, 2022 to 2032

Figure 88: Latin America Market Attractiveness by Consumer Orientation, 2022 to 2032

Figure 89: Latin America Market Attractiveness by Sales Channel, 2022 to 2032

Figure 90: Latin America Market Attractiveness by Country, 2022 to 2032

Figure 91: Europe Market Value (US$ Million) by Product Type, 2022 to 2032

Figure 92: Europe Market Value (US$ Million) by Material Type, 2022 to 2032

Figure 93: Europe Market Value (US$ Million) by Consumer Orientation, 2022 to 2032

Figure 94: Europe Market Value (US$ Million) by Sales Channel, 2022 to 2032

Figure 95: Europe Market Value (US$ Million) by Country, 2022 to 2032

Figure 96: Europe Market Value (US$ Million) Analysis by Country, 2017 to 2032

Figure 97: Europe Market Volume (Units) Analysis by Country, 2017 to 2032

Figure 98: Europe Market Value Share (%) and BPS Analysis by Country, 2022 to 2032

Figure 99: Europe Market Y-o-Y Growth (%) Projections by Country, 2022 to 2032

Figure 100: Europe Market Value (US$ Million) Analysis by Product Type, 2017 to 2032

Figure 101: Europe Market Volume (Units) Analysis by Product Type, 2017 to 2032

Figure 102: Europe Market Value Share (%) and BPS Analysis by Product Type, 2022 to 2032

Figure 103: Europe Market Y-o-Y Growth (%) Projections by Product Type, 2022 to 2032

Figure 104: Europe Market Value (US$ Million) Analysis by Material Type, 2017 to 2032

Figure 105: Europe Market Volume (Units) Analysis by Material Type, 2017 to 2032

Figure 106: Europe Market Value Share (%) and BPS Analysis by Material Type, 2022 to 2032

Figure 107: Europe Market Y-o-Y Growth (%) Projections by Material Type, 2022 to 2032

Figure 108: Europe Market Value (US$ Million) Analysis by Consumer Orientation, 2017 to 2032

Figure 109: Europe Market Volume (Units) Analysis by Consumer Orientation, 2017 to 2032

Figure 110: Europe Market Value Share (%) and BPS Analysis by Consumer Orientation, 2022 to 2032

Figure 111: Europe Market Y-o-Y Growth (%) Projections by Consumer Orientation, 2022 to 2032

Figure 112: Europe Market Value (US$ Million) Analysis by Sales Channel, 2017 to 2032

Figure 113: Europe Market Volume (Units) Analysis by Sales Channel, 2017 to 2032

Figure 114: Europe Market Value Share (%) and BPS Analysis by Sales Channel, 2022 to 2032

Figure 115: Europe Market Y-o-Y Growth (%) Projections by Sales Channel, 2022 to 2032

Figure 116: Europe Market Attractiveness by Product Type, 2022 to 2032

Figure 117: Europe Market Attractiveness by Material Type, 2022 to 2032

Figure 118: Europe Market Attractiveness by Consumer Orientation, 2022 to 2032

Figure 119: Europe Market Attractiveness by Sales Channel, 2022 to 2032

Figure 120: Europe Market Attractiveness by Country, 2022 to 2032

Figure 121: East Asia Market Value (US$ Million) by Product Type, 2022 to 2032

Figure 122: East Asia Market Value (US$ Million) by Material Type, 2022 to 2032

Figure 123: East Asia Market Value (US$ Million) by Consumer Orientation, 2022 to 2032

Figure 124: East Asia Market Value (US$ Million) by Sales Channel, 2022 to 2032

Figure 125: East Asia Market Value (US$ Million) by Country, 2022 to 2032

Figure 126: East Asia Market Value (US$ Million) Analysis by Country, 2017 to 2032

Figure 127: East Asia Market Volume (Units) Analysis by Country, 2017 to 2032

Figure 128: East Asia Market Value Share (%) and BPS Analysis by Country, 2022 to 2032

Figure 129: East Asia Market Y-o-Y Growth (%) Projections by Country, 2022 to 2032

Figure 130: East Asia Market Value (US$ Million) Analysis by Product Type, 2017 to 2032

Figure 131: East Asia Market Volume (Units) Analysis by Product Type, 2017 to 2032

Figure 132: East Asia Market Value Share (%) and BPS Analysis by Product Type, 2022 to 2032

Figure 133: East Asia Market Y-o-Y Growth (%) Projections by Product Type, 2022 to 2032

Figure 134: East Asia Market Value (US$ Million) Analysis by Material Type, 2017 to 2032

Figure 135: East Asia Market Volume (Units) Analysis by Material Type, 2017 to 2032

Figure 136: East Asia Market Value Share (%) and BPS Analysis by Material Type, 2022 to 2032

Figure 137: East Asia Market Y-o-Y Growth (%) Projections by Material Type, 2022 to 2032

Figure 138: East Asia Market Value (US$ Million) Analysis by Consumer Orientation, 2017 to 2032

Figure 139: East Asia Market Volume (Units) Analysis by Consumer Orientation, 2017 to 2032

Figure 140: East Asia Market Value Share (%) and BPS Analysis by Consumer Orientation, 2022 to 2032

Figure 141: East Asia Market Y-o-Y Growth (%) Projections by Consumer Orientation, 2022 to 2032

Figure 142: East Asia Market Value (US$ Million) Analysis by Sales Channel, 2017 to 2032

Figure 143: East Asia Market Volume (Units) Analysis by Sales Channel, 2017 to 2032

Figure 144: East Asia Market Value Share (%) and BPS Analysis by Sales Channel, 2022 to 2032

Figure 145: East Asia Market Y-o-Y Growth (%) Projections by Sales Channel, 2022 to 2032

Figure 146: East Asia Market Attractiveness by Product Type, 2022 to 2032

Figure 147: East Asia Market Attractiveness by Material Type, 2022 to 2032

Figure 148: East Asia Market Attractiveness by Consumer Orientation, 2022 to 2032

Figure 149: East Asia Market Attractiveness by Sales Channel, 2022 to 2032

Figure 150: East Asia Market Attractiveness by Country, 2022 to 2032

Figure 151: South Asia Market Value (US$ Million) by Product Type, 2022 to 2032

Figure 152: South Asia Market Value (US$ Million) by Material Type, 2022 to 2032

Figure 153: South Asia Market Value (US$ Million) by Consumer Orientation, 2022 to 2032

Figure 154: South Asia Market Value (US$ Million) by Sales Channel, 2022 to 2032

Figure 155: South Asia Market Value (US$ Million) by Country, 2022 to 2032

Figure 156: South Asia Market Value (US$ Million) Analysis by Country, 2017 to 2032

Figure 157: South Asia Market Volume (Units) Analysis by Country, 2017 to 2032

Figure 158: South Asia Market Value Share (%) and BPS Analysis by Country, 2022 to 2032

Figure 159: South Asia Market Y-o-Y Growth (%) Projections by Country, 2022 to 2032

Figure 160: South Asia Market Value (US$ Million) Analysis by Product Type, 2017 to 2032

Figure 161: South Asia Market Volume (Units) Analysis by Product Type, 2017 to 2032

Figure 162: South Asia Market Value Share (%) and BPS Analysis by Product Type, 2022 to 2032

Figure 163: South Asia Market Y-o-Y Growth (%) Projections by Product Type, 2022 to 2032

Figure 164: South Asia Market Value (US$ Million) Analysis by Material Type, 2017 to 2032

Figure 165: South Asia Market Volume (Units) Analysis by Material Type, 2017 to 2032

Figure 166: South Asia Market Value Share (%) and BPS Analysis by Material Type, 2022 to 2032

Figure 167: South Asia Market Y-o-Y Growth (%) Projections by Material Type, 2022 to 2032

Figure 168: South Asia Market Value (US$ Million) Analysis by Consumer Orientation, 2017 to 2032

Figure 169: South Asia Market Volume (Units) Analysis by Consumer Orientation, 2017 to 2032

Figure 170: South Asia Market Value Share (%) and BPS Analysis by Consumer Orientation, 2022 to 2032

Figure 171: South Asia Market Y-o-Y Growth (%) Projections by Consumer Orientation, 2022 to 2032

Figure 172: South Asia Market Value (US$ Million) Analysis by Sales Channel, 2017 to 2032

Figure 173: South Asia Market Volume (Units) Analysis by Sales Channel, 2017 to 2032

Figure 174: South Asia Market Value Share (%) and BPS Analysis by Sales Channel, 2022 to 2032

Figure 175: South Asia Market Y-o-Y Growth (%) Projections by Sales Channel, 2022 to 2032

Figure 176: South Asia Market Attractiveness by Product Type, 2022 to 2032

Figure 177: South Asia Market Attractiveness by Material Type, 2022 to 2032

Figure 178: South Asia Market Attractiveness by Consumer Orientation, 2022 to 2032

Figure 179: South Asia Market Attractiveness by Sales Channel, 2022 to 2032

Figure 180: South Asia Market Attractiveness by Country, 2022 to 2032

Figure 181: Oceania Market Value (US$ Million) by Product Type, 2022 to 2032

Figure 182: Oceania Market Value (US$ Million) by Material Type, 2022 to 2032

Figure 183: Oceania Market Value (US$ Million) by Consumer Orientation, 2022 to 2032

Figure 184: Oceania Market Value (US$ Million) by Sales Channel, 2022 to 2032

Figure 185: Oceania Market Value (US$ Million) by Country, 2022 to 2032

Figure 186: Oceania Market Value (US$ Million) Analysis by Country, 2017 to 2032

Figure 187: Oceania Market Volume (Units) Analysis by Country, 2017 to 2032

Figure 188: Oceania Market Value Share (%) and BPS Analysis by Country, 2022 to 2032

Figure 189: Oceania Market Y-o-Y Growth (%) Projections by Country, 2022 to 2032

Figure 190: Oceania Market Value (US$ Million) Analysis by Product Type, 2017 to 2032

Figure 191: Oceania Market Volume (Units) Analysis by Product Type, 2017 to 2032

Figure 192: Oceania Market Value Share (%) and BPS Analysis by Product Type, 2022 to 2032

Figure 193: Oceania Market Y-o-Y Growth (%) Projections by Product Type, 2022 to 2032

Figure 194: Oceania Market Value (US$ Million) Analysis by Material Type, 2017 to 2032

Figure 195: Oceania Market Volume (Units) Analysis by Material Type, 2017 to 2032

Figure 196: Oceania Market Value Share (%) and BPS Analysis by Material Type, 2022 to 2032

Figure 197: Oceania Market Y-o-Y Growth (%) Projections by Material Type, 2022 to 2032

Figure 198: Oceania Market Value (US$ Million) Analysis by Consumer Orientation, 2017 to 2032

Figure 199: Oceania Market Volume (Units) Analysis by Consumer Orientation, 2017 to 2032

Figure 200: Oceania Market Value Share (%) and BPS Analysis by Consumer Orientation, 2022 to 2032

Figure 201: Oceania Market Y-o-Y Growth (%) Projections by Consumer Orientation, 2022 to 2032

Figure 202: Oceania Market Value (US$ Million) Analysis by Sales Channel, 2017 to 2032

Figure 203: Oceania Market Volume (Units) Analysis by Sales Channel, 2017 to 2032

Figure 204: Oceania Market Value Share (%) and BPS Analysis by Sales Channel, 2022 to 2032

Figure 205: Oceania Market Y-o-Y Growth (%) Projections by Sales Channel, 2022 to 2032

Figure 206: Oceania Market Attractiveness by Product Type, 2022 to 2032

Figure 207: Oceania Market Attractiveness by Material Type, 2022 to 2032

Figure 208: Oceania Market Attractiveness by Consumer Orientation, 2022 to 2032

Figure 209: Oceania Market Attractiveness by Sales Channel, 2022 to 2032

Figure 210: Oceania Market Attractiveness by Country, 2022 to 2032

Figure 211: MEA Market Value (US$ Million) by Product Type, 2022 to 2032

Figure 212: MEA Market Value (US$ Million) by Material Type, 2022 to 2032

Figure 213: MEA Market Value (US$ Million) by Consumer Orientation, 2022 to 2032

Figure 214: MEA Market Value (US$ Million) by Sales Channel, 2022 to 2032

Figure 215: MEA Market Value (US$ Million) by Country, 2022 to 2032

Figure 216: MEA Market Value (US$ Million) Analysis by Country, 2017 to 2032

Figure 217: MEA Market Volume (Units) Analysis by Country, 2017 to 2032

Figure 218: MEA Market Value Share (%) and BPS Analysis by Country, 2022 to 2032

Figure 219: MEA Market Y-o-Y Growth (%) Projections by Country, 2022 to 2032

Figure 220: MEA Market Value (US$ Million) Analysis by Product Type, 2017 to 2032

Figure 221: MEA Market Volume (Units) Analysis by Product Type, 2017 to 2032

Figure 222: MEA Market Value Share (%) and BPS Analysis by Product Type, 2022 to 2032

Figure 223: MEA Market Y-o-Y Growth (%) Projections by Product Type, 2022 to 2032

Figure 224: MEA Market Value (US$ Million) Analysis by Material Type, 2017 to 2032

Figure 225: MEA Market Volume (Units) Analysis by Material Type, 2017 to 2032

Figure 226: MEA Market Value Share (%) and BPS Analysis by Material Type, 2022 to 2032

Figure 227: MEA Market Y-o-Y Growth (%) Projections by Material Type, 2022 to 2032

Figure 228: MEA Market Value (US$ Million) Analysis by Consumer Orientation, 2017 to 2032

Figure 229: MEA Market Volume (Units) Analysis by Consumer Orientation, 2017 to 2032

Figure 230: MEA Market Value Share (%) and BPS Analysis by Consumer Orientation, 2022 to 2032

Figure 231: MEA Market Y-o-Y Growth (%) Projections by Consumer Orientation, 2022 to 2032

Figure 232: MEA Market Value (US$ Million) Analysis by Sales Channel, 2017 to 2032

Figure 233: MEA Market Volume (Units) Analysis by Sales Channel, 2017 to 2032

Figure 234: MEA Market Value Share (%) and BPS Analysis by Sales Channel, 2022 to 2032

Figure 235: MEA Market Y-o-Y Growth (%) Projections by Sales Channel, 2022 to 2032

Figure 236: MEA Market Attractiveness by Product Type, 2022 to 2032

Figure 237: MEA Market Attractiveness by Material Type, 2022 to 2032

Figure 238: MEA Market Attractiveness by Consumer Orientation, 2022 to 2032

Figure 239: MEA Market Attractiveness by Sales Channel, 2022 to 2032

Figure 240: MEA Market Attractiveness by Country, 2022 to 2032

Recommendations

Consumer Product

Gym Apparel Market

Published : March 2024

Consumer Product

Secondhand Apparel Market

Published : February 2024

Consumer Product

Rugby Apparel Market

Published : July 2022

Consumer Product

Sequins Apparels Market

Published : September 2021

Explore Consumer Product Insights

View Reports