Rugby Apparel Market
Rugby Apparel has a Separate Fan Base. FMI’s Latest Report Finds Facts
Rugby Apparel Market by Type & Region - Forecast 2022-2032
Rugby Apparel Market Snapshot (2022-2032)
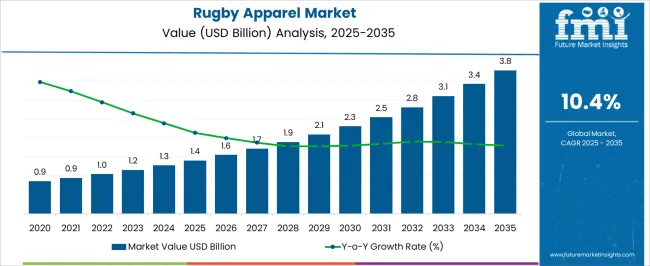
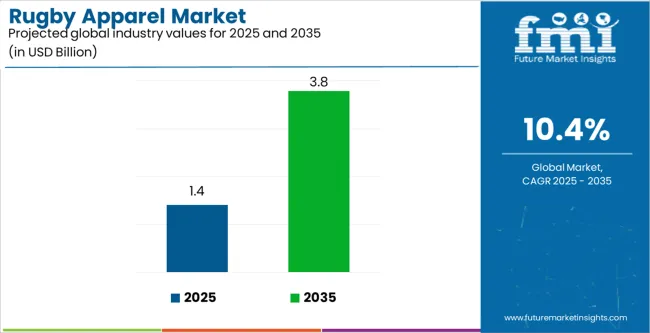
[300 Pages Report] The global rugby apparel market is projected to expand steadily at a CAGR 11.3% value, during the forecast period 2022-2032. In the year 2022, the market is projected to gain a market valuation of US$ 1,022.85 Million. Considering the rising demand in the global market, the rugby apparel market is expected to reach US$ 2,984 Million by 2032.
Data Points |
Key Statistics |
Global Growth Rate (2022-2032) |
11.3% CAGR |
Rugby Apparel Market Value 2022 |
US$ 1,022.85 Million |
Rugby Apparel Market Projected Value (2032) |
US$ 2,984 Million |
Rugby is one of the most violent contact sports in which a person may participate. In comparison to other similar games such as football, rugby players typically wear a specific sort of gear. Rugby apparel is the clothing worn by rugby players. It usually consists of T-shirts, hoodies, singlets, jackets, shorts, and other items. A rugby shirt is used in the popular sport of rugby. Long sleeves are commonly worn. Rugby jerseys are traditionally designed with five or six horizontal stripes or 'hoops' in alternating colors. Rugby jerseys vary according to the type of rugby game played.
Children who begin learning a game at an early age have a strong interest in that game and are more likely to pursue it as a career. Thus, children participating in any sport, such as rugby, enhance the need for rugby apparel because these activities require appropriate attire, which is projected to promote market growth in the long run.
With the increase in the number of rugby tournaments, the global acceptance of rugby apparel has increased, propelling the entire industry. Furthermore, an increase in the number of tournaments and games, as well as increased sponsorships and partnerships for rugby apparel to be worn in the game, will drive market growth throughout the projection period. Consumers' increased focus on environmentally friendly materials to maintain consumer comfort, as well as their increasing transition toward sustainable rugby apparel, is boosting product demand and thus market expansion.
Let us know your requirement to get
100% FREE customization
2017-2021 Rugby Apparel Demand Analysis vs. Forecast 2022-2032
According to Future Market Insights- the market for rugby apparel reflected a value CAGR worth 9.5% during the historical period, 2017-2021. The COVID-19 pandemic had a significant impact on several sports brands around the world, including the rugby apparel sector. The apparel manufacturing businesses around the world were shut down, as were the distribution systems, halting the supply and sale of rugby apparel. Furthermore, all sporting events around the world were canceled due to government guidelines and restrictions aimed at preventing the spread of COVID and ensuring the public's safety. This has a large scale impact on the rugby apparels market, especially during 2020.
However, with the lifting of such prohibitions, sports activities restarted, resuming the purchase of such things. Eventually, several competitions for men and women players began to take place. Since the restrictions were lifted, a number of events have taken place, including the England Autumn Internationals 2021, the HSBC World Rugby Sevens Series, the women's Six Nations Rugby Championship, and the men's Summer Internationals. As a result of its popularity, the market is likely to expand over the forecast period.
Rugby apparel, on the other hand, gives ease of movement and comfort, as well as moisture control, which is expanding their utilization and supporting market expansion. Athletes are opting for additional materials that are enhanced and comfortable. Furthermore, the growing number of educational institutions, such as schools and colleges, which offer rugby as a key sport activity for students to participate in is anticipated to drive the market. This has resulted in higher jersey purchases by school and college athletes, raising market demand for rugby apparels during the projection period.
Prominent Growth Drivers Influencing Rugby Apparel Industry
Increasing women’s participation will augment demand in Future
A major aspect boosting the market's growth is the increased participation of women in rugby. Increasing championships in women’s rugby is going to propel the demand of the rugby apparels during the forecast period.
World Rugby launched the global campaign 'Try and Stop Us' in 2017 to increase participation in the women's game. Similarly, World Rugby and its member unions launched the 'Get into Rugby' campaign in 2013 to promote easy entry to rugby for women and girls. As a result of such activities, the number of registered female players has surged by 28% from 2017 to 2.7 million.
The Women's Six Nations Championship is another popular rugby tournament between the women's national teams of England, Ireland, France, Italy, Scotland, and Wales. England has won 17 of the 26 tournaments, including the most recent in 2021. Furthermore, rising investment in women's rugby and expanding rugby's global reach can provide the market with a profitable growth opportunity.
Comfortable Material is catching the eye of Athletes for enhanced Mobility
Rugby apparels are generally made of a Dri- Fit material that is lightweight and comfortable. Dri-Fit rugby shirts and clothing are frequently associated with sports such as rugby. This is due to its natural property, which contributes to improving the wearer's performance. These shirts are typically made of synthetic and lightweight fabrics in order to improve the athlete's flexibility and sporting activities. As a result, it's no surprise that most athletes go for this style of clothing for training and daily activities.
Furthermore, because of their natural moisture-wicking quality, these garments are chosen above other cotton T-shirts. This would be useful on a hot day or when traveling to warmer places to play and practice, as these shirts will help the players to sweat less. Furthermore, they aid in sweating less after each workout, making customers feel more at ease with themselves.
A good Dri-Fit shirt or clothes can keep the player's body cool on a hot or humid day thanks to its well-tailored ventilation technology. Some of these clothing also provide good UV protection since they cover the skin well under the direct sunlight. Thus, the association of these attractive characteristic features of the materials is going to accelerate the demand of rugby apparels among the players globally.
Find your sweet spots for generating winning opportunities in this market.
Talk to AnalystWhat could possibly hinder Rugby Apparel Deployment?
Anti-sweatshop promises can make brands Tumble Down
The growing anti-sweatshop initiatives are one of the major hurdles to the global rugby apparel market's growth. Nike previously launched an anti-sweatshop campaign after the firm's labor practices were uncovered, exposing the company guilty in public. Once the report on the terrible working conditions was published, the company's reputation suffered as a result of the poor working conditions in its manufacturing factories in China, Indonesia, and Vietnam.
Lower salaries, poor working conditions, and a loss of brand image and consumer base are among issues addressed in anti-sweatshop campaigns. Anti-sweatshop efforts can also have a negative impact on business stock values, which in turn affects vendor sales, limiting market growth in the forecast period. Furthermore, rugby is still considered as a niche sport for a large population, which is projected to impede market growth throughout the projection period. Furthermore, limited commercial exposure for these products is projected to stymie market expansion in the future years.
Category-wise Insights
Which product type is forecast to gain the maximum market share?
Upper Wear to be sought after for its comfort and dry-fit features
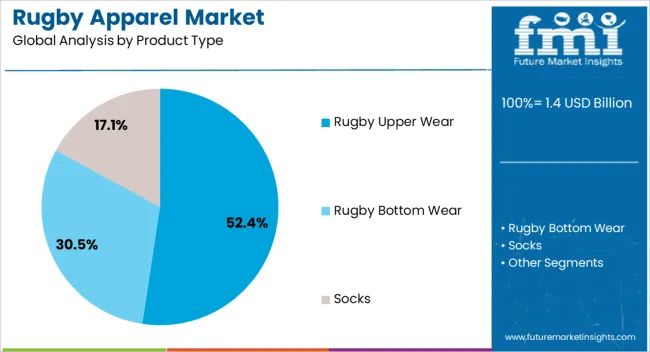
The upper wear segment dominated the market in 2021 and is expected to hold the largest revenue share of 51% in 2022. At the same time, this segment is expected to witness the fastest CAGR of 11.8% over the forecast period.
The growth and domination of the upper wear segment for rugby apparels can be linked to the widespread use of rugby upper wear clothing such as jerseys, shirts, and others since they are comfortable, breathable and can be worn in any situation. The availability of upper wear with a lighter feel aids in sweat management, and aerodynamic clothing is in high demand, adding to market growth throughout the projection period.
Rugby players require clothing that lowers fluid loss when sweating and promotes cooling while playing, which drives the use of such clothing. These clothing wick away perspiration, keeping them cool and allowing them to focus on their performance. Furthermore, given rugby is a tough game, the availability, high demand, and usage of high-performance rugby upper wear apparel that is strong and durable is likely to add to segment growth in the approaching years.
Demand for bottom wear to experience high growth in the Forecast Period
The bottom wear category is predicted to increase rapidly between 2022 and 2032. Due to its increasing use among athletes, the bottom wear segment is predicted to develop at a strong CAGR of 10.3%. Rugby bottom wear is designed to endure the wear and tear involved with the tough game of rugby because it is sturdy and less elastic than other varieties of bottom wear. Rugby bottom wear improves mobility and agility, allowing players to move fast and bring the ball into space while playing these games.
These bottoms also assist players stay cool in hot conditions and allow them to breathe more easily. Furthermore, bottom gear, such as shorts, does not block other players' view and protects them from injury. Thus, bottom wear usage is expanding as a result of the aforementioned issues, contributing to segment growth during the forecast period.

A unified Market Research Subscription Platform, built for today's disparate research needs.
Region-wise Analysis
What is the Outlook of the North American Rugby Apparel Market?
Increasing Participation in Sporting Events widening sales of Rugby Apparel
In terms of market share and revenue, the North American market is predicted to grow steadily between 2022 and 2032. Future Market Insights analysts predict that by 2032, the North American market will grow at a CAGR of 11%. This region is gaining significance due to the increasing number of players turning towards this sport.
Rugby in the United States is a fast growing sport in the nation. Rugby at the youth, high school, college, amateur club, professional, and international levels is governed by USA Rugby. There are over 128,000 players registered with USA Rugby as of 2019. Over 2,600 rugby union clubs exist around the country, including those of whom are part of college rugby. Professional club competition has existed as Major League Rugby since 2017. Such events are going to increase the sales of rugby apparels during the forecast period.
In addition, numerous more high-profile rugby competitions are being conducted in the United States. The USA Sevens is an international competition that takes place in February and attracts over 60,000 spectators. Every June, the United States national team hosts international matches in front of an estimated 20,000 fans. The Collegiate Rugby Championship is held in June in the Philadelphia suburb of Chester, Pennsylvania, and attracts approximately 20,000 supporters. Thus, with the increasing number of games and events, the demand for rugby apparels is expected to increase significantly during the forecast period.
How are Rugby Apparel Sales faring in the Asia Pacific?
Increased fan base post 2019 World Cup event is expected to bolster demand
Asia Pacific is predicted to increase steadily over the forecast period. During the projection period, 2022-2023, it is expected to grow at a CAGR of 11.1%. The segment's expansion can be ascribed to the region's growing rugby fan base, particularly in India and China. The shorter version of the game is attracting new and youthful fans all around the world, resulting in an increase in the use and adoption of rugby apparel.
According to the World's Rugby report, Asia alone had a 34% increase in participation numbers, with 1,018,886 people playing rugby in 2020. Following the Rugby World Cup 2019 in Japan, rugby popularity in the country has quadrupled, with the number of ardent supporters increasing by 139% in 2020.
Rugby's popularity in the region has expanded further as a result of the recently held Rugby World Cup in 2019, which was hosted in Japan, generating strong interest in rugby and ultimately driving demand in the rugby apparel market for North America.
What is the Outlook of the European Rugby Apparel market during the forecast period?
Rising number of events in the region will accelerate the demand
In 2021, Europe dominated the global rugby apparel market. This market is estimated to have the highest revenue share of 41% in 2022. Over the projected period, the area is also expected to register a CAGR of 12.2%.
England, France, Italy, Ireland, and Germany are among the top European countries with the most active rugby players. The competitive environment produced by enterprises in the region is a key element driving the growth of the European rugby apparel market. Furthermore, the growing number of events taking place in this region is fueling market demand. Europe hosted the Rugby Six Nations championship in six areas across Europe in 2022.
Furthermore, the growing participation of female rugby professionals is adding to the market's expansion. To increase participation, the region has promoted a number of women's events, such as the Women's Rugby Europe Championship 2022. Furthermore, the presence of a large number of important companies operating in the region is fueling market expansion.
Start-up scenario
Some of the top start-ups in this market include: Tribesports, 3RD ROCK Clothing, Front Up Rugby, NEU Apparel, So We Flow, Pulsate.
- Tribesports is a performance apparel brand located in the United Kingdom. It is attempting to build the brand through the use of digital and social internet technologies. It also includes a social community platform where customers can seek guidance and ideas from other athletes. They can also find and create new sports and training goals by participating in challenges, either scheduled events or general sports challenges, and drawing inspiration from those on the website to do more in sports.
- 3RD Rock is an online-only activewear company. Sweatshirts, vests, leggings, t-shirts, shorts, and other items are available. Its entire product line is made from organic cotton and recyclable pre-loved fabrics and fibres. It prints with water-based, phthalate-free OekoTex inks. For all orders over £75, it offers worldwide delivery options. In addition to its web platform, its products are sold through linked online and offline businesses.
Competitive Landscape
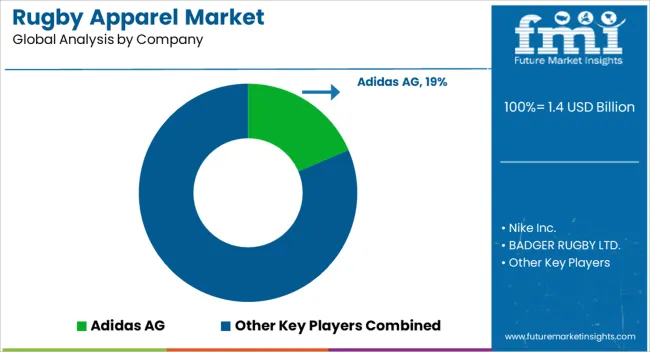
With global competitors pursuing product innovation strategies, the market is highly fragmented and competitive. Key industry participants are taking a variety of initiatives to strengthen their market presence. These processes include strategies like mergers, collaborations, and acquisitions, as well as unique product creation and launch, global expansion, and others.
- Nike frequently makes use of social media channels to improve brand visibility, which also helps to increase product sales volume. The seller also promotes on these channels to spread social messages about women's empowerment and sports involvement.
- Canterbury, Irish Rugby's official kit partner, revealed the New Ireland Rugby Home Jersey in 2022, which will be worn by the Men's and Women's teams during the 2022/23 season, as well as a range of training apparel for all followers of the game. As both the Men's and Women's teams prepare for critical test matches this summer, the design of this year's shirt celebrates the power and solidarity of Irish players, fans, and supporters against strong opponents.
Report Scope
Report Attribute |
Details |
Growth Rate |
CAGR of 11.3% from 2022 to 2032 |
Market Value for 2022 |
US$ 1,022.85 Million |
Market Value for 2032 |
US$ 2,984 Million |
Base Year for Estimation |
2021 |
Historical Data |
2017-2021 |
Forecast Period |
2022-2032 |
Quantitative Units |
USD$ Million for Value |
Report Coverage |
Revenue Forecast, Company Ranking, Competitive Landscape, Growth Factors, Trends and Pricing Analysis |
Segments Covered |
|
Regions Covered |
|
Key Countries Profiled |
|
Key Companies Profiled |
|
Report Customization & Pricing |
Available upon Request |
Key Segments Covered in the Rugby Apparel Market Report
Rugby Apparel Market by Type:
- Rugby Upper Wear
- Rugby Bottom Wear
- Rugby Socks
Rugby Apparel Market by Region:
- North America Rugby Apparel Market
- Latin America Rugby Apparel Market
- Europe Rugby Apparel Market
- Asia Pacific Rugby Apparel Market
- Middle East & Africa Rugby Apparel Market
Frequently Asked Questions
At what rate did the rugby apparel market flourish from 2017-2021?
From 2017-2021, the rugby apparel market grew at a CAGR of 9.5%
What is the future outlook of the global rugby apparel market during the forecast period?
The global rugby apparel market is expected to grow with an 11.3% CAGR and gain a global market valuation of US$ 2,984 Million by 2032
Which segment is expected to dominate the global rugby apparel market during 2022?
In 2022, the upper wear segment by product type is expected to dominate the global market with a market share of 51% and CAGR of 11.8% during 2022-2032
What will be the outlook of the other types of rugby apparel during the forecast period?
The bottom wear segment is expected to grow with a 10.3% CAGR during 2022-2032
How is the European rugby apparel market projected to grow in 2022?
The European rugby apparel market is expected to hold a 41% global market share in 2022 and develop with a CAGR of 12.2% during the forecast period
What was the outlook of the APAC rugby apparel market during 2022?
The APAC region is expected to grow steadily with a CAGR of 11% during 2022-2032.
Table of Content
1. Executive Summary 1.1. Global Market Snapshot 1.2. Key Market Trends 1.3. Current Market & Future Potential 1.4. Fact.MR Recommendation 2. Market Overview 2.1. Market Segmentation 2.2. Market Indicators 2.3. Market Definitions 2.4. Market Dynamics 2.4.1. Drivers 2.4.2. Restraints 2.4.3. Opportunities 2.5. Porter’s Five Forces Analysis 2.6. Value Chain Analysis 2.6.1. List of Potential Customers 2.7. Global Market Analysis and Forecast, 2022-2032 3. Market Outlook, by Region 4. Market Trend Analysis, 2022-2032 4.1. Type 4.2. By Region 5. Global Market Analysis and Forecast, by Type, 2022-2032 5.1. Introduction & Definitions 5.2. Global Market Value (Mn) Forecast, by Type, 2022-2032 5.2.1. Upper Wear 5.2.2. Bottom Wear 5.2.3. Socks 5.3. Global Market Attractiveness, by Type 6. Global Market Analysis and Forecast, by Region, 2022-2032 6.1. Key Findings 6.2. Global Market Value (Mn) Forecast, by Region, 2022-2032 6.2.1. North America 6.2.2. Europe 6.2.3. Asia Pacific 6.2.4. Middle East & Africa 6.2.5. Latin America 6.3. Global Market Attractiveness, by Region 7. North America Market Analysis and Forecast, 2022-2032 7.1. Key Findings 7.2. North America Market Value (Mn) Forecast, by Type, 2022-2032 7.3. North America Market Value (Mn) Analysis, 2022-2032 7.3.1. U.S. Market Value (Mn) Forecast, by Type, 2022-2032 7.3.2. U.S. Market Value (Mn) Analysis, 2022-2032 7.3.3. Canada Market Value (Mn) Forecast, by Type, 2022-2032 7.3.4. Canada Market Value (Mn) Analysis, 2022-2032 7.4. North America Market Attractiveness Analysis 8. Europe Market Analysis and Forecast, 2022-2032 8.1. Key Findings 8.2. Europe Market Value (Mn) Forecast, by Type, 2022-2032 8.3. Europe Market Value (Mn) Analysis, 2022-2032 8.3.1. Germany Market Value (Mn) Forecast, by Type, 2022-2032 8.3.2. Germany Market Value (Mn) Analysis, 2022-2032 8.3.3. France Market Value (Mn) Forecast, by Type, 2022-2032 8.3.4. France Market Value (Mn) Analysis, 2022-2032 8.3.5. U.K. Market Value (Mn) Forecast, by Type, 2022-2032 8.3.6. U.K. Market Value (Mn) Analysis, 2022-2032 8.3.7. Italy Market Value (Mn) Forecast, by Type, 2022-2032 8.3.8. Italy Market Value (Mn) Analysis, 2022-2032 8.3.9. Rest of Europe Market Value (Mn) Forecast, by Type, 2022-2032 8.3.10. Rest of Europe Market Value (Mn) Analysis, 2022-2032 8.4. Europe Market Attractiveness Analysis 9. Asia Pacific Market Analysis and Forecast, 2022-2032 9.1. Key Findings 9.2. Asia Pacific Market Value (Mn) Forecast, by Type, 2022-2032 9.3. Asia Pacific Market Value (Mn) Analysis, 2022-2032 9.3.1. China Market Value (Mn) Forecast, by Type, 2022-2032 9.3.2. China Market Value (Mn) Analysis, 2022-2032 9.3.3. India Market Value (Mn) Forecast, by Type, 2022-2032 9.3.4. India Market Value (Mn) Analysis, 2022-2032 9.3.5. Japan Market Value (Mn) Forecast, by Type, 2022-2032 9.3.6. Japan Market Value (Mn) Analysis, 2022-2032 9.3.7. ASEAN Market Value (Mn) Forecast, by Type, 2022-2032 9.3.8. ASEAN Market Value (Mn) Analysis, 2022-2032 9.3.9. Rest of Asia Pacific Market Value (Mn) Forecast, by Type, 2022-2032 9.3.10. Rest of Asia Pacific Market Value (Mn) Analysis, 2022-2032 9.4. Asia Pacific Market Attractiveness Analysis 10. Latin America Market Analysis and Forecast, 2022-2032 10.1. Key Findings 10.2. Latin America Market Value (Mn) Forecast, by Type, 2022-2032 10.3. Latin America Market Value (Mn) Analysis, 2022-2032 10.3.1. Brazil Market Value (Mn) Forecast, by Type, 2022-2032 10.3.2. Brazil Market Value (Mn) Analysis, 2022-2032 10.3.3. Mexico Market Value (Mn) Forecast, by Type, 2022-2032 10.3.4. Mexico Market Value (Mn) Analysis, 2022-2032 10.3.5. Rest of Latin America Market Value (Mn) Forecast, by Type, 2022-2032 10.3.6. Rest of Latin America Market Value (Mn) Analysis, 2022-2032 10.4. Latin America Market Attractiveness Analysis 11. Middle East & Africa Market Analysis and Forecast, 2022-2032 11.1. Key Findings 11.2. Middle East & Africa Market Value (Mn) Forecast, by Type, 2022-2032 11.3. Middle East & Africa Market Value (Mn) Analysis, 2022-2032 11.3.1. GCC Market Value (Mn) Forecast, by Type, 2022-2032 11.3.2. GCC Market Value (Mn) Analysis, 2022-2032 11.3.3. South Africa Market Value (Mn) Forecast, by Type, 2022-2032 11.3.4. South Africa Market Value (Mn) Analysis, 2022-2032 11.3.5. Rest of Middle East & Africa Market Value (Mn) Forecast, by Type, 2022-2032 11.3.6. Rest of Middle East & Africa Market Value (Mn) Analysis, 2022-2032 11.4. Middle East & Africa Market Attractiveness Analysis 12. Competition Landscape 12.1. Global Market Share Analysis, by Company (2020) 12.2. Competition Matrix 12.2.1. Type Mapping 12.3. Company Profiles (Details – Overview, Financials, Recent Developments, and Strategy) 12.3.1. Adidas AG 12.3.1.1. Headquarters, Year of Establishment, Revenue, Key Management, Number of Employees 12.3.1.2. Company Description 12.3.1.3. Business Overview 12.3.1.4. Financial Overview 12.3.1.5. Strategic Overview 12.3.2. Nike Inc. 12.3.2.1. Headquarters, Year of Establishment, Revenue, Key Management, Number of Employees 12.3.2.2. Company Description 12.3.2.3. Business Overview 12.3.2.4. Financial Overview 12.3.2.5. Strategic Overview 12.3.3. BADGER RUGBY LTD. 12.3.3.1. Headquarters, Year of Establishment, Revenue, Key Management, Number of Employees 12.3.3.2. Company Description 12.3.3.3. Business Overview 12.3.3.4. Financial Overview 12.3.3.5. Strategic Overview 12.3.4. Canterbury 12.3.4.1. Headquarters, Year of Establishment, Revenue, Key Management, Number of Employees 12.3.4.2. Company Description 12.3.4.3. Business Overview 12.3.4.4. Financial Overview 12.3.4.5. Strategic Overview 12.3.5. KOOGA 12.3.5.1. Headquarters, Year of Establishment, Revenue, Key Management, Number of Employees 12.3.5.2. Company Description 12.3.5.3. Business Overview 12.3.5.4. Financial Overview 12.3.5.5. Strategic Overview 12.3.6. Decathlon SA 12.3.6.1. Headquarters, Year of Establishment, Revenue, Key Management, Number of Employees 12.3.6.2. Company Description 12.3.6.3. Business Overview 12.3.6.4. Financial Overview 12.3.6.5. Strategic Overview 12.3.7. Gilburt Rugby 12.3.7.1. Headquarters, Year of Establishment, Revenue, Key Management, Number of Employees 12.3.7.2. Company Description 12.3.7.3. Business Overview 12.3.7.4. Financial Overview 12.3.7.5. Strategic Overview 12.3.8. MACRON S.P.A 12.3.8.1. Headquarters, Year of Establishment, Revenue, Key Management, Number of Employees 12.3.8.2. Company Description 12.3.8.3. Business Overview 12.3.8.4. Financial Overview 12.3.8.5. Strategic Overview 12.3.9. O’Neills Irish International Sports Co. Ltd. 12.3.9.1. Headquarters, Year of Establishment, Revenue, Key Management, Number of Employees 12.3.9.2. Company Description 12.3.9.3. Business Overview 12.3.9.4. Financial Overview 12.3.9.5. Strategic Overview 12.3.10. Olympus Rugby 12.3.10.1. Headquarters, Year of Establishment, Revenue, Key Management, Number of Employees 12.3.10.2. Company Description 12.3.10.3. Business Overview 12.3.10.4. Financial Overview 12.3.10.5. Strategic Overview 13. Assumptions & Acronyms Used 14. Research Methodology
Let us know your requirement to get
100% FREE customization
List of Tables
Table 1: Global Market Value (Mn) Forecast, by Type, 2022-2032 Table 2: Global Market Value (Mn) Forecast, by Type, 2022-2032 Table 3: Global Market Value (Mn) Analysis, 2022-2032 Table 4: Global Market Value (Mn) Analysis, 2022-2032 Table 5: Global Market Value (Mn) Forecast, by Region, 2022-2032 Table 6: Global Market Value (Mn) Forecast, by Region, 2022-2032 Table 7: North America Market Value (Mn) Forecast, by Type, 2022-2032 Table 8: North America Market Value (Mn) Forecast, by Type, 2022-2032 Table 9: North America Market Value (Mn) Analysis, 2022-2032 Table 10: North America Market Value (Mn) Analysis, 2022-2032 Table 11: North America Market Value (Mn) Forecast, by Country, 2022-2032 Table 12: North America Market Value (Mn) Forecast, by Country, 2022-2032 Table 13: U.S. Market Value (Mn) Forecast, by Type, 2022-2032 Table 14: U.S. Market Value (Mn) Forecast, by Type, 2022-2032 Table 15: U.S. Market Value (Mn) Analysis, 2022-2032 Table 16: U.S. Market Value (Mn) Analysis, 2022-2032 Table 17: Canada Market Value (Mn) Forecast, by Type, 2022-2032 Table 18: Canada Market Value (Mn) Forecast, by Type, 2022-2032 Table 19: Canada Market Value (Mn) Analysis, 2022-2032 Table 20: Canada Market Value (Mn) Analysis, 2022-2032 Table 21: Europe Market Value (Mn) Forecast, by Type, 2022-2032 Table 22: Europe Market Value (Mn) Forecast, by Type, 2022-2032 Table 23: Europe Market Value (Mn) Analysis, 2022-2032 Table 24: Europe Market Value (Mn) Analysis, 2022-2032 Table 25: Europe Market Value (Mn) Forecast, by Country and Sub-region, 2022-2032 Table 26: Europe Market Value (Mn) Forecast, by Country and Sub-region, 2022-2032 Table 27: Germany Market Value (Mn) Forecast, by Type, 2022-2032 Table 28: Germany Market Value (Mn) Forecast, by Type, 2022-2032 Table 29: Germany Market Value (Mn) Analysis, 2022-2032 Table 30: Germany Market Value (Mn) Analysis, 2022-2032 Table 31: U.K. Market Value (Mn) Forecast, by Type, 2022-2032 Table 32: U.K. Market Value (Mn) Forecast, by Type, 2022-2032 Table 33: U.K. Market Value (Mn) Analysis, 2022-2032 Table 34: U.K. Market Value (Mn) Analysis, 2022-2032 Table 35: France Market Value (Mn) Forecast, by Type, 2022-2032 Table 36: France Market Value (Mn) Forecast, by Type, 2022-2032 Table 37: France Market Value (Mn) Analysis, 2022-2032 Table 38: France Market Value (Mn) Analysis, 2022-2032 Table 39: Italy Market Value (Mn) Forecast, by Type, 2022-2032 Table 40: Italy Market Value (Mn) Forecast, by Type, 2022-2032 Table 41: Italy Market Value (Mn) Analysis, 2022-2032 Table 42: Italy Market Value (Mn) Analysis, 2022-2032 Table 43: Spain Market Value (Mn) Forecast, by Type, 2022-2032 Table 44: Spain Market Value (Mn) Forecast, by Type, 2022-2032 Table 45: Spain Market Value (Mn) Analysis, 2022-2032 Table 46: Spain Market Value (Mn) Analysis, 2022-2032 Table 47: Russia & CIS Market Value (Mn) Forecast, by Type, 2022-2032 Table 48: Russia & CIS Market Value (Mn) Forecast, by Type, 2022-2032 Table 49: Russia & CIS Market Value (Mn) Analysis, 2022-2032 Table 50: Russia & CIS Market Value (Mn) Analysis, 2022-2032 Table 51: Rest of Europe Market Value (Mn) Forecast, by Type, 2022-2032 Table 52: Rest of Europe Market Value (Mn) Forecast, by Type, 2022-2032 Table 53: Rest of Europe Market Value (Mn) Analysis, 2022-2032 Table 54: Rest of Europe Market Value (Mn) Analysis, 2022-2032 Table 55: Asia Pacific Market Value (Mn) Forecast, by Type, 2022-2032 Table 56: Asia Pacific Market Value (Mn) Forecast, by Type, 2022-2032 Table 57: Asia Pacific Market Value (Mn) Analysis, 2022-2032 Table 58: Asia Pacific Market Value (Mn) Analysis, 2022-2032 Table 59: Asia Pacific Market Value (Mn) Forecast, by Country and Sub-region, 2022-2032 Table 60: Asia Pacific Market Value (Mn) Forecast, by Country and Sub-region, 2022-2032 Table 61: China Market Value (Mn) Forecast, by Type, 2022-2032 Table 62: China Market Value (Mn) Forecast, by Type, 2022-2032 Table 63: China Market Value (Mn) Analysis, 2022-2032 Table 64: China Market Value (Mn) Analysis, 2022-2032 Table 65: Japan Market Value (Mn) Forecast, by Type, 2022-2032 Table 66: Japan Market Value (Mn) Forecast, by Type, 2022-2032 Table 67: Japan Market Value (Mn) Analysis, 2022-2032 Table 68: Japan Market Value (Mn) Analysis, 2022-2032 Table 69: India Market Value (Mn) Forecast, by Type, 2022-2032 Table 70: India Market Value (Mn) Forecast, by Type, 2022-2032 Table 71: India Market Value (Mn) Analysis, 2022-2032 Table 72: India Market Value (Mn) Analysis, 2022-2032 Table 73: ASEAN Market Value (Mn) Forecast, by Type, 2022-2032 Table 74: ASEAN Market Value (Mn) Forecast, by Type, 2022-2032 Table 75: ASEAN Market Value (Mn) Analysis, 2022-2032 Table 76: ASEAN Market Value (Mn) Analysis, 2022-2032 Table 77: Rest of Asia Pacific Market Value (Mn) Forecast, by Type, 2022-2032 Table 78: Rest of Asia Pacific Market Value (Mn) Forecast, by Type, 2022-2032 Table 79: Rest of Asia Pacific Market Value (Mn) Analysis, 2022-2032 Table 80: Rest of Asia Pacific Market Value (Mn) Analysis, 2022-2032 Table 81: Latin America Market Value (Mn) Forecast, by Type, 2022-2032 Table 82: Latin America Market Value (Mn) Forecast, by Type, 2022-2032 Table 83: Latin America Market Value (Mn) Analysis, 2022-2032 Table 84: Latin America Market Value (Mn) Analysis, 2022-2032 Table 85: Latin America Market Value (Mn) Forecast, by Country and Sub-region, 2022-2032 Table 86: Latin America Market Value (Mn) Forecast, by Country and Sub-region, 2022-2032 Table 87: Brazil Market Value (Mn) Forecast, by Type, 2022-2032 Table 88: Brazil Market Value (Mn) Forecast, by Type, 2022-2032 Table 89: Brazil Market Value (Mn) Analysis, 2022-2032 Table 90: Brazil Market Value (Mn) Analysis, 2022-2032 Table 91: Mexico Market Value (Mn) Forecast, by Type, 2022-2032 Table 92: Mexico Market Value (Mn) Forecast, by Type, 2022-2032 Table 93: Mexico Market Value (Mn) Analysis, 2022-2032 Table 94: Mexico Market Value (Mn) Analysis, 2022-2032 Table 95: Rest of Latin America Market Value (Mn) Forecast, by Type, 2022-2032 Table 96: Rest of Latin America Market Value (Mn) Forecast, by Type, 2022-2032 Table 97: Rest of Latin America Market Value (Mn) Analysis, 2022-2032 Table 98: Rest of Latin America Market Value (Mn) Analysis, 2022-2032 Table 99: Middle East & Africa Market Value (Mn) Forecast, by Type, 2022-2032 Table 100: Middle East & Africa Market Value (Mn) Forecast, by Type, 2022-2032 Table 101: Middle East & Africa Market Value (Mn) Analysis, 2022-2032 Table 102: Middle East & Africa Market Value (Mn) Analysis, 2022-2032 Table 103: Middle East & Africa Market Value (Mn) Forecast, by Country and Sub-region, 2022-2032 Table 104: Middle East & Africa Market Value (Mn) Forecast, by Country and Sub-region, 2022-2032 Table 105: GCC Market Value (Mn) Forecast, by Type, 2022-2032 Table 106: GCC Market Value (Mn) Forecast, by Type, 2022-2032 Table 107: GCC Market Value (Mn) Analysis, 2022-2032 Table 108: GCC Market Value (Mn) Analysis, 2022-2032 Table 109: South Africa Market Value (Mn) Forecast, by Type, 2022-2032 Table 110: South Africa Market Value (Mn) Forecast, by Type, 2022-2032 Table 111: South Africa Market Value (Mn) Analysis, 2022-2032 Table 112: South Africa Market Value (Mn) Analysis, 2022-2032 Table 113: Rest of Middle East & Africa Market Value (Mn) Forecast, by Type, 2022-2032 Table 114: Rest of Middle East & Africa Market Value (Mn) Forecast, by Type, 2022-2032 Table 115: Rest of Middle East & Africa Market Value (Mn) Analysis, 2022-2032 Table 116: Rest of Middle East & Africa Market Value (Mn) Analysis, 2022-2032
Find your sweet spots for generating winning opportunities in this market.
Talk to AnalystList of Charts
Figure 1: Global Market Price Trend, by Region, 2022-2032 (US$ Mn) Figure 2: Global Market Value Share, by Type, 2017, 2022 and 2032 Figure 3: Global Market Attractiveness, by Type Figure 4: Global Market Value Share, Analysis, 2017, 2022 and 2032 Figure 5: Global Market Attractiveness, Analysis Figure 6: Global Market Value Share, by Region, 2017, 2022 and 2032 Figure 7: Global Market Attractiveness, by Region Figure 8: North America Market Value Share, by Type, 2017, 2022 and 2032 Figure 9: North America Market Attractiveness, by Type Figure 10: North America Market Value Share, Analysis, 2017, 2022 and 2032 Figure 11: North America Market Attractiveness, Analysis Figure 12: North America Market Value Share, by Country, 2017, 2022 and 2032 Figure 13: North America Market Attractiveness, by Country Figure 14: Europe Market Value Share, by Type, 2017, 2022 and 2032 Figure 15: Europe Market Attractiveness, by Type Figure 16: Europe Market Value Share, Analysis, 2017, 2022 and 2032 Figure 17: Europe Market Attractiveness, Analysis Figure 18: Europe Market Value Share, by Country and Sub-region, 2017, 2022 and 2032 Figure 19: Europe Market Attractiveness, by Country and Sub-region Figure 20: Asia Pacific Market Value Share, by Type, 2017, 2022 and 2032 Figure 21: Asia Pacific Market Attractiveness, by Type Figure 22: Asia Pacific Market Value Share, Analysis, 2017, 2022 and 2032 Figure 23: Asia Pacific Market Attractiveness, Analysis Figure 24: Asia Pacific Market Value Share, by Country and Sub-region, 2017, 2022 and 2032 Figure 25: Asia Pacific Market Attractiveness, by Country and Sub-region Figure 26: Latin America Market Value Share, by Type, 2017, 2022 and 2032 Figure 27: Latin America Market Attractiveness, by Type Figure 28: Latin America Market Value Share, Analysis, 2017, 2022 and 2032 Figure 29: Latin America Market Attractiveness, Analysis Figure 30: Latin America Market Value Share, by Country and Sub-region, 2017, 2022 and 2032 Figure 31: Latin America Market Attractiveness, by Country and Sub-region Figure 32: Middle East & Africa Market Value Share, by Type, 2017, 2022 and 2032 Figure 33: Middle East & Africa Market Attractiveness, by Type Figure 34: Middle East & Africa Market Value Share, Analysis, 2017, 2022 and 2032 Figure 35: Middle East & Africa Market Attractiveness, Analysis Figure 36: Middle East & Africa Market Value Share, by Country and Sub-region, 2017, 2022 and 2032 Figure 37: Middle East & Africa Market Attractiveness, by Country and Sub-region Figure 38: Global Market Share Analysis, by Company, 2020
Need specific information?
Request CustomizationExplore Consumer Product Insights
View Reports