Second-hand Apparel Market in Europe Size and Share Forecast Outlook 2025 to 2035

The European second-hand apparel market is projected to grow from USD 18.6 billion in 2025 to approximately USD 39.1 billion by 2035, recording an absolute increase of USD 20.5 billion over the forecast period. This translates into a total growth of 110.2%, with the market forecast to expand at a compound annual growth rate (CAGR) of 7.7% between 2025 and 2035. The overall market size is expected to grow by approximately 2.1X during the same period, supported by the rising environmental consciousness among European consumers, increasing acceptance of circular fashion principles, and growing digitalization of second-hand shopping platforms.

Between 2025 and 2030, the European second-hand apparel market is projected to expand from USD 18.6 billion to USD 26.9 billion, resulting in a value increase of USD 8.3 billion, which represents 40.5% of the total forecast growth for the decade. This phase of growth will be shaped by increasing environmental awareness among European consumers, growing acceptance of pre-owned fashion as mainstream shopping behavior, and expanding digital marketplace platforms. Retailers are enhancing their online presence and authentication services to address the growing sophistication of second-hand fashion consumers across diverse European markets.

From 2030 to 2035, the market is forecast to grow from USD 26.9 billion to USD 39.1 billion, adding another USD 12.2 billion, which constitutes 59.5% of the overall ten-year expansion. This period is expected to be characterized by expansion of luxury resale segments, integration of artificial intelligence for pricing and authentication, and development of comprehensive circular economy business models. The growing emphasis on sustainable fashion consumption will drive demand for premium second-hand apparel platforms that offer authenticated luxury goods and personalized shopping experiences.

Between 2020 and 2025, the market experienced accelerated expansion, driven by changing consumer attitudes toward sustainability and the normalization of pre-owned fashion purchases. The market developed as digital platforms made second-hand shopping more accessible, convenient, and socially acceptable among younger demographics. Environmental concerns and economic considerations began driving mainstream adoption of circular fashion principles across diverse European consumer segments.
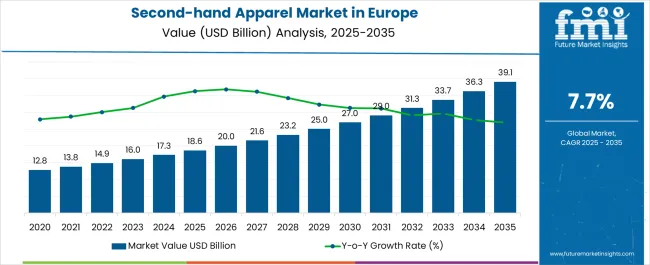
Quick Stats for Second-hand Apparel Market in Europe

  • Second-hand Apparel Market Value in Europe (2025): USD 18.6 billion
  • Second-hand Apparel Market Forecast Value in Europe (2035): USD 39.1 billion
  • Second-hand Apparel Market Forecast CAGR in Europe: 7.7%
  • Leading Product Type Segment in European Second-hand Apparel Market: Women Consumers (55.1%)
  • Key Growth Regions in European Second-hand Apparel Market: Western Europe, Southern Europe, and Northern Europe
  • Key Players in European Second-hand Apparel Market: Vinted, eBay, Vestiaire Collective, Depop, StockX

Second Hand Apparel Market In Europe Market Value Analysis

Second-hand Apparel Market in Europe Key Takeaways

Metric Value
Second-hand Apparel Market Value in Europe (2025) 18.6 billion USD
Second-hand Apparel Market Forecast Value in Europe (2035) 39.1 billion USD
Second-hand Apparel Market Forecast CAGR in Europe 7.7

Why the Second-hand Apparel Market in Europe is Growing?

Market expansion is being supported by the rapid increase in environmental consciousness among European consumers and the corresponding shift toward sustainable fashion consumption patterns that prioritize circular economy principles. Modern European consumers increasingly view second-hand apparel as a responsible alternative to fast fashion, creating demand for quality pre-owned clothing that extends product lifecycles while reducing environmental impact. The growing recognition of fashion industry environmental costs is driving consistent adoption of second-hand shopping across diverse demographic groups and income levels.

The growing sophistication of digital marketplace platforms and increasing consumer confidence in online second-hand transactions are driving demand for authenticated, quality-assured pre-owned apparel from established platforms with comprehensive buyer protection policies. European consumers are increasingly comfortable with digital-first shopping experiences that offer detailed product descriptions, authentication services, and return policies comparable to traditional retail. Platform innovations and consumer education programs are establishing trust and convenience standards that support mainstream second-hand fashion adoption.

Segmental Analysis

The market is segmented by product type, sector, consumer group, sales channel, and region. The product type segment covers dresses & tops, shirts & t-shirts, sweaters, coats & jackets, jeans & pants, and others. The sector segment includes resale and traditional thrift stores & donations. The consumer group segment comprises men, women, and kids. The sales channel segment includes wholesalers/distributors, hypermarkets/supermarkets, multi-brand stores, independent small stores, departmental stores, online retailers, and other sales channels.Regionally, the market is divided into Western Europe, Southern Europe, Northern Europe, and Eastern Europe.
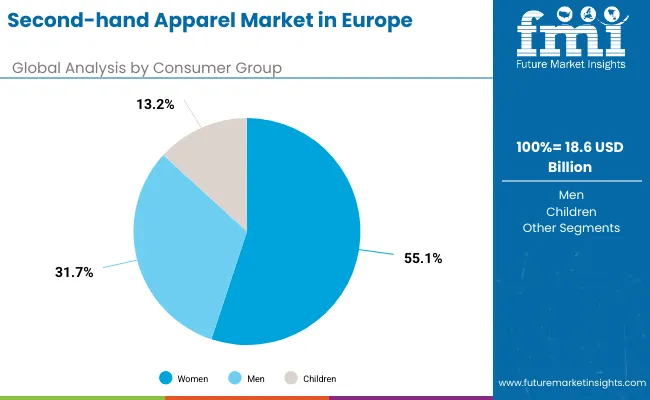
By Consumer Group, Women Segment Accounts for 55.1% Market Share

Copy   Reusable Grocery Tote Market

Women consumers are expected to represent 55.1% of European second-hand apparel demand in 2025. This dominant share reflects the higher fashion consumption rates among women and their greater willingness to engage with sustainable fashion alternatives including pre-owned clothing purchases. Women demonstrate stronger environmental consciousness in fashion choices and greater comfort with digital marketplace platforms for clothing transactions. The segment benefits from extensive product variety, active online communities around sustainable fashion, and established social acceptance of second-hand clothing among female demographics.

By Product Segment, Dresses & Tops Segment Accounts for 20.0% Market Share

Copy   Reusable Grocery Tote Market (1)

Dresses & tops are projected to account for 20.0% of the European second-hand apparel market in 2025. This leading share is supported by the high frequency of dress and top purchases among female consumers and the strong resale value retention of quality dresses and designer tops in the second-hand market. These items often represent significant original investments that retain appeal and functionality over extended periods, making them attractive to both sellers and buyers. The segment benefits from diverse style options, seasonal demand patterns, and strong brand recognition that supports pricing stability in resale markets.

What are the Drivers, Restraints, and Key Trends of the Second-hand Apparel Market in Europe?

The European second-hand apparel market is advancing rapidly due to increasing environmental awareness and growing acceptance of circular fashion principles among diverse consumer demographics. However, the market faces challenges including concerns about product authenticity, varying quality standards, and cultural barriers to second-hand purchasing in certain market segments. Innovation efforts and platform development programs continue to influence consumer confidence and market expansion patterns across different European regions.

Expansion of Luxury and Designer Resale Segments

The growing development of authenticated luxury resale platforms is enabling access to high-end fashion items at reduced prices while maintaining product authenticity and quality assurance. Specialized platforms provide authentication services, condition assessments, and premium customer experiences that appeal to luxury fashion consumers. These developments are particularly valuable for consumers seeking designer items and investment pieces while supporting sustainable luxury consumption patterns.

Integration of AI-Powered Pricing and Personalization

Modern second-hand apparel platforms are incorporating artificial intelligence technologies that optimize pricing strategies, recommend products based on consumer preferences, and enhance search functionality for improved shopping experiences. Integration of machine learning algorithms enables dynamic pricing based on market demand, brand popularity, and item condition while providing personalized recommendations. Advanced technologies support efficient marketplace operations while enhancing consumer satisfaction and platform engagement.
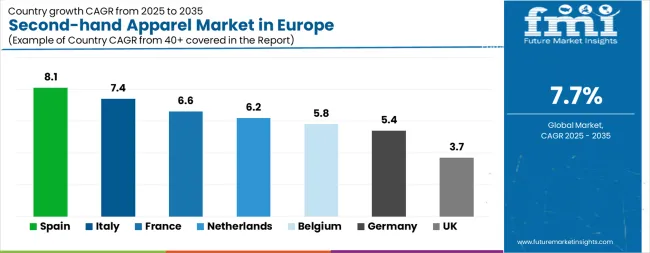
Analysis of Second-hand Apparel Market by Key Country in Europe

Second Hand Apparel Market In Europe Cagr Analysis By Country

Country CAGR (2025 to 2035)
Spain 8.1%
Italy 7.4%
France 6.6%
Netherlands 6.2%
Belgium 5.8%
Germany 5.4%
United Kingdom 3.7%

The European second-hand apparel market demonstrates varied growth patterns across key countries, with Spain leading at 8.1% market share, followed by Italy at 7.4%, France at 6.6%, Netherlands at 6.2%, Belgium at 5.8%, Germany at 5.4%, and the United Kingdom at 3.7%. These markets reflect different stages of digital platform adoption, consumer acceptance of second-hand fashion, and cultural attitudes toward circular economy principles.

The report covers an in-depth analysis of 40+ countries; seven top-performing OECD countries are highlighted below.

Spain Leads European Market with Strong Digital Adoption

Revenue from second-hand apparel in Spain is expanding at a CAGR of 8.1%, driven by rapid adoption of digital marketplace platforms and growing environmental consciousness among Spanish consumers across diverse age demographics. The country's expanding e-commerce infrastructure and increasing smartphone penetration create favorable conditions for online second-hand fashion transactions. Spanish consumers demonstrate strong interest in sustainable fashion alternatives, supported by cultural values emphasizing resourcefulness and community-based commerce that align with second-hand shopping principles. Environmental education initiatives promote circular fashion consumption, driving adoption of second-hand apparel as mainstream shopping behavior among environmentally conscious consumer segments.

  • Digital marketplace platforms and e-commerce infrastructure expansion are driving rapid adoption of second-hand apparel shopping among environmentally conscious Spanish consumers across diverse age demographics.
  • Cultural values emphasizing resourcefulness and community-based commerce are supporting mainstream integration of second-hand fashion as sustainable shopping alternatives throughout metropolitan areas.

Italy Demonstrates Strong Fashion Culture Integration

Revenue from second-hand apparel in Italy is projected to grow at a CAGR of 7.4%, supported by the country's deep fashion heritage and sophisticated consumer understanding of clothing quality, design, and value retention. Italian consumers demonstrate discerning taste in second-hand fashion selection, creating demand for authentic designer items and high-quality vintage pieces. The country's established fashion culture provides favorable context for appreciating pre-owned luxury and designer items as valuable investment pieces rather than mere alternatives to new clothing. Cultural acceptance of vintage and heritage fashion items supports mainstream adoption of second-hand shopping among fashion-conscious consumer demographics seeking unique and quality pieces.
  • Deep fashion heritage and sophisticated consumer understanding of clothing quality are driving demand for authentic designer items and high-quality vintage pieces in second-hand markets.
  • Fashion industry expertise and cultural acceptance of vintage items are supporting consumer appreciation for pre-owned luxury pieces as valuable investment alternatives rather than mere clothing substitutes.

France Shows Growing Sustainable Fashion Awareness

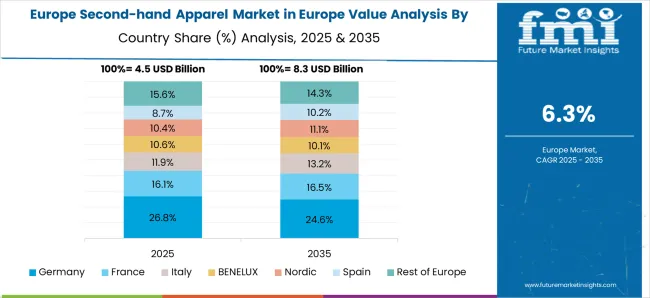
Second Hand Apparel Market In Europe Europe Country Market Share Analysis, 2025 & 2035

Revenue from second-hand apparel in France is projected to grow at a CAGR of 6.6%, characterized by increasing consumer interest in sustainable fashion alternatives and growing acceptance of circular economy principles among urban populations. French consumers demonstrate rising environmental consciousness that translates into second-hand apparel purchases as responsible consumption choices. The country's established fashion retail infrastructure provides favorable conditions for integrating second-hand options into mainstream shopping behaviors. Sustainability education programs promote awareness of fashion industry environmental impacts, driving consumer interest in circular fashion alternatives and second-hand purchasing decisions. Digital platform adoption increases among younger demographics seeking affordable access to designer and quality fashion items through authenticated resale channels.

  • Increasing environmental consciousness and sustainability education programs are driving consumer interest in second-hand apparel as responsible consumption choices among urban populations.
  • Established fashion retail infrastructure and circular economy awareness are supporting mainstream adoption of second-hand shopping behaviors through authenticated resale channels.

Netherlands Maintains Advanced Digital Commerce Position

Revenue from second-hand apparel in the Netherlands is projecetd to grow at a CAGR of 6.2%, driven by advanced digital infrastructure and high consumer comfort with online marketplace transactions across diverse product categories including fashion. Dutch consumers demonstrate practical approaches to consumption that align with circular economy principles and environmental responsibility. The country's established e-commerce ecosystem provides robust foundation for second-hand apparel platform adoption and growth. Environmental consciousness initiatives promote sustainable consumption patterns that include second-hand apparel purchasing as responsible consumer behavior.

  • Advanced digital infrastructure and high consumer comfort with online marketplace transactions are driving second-hand apparel platform adoption across diverse demographic groups.
  • Practical consumption approaches and environmental consciousness initiatives are supporting confidence in online second-hand transactions through robust digital payment systems and consumer protection frameworks.

Belgium Demonstrates Growing Market Participation

Demand for second-hand apparel in Belgium is projected to grow at a CAGR of 5.8%, supported by increasing consumer awareness of sustainable fashion options and growing acceptance of pre-owned clothing among environmentally conscious demographics. Belgian consumers demonstrate rising interest in circular fashion principles that support second-hand apparel as viable alternatives to fast fashion purchases. The country's multilingual consumer base and proximity to major European fashion markets create favorable conditions for diverse second-hand apparel access and selection. Digital marketplace adoption increases among younger consumers seeking affordable access to quality fashion items while supporting environmental responsibility through circular consumption patterns.

  • Growing environmental awareness and circular fashion principles are driving consumer acceptance of pre-owned clothing as viable alternatives to fast fashion purchases.
  • Multilingual consumer base and proximity to major European fashion markets are supporting diverse second-hand apparel access and digital marketplace adoption among younger demographics.

Germany Focuses on Quality and Sustainability Standards

Demand for second-hand apparel in Germany is projected to grow at a CAGR of 5.4%, characterized by consumer emphasis on product quality, authenticity verification, and environmental responsibility in fashion purchasing decisions. German consumers prioritize sustainable consumption practices that include second-hand apparel as environmentally responsible alternatives to conventional retail. The country's strong environmental consciousness and quality standards create demand for authenticated, well-maintained pre-owned clothing items. Environmental education programs promote circular economy principles that include second-hand fashion consumption as responsible consumer behavior aligned with sustainability goals.

  • Consumer emphasis on product quality and authenticity verification are driving demand for authenticated, well-maintained pre-owned clothing items in second-hand markets.
  • Strong environmental consciousness and consumer protection frameworks are supporting quality standards and consumer confidence in second-hand marketplace transactions.

United Kingdom Maintains Established Digital Market Position

Demand for second-hand apparel in the United Kingdom is projected to grow at a CAGR of 3.7%, characterized by mature digital marketplace infrastructure and established consumer familiarity with online second-hand transactions across various product categories. British consumers demonstrate practical approaches to fashion consumption that include second-hand options as cost-effective alternatives to new clothing purchases. The country's established e-commerce ecosystem supports diverse second-hand apparel platforms and marketplace options. Cultural acceptance of vintage and pre-owned items supports mainstream adoption of second-hand shopping as viable fashion consumption alternative among diverse demographic groups.

  • Mature digital marketplace infrastructure and established consumer familiarity with online transactions are driving second-hand apparel adoption as cost-effective alternatives to new clothing purchases across diverse demographic groups.
  • Digital platform innovation and comprehensive authentication services are supporting consumer confidence in second-hand apparel purchases through user-friendly interfaces and cultural acceptance of vintage items.

Europe Market Split by Country

The Europe second-hand apparel market is projected to grow from USD 18.6 billion in 2025 to USD 39.1 billion by 2035, registering a CAGR of 7.7% over the forecast period. Germany is expected to maintain its leadership despite a slight reduction in share from 22.1% in 2025 to 20.3% by 2035, supported by its robust e-commerce infrastructure and established thrift culture, though growth moderates due to market maturity.

Spain is projected to gain the most ground, expanding its share from 8.7% to 10.4%, attributed to rising Gen-Z adoption of thrift culture and aggressive marketplace expansion by platforms like Wallapop. Italy will also see gains from 10.1% to 10.9%, driven by vintage fashion tourism and increasing mobile resale adoption. The Rest of Europe region is expected to expand its share from 21.8% to 23.1%, fueled by rising sustainability mandates in Eastern and Nordic regions and supportive circular economy policie
Competitive Landscape of Second-hand Apparel Market in Europe

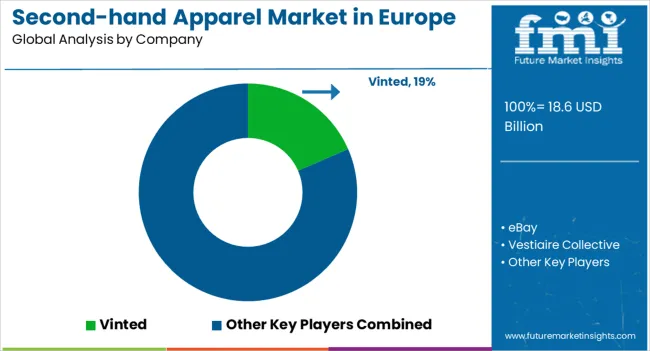
Second Hand Apparel Market In Europe Analysis By Company

The European second-hand apparel market is defined by competition among specialized online marketplaces, established e-commerce platforms, and luxury resale specialists. Companies are investing in authentication technologies, user experience enhancement, mobile platform optimization, and community building features to deliver trustworthy, convenient second-hand apparel shopping experiences. Strategic partnerships, influencer collaborations, and sustainability messaging are central to building brand recognition and expanding user bases across diverse European markets.

Vinted leads the European market with 19% share, offering comprehensive peer-to-peer marketplace solutions with focus on user-friendly interfaces, secure payment systems, and community-driven selling experiences. eBay holds 15.2% market share, providing established marketplace infrastructure and broad product selection for second-hand apparel transactions. Vestiaire Collective maintains 12.3% share through luxury focus and authentication services that appeal to premium fashion consumers.

Depop commands 9.8% of the market, emphasizing social commerce features and community engagement that appeals to younger demographics interested in unique and vintage fashion items. StockX holds 7.4% share, focusing on authentication services and marketplace integrity for designer and limited-edition fashion items. These companies collectively represent the leading platforms in the European second-hand apparel market, each contributing unique value propositions and user experience innovations.

Key Players in the Second-hand Apparel Market in Europe

  • Vinted
  • eBay
  • Vestiaire Collective
  • Depop
  • Garson & Shaw
  • F&P Stock Solutions
  • Etsy
  • Yaga
  • Farfetch

Scope of the Report

Item Value
Quantitative Units USD 18.6 billion
Product Segment Dresses & Tops, Shirts & T-Shirts, Jeans & Pants, Sweaters, Coats & Jackets, Others
Sector Resale, Traditional Thrift Stores & Donations
Consumer Group Men, Women, Kids
Sales Channel Wholesalers/Distributors, Hypermarkets/Supermarket, Multi-Brand Store, Independent Small Stores, Departmental Stores, Online Retailers, Other Sales Channel
Regions Covered Western Europe, Southern Europe, Northern Europe, Eastern Europe
Key Countries Covered Spain, Italy, France, Netherlands, Belgium, Germany, United Kingdom, and 40+ countries
Key Companies Profiled Vinted, Ebay, Vestaire Collective, Garson & Shaw, Depop, F&P Stock Solutions, Etsy, Yaga, Farfetch
Additional Attributes Market analysis by product categories and consumer demographics, regional adoption patterns across European markets, competitive landscape with digital marketplace platforms and luxury resale specialists, consumer behavior trends in sustainable fashion consumption, platform technology innovations including authentication and personalization, environmental impact considerations, and integration with circular economy principles and sustainable fashion movements

Second-hand Apparel Market in Europe by Segments

Product Segment:

  • Dresses & Tops
  • Shirts & T-Shirts
  • Jeans & Pants
  • Sweaters
  • Coats & Jackets
  • Others

Consumer Group:

  • Women
  • Men
  • Children

Sector:

  • Resale
  • Traditional Thrift Stores & Donations

Sales Channel:

  • Wholesalers/Distributors
  • Hypermarkets/Supermarket
  • Multi-Brand Store
  • Independent Small Stores
  • Departmental Stores
  • Online Retailers
  • Other Sales Channel

Geography:

  • Western Europe
    • Spain
    • Italy
    • France
    • Netherlands
    • Belgium
    • Germany
    • United Kingdom
  • Southern Europe
  • Northern Europe
  • Eastern Europe

Table of Content

  1. Executive Summary
    • Global Market Outlook
    • Demand-side Trends
    • Supply-side Trends
    • Technology Roadmap Analysis
    • Analysis and Recommendations
  2. Market Overview
    • Market Coverage / Taxonomy
    • Market Definition / Scope / Limitations
  3. Market Background
    • Market Dynamics
      • Drivers
      • Restraints
      • Opportunity
      • Trends
    • Scenario Forecast
      • Demand in Optimistic Scenario
      • Demand in Likely Scenario
      • Demand in Conservative Scenario
    • Opportunity Map Analysis
    • Product Life Cycle Analysis
    • Supply Chain Analysis
    • Investment Feasibility Matrix
    • Value Chain Analysis
    • PESTLE and Porter’s Analysis
    • Regulatory Landscape
    • Regional Parent Market Outlook
    • Production and Consumption Statistics
    • Import and Export Statistics
  4. Global Market Analysis 2020 to 2024 and Forecast, 2025 to 2035
    • Historical Market Size Value (USD Million) Analysis, 2020 to 2024
    • Current and Future Market Size Value (USD Million) Projections, 2025 to 2035
      • Y-o-Y Growth Trend Analysis
      • Absolute $ Opportunity Analysis
  5. Global Market Pricing Analysis 2020 to 2024 and Forecast 2025 to 2035
  6. Global Market Analysis 2020 to 2024 and Forecast 2025 to 2035, By Product Segment
    • Introduction / Key Findings
    • Historical Market Size Value (USD Million) Analysis By Product Segment , 2020 to 2024
    • Current and Future Market Size Value (USD Million) Analysis and Forecast By Product Segment , 2025 to 2035
      • Dresses & Tops
      • Shirts & T-Shirts
      • Jeans & Pants
      • Sweater
      • Coats & Jackets
      • Others
    • Y-o-Y Growth Trend Analysis By Product Segment , 2020 to 2024
    • Absolute $ Opportunity Analysis By Product Segment , 2025 to 2035
  7. Global Market Analysis 2020 to 2024 and Forecast 2025 to 2035, By Consumer Group
    • Introduction / Key Findings
    • Historical Market Size Value (USD Million) Analysis By Consumer Group, 2020 to 2024
    • Current and Future Market Size Value (USD Million) Analysis and Forecast By Consumer Group, 2025 to 2035
      • Women
      • Men
      • Children
    • Y-o-Y Growth Trend Analysis By Consumer Group, 2020 to 2024
    • Absolute $ Opportunity Analysis By Consumer Group, 2025 to 2035
  8. Global Market Analysis 2020 to 2024 and Forecast 2025 to 2035, By Region
    • Introduction
    • Historical Market Size Value (USD Million) Analysis By Region, 2020 to 2024
    • Current Market Size Value (USD Million) Analysis and Forecast By Region, 2025 to 2035
      • North America
      • Latin America
      • Western Europe
      • Eastern Europe
      • East Asia
      • South Asia and Pacific
      • Middle East & Africa
    • Market Attractiveness Analysis By Region
  9. North America Market Analysis 2020 to 2024 and Forecast 2025 to 2035, By Country
    • Historical Market Size Value (USD Million) Trend Analysis By Market Taxonomy, 2020 to 2024
    • Market Size Value (USD Million) Forecast By Market Taxonomy, 2025 to 2035
      • By Country
        • USA
        • Canada
        • Mexico
      • By Product Segment
      • By Consumer Group
    • Market Attractiveness Analysis
      • By Country
      • By Product Segment
      • By Consumer Group
    • Key Takeaways
  10. Latin America Market Analysis 2020 to 2024 and Forecast 2025 to 2035, By Country
    • Historical Market Size Value (USD Million) Trend Analysis By Market Taxonomy, 2020 to 2024
    • Market Size Value (USD Million) Forecast By Market Taxonomy, 2025 to 2035
      • By Country
        • Brazil
        • Chile
        • Rest of Latin America
      • By Product Segment
      • By Consumer Group
    • Market Attractiveness Analysis
      • By Country
      • By Product Segment
      • By Consumer Group
    • Key Takeaways
  11. Western Europe Market Analysis 2020 to 2024 and Forecast 2025 to 2035, By Country
    • Historical Market Size Value (USD Million) Trend Analysis By Market Taxonomy, 2020 to 2024
    • Market Size Value (USD Million) Forecast By Market Taxonomy, 2025 to 2035
      • By Country
        • Germany
        • UK
        • Italy
        • Spain
        • France
        • Nordic
        • BENELUX
        • Rest of Western Europe
      • By Product Segment
      • By Consumer Group
    • Market Attractiveness Analysis
      • By Country
      • By Product Segment
      • By Consumer Group
    • Key Takeaways
  12. Eastern Europe Market Analysis 2020 to 2024 and Forecast 2025 to 2035, By Country
    • Historical Market Size Value (USD Million) Trend Analysis By Market Taxonomy, 2020 to 2024
    • Market Size Value (USD Million) Forecast By Market Taxonomy, 2025 to 2035
      • By Country
        • Russia
        • Poland
        • Hungary
        • Balkan & Baltic
        • Rest of Eastern Europe
      • By Product Segment
      • By Consumer Group
    • Market Attractiveness Analysis
      • By Country
      • By Product Segment
      • By Consumer Group
    • Key Takeaways
  13. East Asia Market Analysis 2020 to 2024 and Forecast 2025 to 2035, By Country
    • Historical Market Size Value (USD Million) Trend Analysis By Market Taxonomy, 2020 to 2024
    • Market Size Value (USD Million) Forecast By Market Taxonomy, 2025 to 2035
      • By Country
        • China
        • Japan
        • South Korea
      • By Product Segment
      • By Consumer Group
    • Market Attractiveness Analysis
      • By Country
      • By Product Segment
      • By Consumer Group
    • Key Takeaways
  14. South Asia and Pacific Market Analysis 2020 to 2024 and Forecast 2025 to 2035, By Country
    • Historical Market Size Value (USD Million) Trend Analysis By Market Taxonomy, 2020 to 2024
    • Market Size Value (USD Million) Forecast By Market Taxonomy, 2025 to 2035
      • By Country
        • India
        • ASEAN
        • Australia & New Zealand
        • Rest of South Asia and Pacific
      • By Product Segment
      • By Consumer Group
    • Market Attractiveness Analysis
      • By Country
      • By Product Segment
      • By Consumer Group
    • Key Takeaways
  15. Middle East & Africa Market Analysis 2020 to 2024 and Forecast 2025 to 2035, By Country
    • Historical Market Size Value (USD Million) Trend Analysis By Market Taxonomy, 2020 to 2024
    • Market Size Value (USD Million) Forecast By Market Taxonomy, 2025 to 2035
      • By Country
        • Kingdom of Saudi Arabia
        • Other GCC Countries
        • Turkiye
        • South Africa
        • Other African Union
        • Rest of Middle East & Africa
      • By Product Segment
      • By Consumer Group
    • Market Attractiveness Analysis
      • By Country
      • By Product Segment
      • By Consumer Group
    • Key Takeaways
  16. Key Countries Market Analysis
    • USA
      • Pricing Analysis
      • Market Share Analysis, 2024
        • By Product Segment
        • By Consumer Group
    • Canada
      • Pricing Analysis
      • Market Share Analysis, 2024
        • By Product Segment
        • By Consumer Group
    • Mexico
      • Pricing Analysis
      • Market Share Analysis, 2024
        • By Product Segment
        • By Consumer Group
    • Brazil
      • Pricing Analysis
      • Market Share Analysis, 2024
        • By Product Segment
        • By Consumer Group
    • Chile
      • Pricing Analysis
      • Market Share Analysis, 2024
        • By Product Segment
        • By Consumer Group
    • Germany
      • Pricing Analysis
      • Market Share Analysis, 2024
        • By Product Segment
        • By Consumer Group
    • UK
      • Pricing Analysis
      • Market Share Analysis, 2024
        • By Product Segment
        • By Consumer Group
    • Italy
      • Pricing Analysis
      • Market Share Analysis, 2024
        • By Product Segment
        • By Consumer Group
    • Spain
      • Pricing Analysis
      • Market Share Analysis, 2024
        • By Product Segment
        • By Consumer Group
    • France
      • Pricing Analysis
      • Market Share Analysis, 2024
        • By Product Segment
        • By Consumer Group
    • India
      • Pricing Analysis
      • Market Share Analysis, 2024
        • By Product Segment
        • By Consumer Group
    • ASEAN
      • Pricing Analysis
      • Market Share Analysis, 2024
        • By Product Segment
        • By Consumer Group
    • Australia & New Zealand
      • Pricing Analysis
      • Market Share Analysis, 2024
        • By Product Segment
        • By Consumer Group
    • China
      • Pricing Analysis
      • Market Share Analysis, 2024
        • By Product Segment
        • By Consumer Group
    • Japan
      • Pricing Analysis
      • Market Share Analysis, 2024
        • By Product Segment
        • By Consumer Group
    • South Korea
      • Pricing Analysis
      • Market Share Analysis, 2024
        • By Product Segment
        • By Consumer Group
    • Russia
      • Pricing Analysis
      • Market Share Analysis, 2024
        • By Product Segment
        • By Consumer Group
    • Poland
      • Pricing Analysis
      • Market Share Analysis, 2024
        • By Product Segment
        • By Consumer Group
    • Hungary
      • Pricing Analysis
      • Market Share Analysis, 2024
        • By Product Segment
        • By Consumer Group
    • Kingdom of Saudi Arabia
      • Pricing Analysis
      • Market Share Analysis, 2024
        • By Product Segment
        • By Consumer Group
    • Turkiye
      • Pricing Analysis
      • Market Share Analysis, 2024
        • By Product Segment
        • By Consumer Group
    • South Africa
      • Pricing Analysis
      • Market Share Analysis, 2024
        • By Product Segment
        • By Consumer Group
  17. Market Structure Analysis
    • Competition Dashboard
    • Competition Benchmarking
    • Market Share Analysis of Top Players
      • By Regional
      • By Product Segment
      • By Consumer Group
  18. Competition Analysis
    • Competition Deep Dive
      • Vinted
        • Overview
        • Product Portfolio
        • Profitability by Market Segments (Product/Age /Sales Channel/Region)
        • Sales Footprint
        • Strategy Overview
          • Marketing Strategy
          • Product Strategy
          • Channel Strategy
      • eBay
      • Vestiaire Collective
      • Depop
      • StockX
  19. Assumptions & Acronyms Used
  20. Research Methodology

List of Tables

  • Table 1: Global Market Value (USD Million) Forecast by Region, 2020-2035
  • Table 2: Global Market Value (USD Million) Forecast by Product Segment , 2020-2035
  • Table 3: Global Market Value (USD Million) Forecast by Consumer Group, 2020-2035
  • Table 4: North America Market Value (USD Million) Forecast by Country, 2020-2035
  • Table 5: North America Market Value (USD Million) Forecast by Product Segment , 2020-2035
  • Table 6: North America Market Value (USD Million) Forecast by Consumer Group, 2020-2035
  • Table 7: Latin America Market Value (USD Million) Forecast by Country, 2020-2035
  • Table 8: Latin America Market Value (USD Million) Forecast by Product Segment , 2020-2035
  • Table 9: Latin America Market Value (USD Million) Forecast by Consumer Group, 2020-2035
  • Table 10: Western Europe Market Value (USD Million) Forecast by Country, 2020-2035
  • Table 11: Western Europe Market Value (USD Million) Forecast by Product Segment , 2020-2035
  • Table 12: Western Europe Market Value (USD Million) Forecast by Consumer Group, 2020-2035
  • Table 13: Eastern Europe Market Value (USD Million) Forecast by Country, 2020-2035
  • Table 14: Eastern Europe Market Value (USD Million) Forecast by Product Segment , 2020-2035
  • Table 15: Eastern Europe Market Value (USD Million) Forecast by Consumer Group, 2020-2035
  • Table 16: East Asia Market Value (USD Million) Forecast by Country, 2020-2035
  • Table 17: East Asia Market Value (USD Million) Forecast by Product Segment , 2020-2035
  • Table 18: East Asia Market Value (USD Million) Forecast by Consumer Group, 2020-2035
  • Table 19: South Asia and Pacific Market Value (USD Million) Forecast by Country, 2020-2035
  • Table 20: South Asia and Pacific Market Value (USD Million) Forecast by Product Segment , 2020-2035
  • Table 21: South Asia and Pacific Market Value (USD Million) Forecast by Consumer Group, 2020-2035
  • Table 22: Middle East & Africa Market Value (USD Million) Forecast by Country, 2020-2035
  • Table 23: Middle East & Africa Market Value (USD Million) Forecast by Product Segment , 2020-2035
  • Table 24: Middle East & Africa Market Value (USD Million) Forecast by Consumer Group, 2020-2035

List of Figures

  • Figure 1: Global Market Pricing Analysis
  • Figure 2: Global Market Value (USD Million) Forecast 2020-2035
  • Figure 3: Global Market Value Share and BPS Analysis by Product Segment , 2025 and 2035
  • Figure 4: Global Market Y-o-Y Growth Comparison by Product Segment , 2025-2035
  • Figure 5: Global Market Attractiveness Analysis by Product Segment
  • Figure 6: Global Market Value Share and BPS Analysis by Consumer Group, 2025 and 2035
  • Figure 7: Global Market Y-o-Y Growth Comparison by Consumer Group, 2025-2035
  • Figure 8: Global Market Attractiveness Analysis by Consumer Group
  • Figure 9: Global Market Value (USD Million) Share and BPS Analysis by Region, 2025 and 2035
  • Figure 10: Global Market Y-o-Y Growth Comparison by Region, 2025-2035
  • Figure 11: Global Market Attractiveness Analysis by Region
  • Figure 12: North America Market Incremental Dollar Opportunity, 2025-2035
  • Figure 13: Latin America Market Incremental Dollar Opportunity, 2025-2035
  • Figure 14: Western Europe Market Incremental Dollar Opportunity, 2025-2035
  • Figure 15: Eastern Europe Market Incremental Dollar Opportunity, 2025-2035
  • Figure 16: East Asia Market Incremental Dollar Opportunity, 2025-2035
  • Figure 17: South Asia and Pacific Market Incremental Dollar Opportunity, 2025-2035
  • Figure 18: Middle East & Africa Market Incremental Dollar Opportunity, 2025-2035
  • Figure 19: North America Market Value Share and BPS Analysis by Country, 2025 and 2035
  • Figure 20: North America Market Value Share and BPS Analysis by Product Segment , 2025 and 2035
  • Figure 21: North America Market Y-o-Y Growth Comparison by Product Segment , 2025-2035
  • Figure 22: North America Market Attractiveness Analysis by Product Segment
  • Figure 23: North America Market Value Share and BPS Analysis by Consumer Group, 2025 and 2035
  • Figure 24: North America Market Y-o-Y Growth Comparison by Consumer Group, 2025-2035
  • Figure 25: North America Market Attractiveness Analysis by Consumer Group
  • Figure 26: Latin America Market Value Share and BPS Analysis by Country, 2025 and 2035
  • Figure 27: Latin America Market Value Share and BPS Analysis by Product Segment , 2025 and 2035
  • Figure 28: Latin America Market Y-o-Y Growth Comparison by Product Segment , 2025-2035
  • Figure 29: Latin America Market Attractiveness Analysis by Product Segment
  • Figure 30: Latin America Market Value Share and BPS Analysis by Consumer Group, 2025 and 2035
  • Figure 31: Latin America Market Y-o-Y Growth Comparison by Consumer Group, 2025-2035
  • Figure 32: Latin America Market Attractiveness Analysis by Consumer Group
  • Figure 33: Western Europe Market Value Share and BPS Analysis by Country, 2025 and 2035
  • Figure 34: Western Europe Market Value Share and BPS Analysis by Product Segment , 2025 and 2035
  • Figure 35: Western Europe Market Y-o-Y Growth Comparison by Product Segment , 2025-2035
  • Figure 36: Western Europe Market Attractiveness Analysis by Product Segment
  • Figure 37: Western Europe Market Value Share and BPS Analysis by Consumer Group, 2025 and 2035
  • Figure 38: Western Europe Market Y-o-Y Growth Comparison by Consumer Group, 2025-2035
  • Figure 39: Western Europe Market Attractiveness Analysis by Consumer Group
  • Figure 40: Eastern Europe Market Value Share and BPS Analysis by Country, 2025 and 2035
  • Figure 41: Eastern Europe Market Value Share and BPS Analysis by Product Segment , 2025 and 2035
  • Figure 42: Eastern Europe Market Y-o-Y Growth Comparison by Product Segment , 2025-2035
  • Figure 43: Eastern Europe Market Attractiveness Analysis by Product Segment
  • Figure 44: Eastern Europe Market Value Share and BPS Analysis by Consumer Group, 2025 and 2035
  • Figure 45: Eastern Europe Market Y-o-Y Growth Comparison by Consumer Group, 2025-2035
  • Figure 46: Eastern Europe Market Attractiveness Analysis by Consumer Group
  • Figure 47: East Asia Market Value Share and BPS Analysis by Country, 2025 and 2035
  • Figure 48: East Asia Market Value Share and BPS Analysis by Product Segment , 2025 and 2035
  • Figure 49: East Asia Market Y-o-Y Growth Comparison by Product Segment , 2025-2035
  • Figure 50: East Asia Market Attractiveness Analysis by Product Segment
  • Figure 51: East Asia Market Value Share and BPS Analysis by Consumer Group, 2025 and 2035
  • Figure 52: East Asia Market Y-o-Y Growth Comparison by Consumer Group, 2025-2035
  • Figure 53: East Asia Market Attractiveness Analysis by Consumer Group
  • Figure 54: South Asia and Pacific Market Value Share and BPS Analysis by Country, 2025 and 2035
  • Figure 55: South Asia and Pacific Market Value Share and BPS Analysis by Product Segment , 2025 and 2035
  • Figure 56: South Asia and Pacific Market Y-o-Y Growth Comparison by Product Segment , 2025-2035
  • Figure 57: South Asia and Pacific Market Attractiveness Analysis by Product Segment
  • Figure 58: South Asia and Pacific Market Value Share and BPS Analysis by Consumer Group, 2025 and 2035
  • Figure 59: South Asia and Pacific Market Y-o-Y Growth Comparison by Consumer Group, 2025-2035
  • Figure 60: South Asia and Pacific Market Attractiveness Analysis by Consumer Group
  • Figure 61: Middle East & Africa Market Value Share and BPS Analysis by Country, 2025 and 2035
  • Figure 62: Middle East & Africa Market Value Share and BPS Analysis by Product Segment , 2025 and 2035
  • Figure 63: Middle East & Africa Market Y-o-Y Growth Comparison by Product Segment , 2025-2035
  • Figure 64: Middle East & Africa Market Attractiveness Analysis by Product Segment
  • Figure 65: Middle East & Africa Market Value Share and BPS Analysis by Consumer Group, 2025 and 2035
  • Figure 66: Middle East & Africa Market Y-o-Y Growth Comparison by Consumer Group, 2025-2035
  • Figure 67: Middle East & Africa Market Attractiveness Analysis by Consumer Group
  • Figure 68: Global Market - Tier Structure Analysis
  • Figure 69: Global Market - Company Share Analysis

Frequently Asked Questions

How big is the second-hand apparel market in Europe in 2025?

The global second-hand apparel market in Europe is estimated to be valued at USD 18.6 billion in 2025.

What will be the size of second-hand apparel market in Europe in 2035?

The market size for the second-hand apparel market in Europe is projected to reach USD 39.1 billion by 2035.

How much will be the second-hand apparel market in Europe growth between 2025 and 2035?

The second-hand apparel market in Europe is expected to grow at a 7.7% CAGR between 2025 and 2035.

What are the key product types in the second-hand apparel market in Europe ?

The key product types in second-hand apparel market in Europe are dresses & tops, shirts & t-shirts, jeans & pants, sweater, coats & jackets and others.

Which consumer group segment to contribute significant share in the second-hand apparel market in Europe in 2025?

In terms of consumer group, women segment to command 55.1% share in the second-hand apparel market in Europe in 2025.

Explore Similar Insights

Future Market Insights

Second-hand Apparel Market in Europe

Chat With

MaRIA

Hi There, I am MaRIA, Your Market Research Intelligence Assistant. How may I help you?