Gym Apparel Market
Market Insights on Gym Apparel covering sales outlook, demand forecast & up-to-date key trends
Gym Apparel Market by Product Type, Material Type & Region - Forecast 2022 - 2032
Gym Apparel Market Outlook (2022-2032)
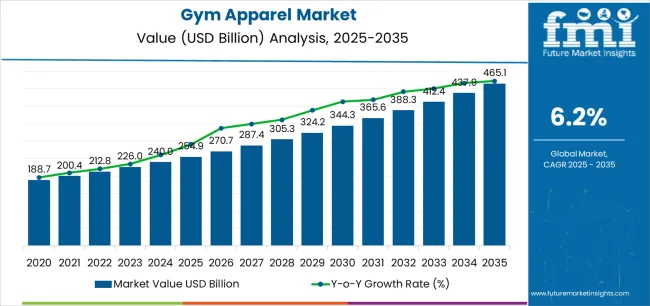
[333 Pages Report] The gym apparel market is predicted to grow at a moderate CAGR of 6.2% during the forecast period of 2022 to 2032. The global gym apparel market share is estimated to be worth about US$ 384.8 Billion by 2032 end, expanding from a net worth of US$ 204.5 Billion in 2021.
“With the growing subscription of gym membership in urban localities, the popularity of gym clothing has outspread from the sports clubs to common gym-goers and non-athletes, creating a highly opportune market for gym apparel products in the present age.”
Gym apparel or workout clothes are made out of special breathable material or fabric that maintains the body temperature for a pleasant experience at gyms. Calico, spandex and microfiber are some of the most widely sought fabric types, particularly responsible for the rapid expansion of gym apparel market share at different points.
Attributes |
Details |
Gym Apparel Market Size (2021) |
US$ 204.5 Billion |
Gym Apparel Market Share (2022) |
US$ 210.8 Billion |
Gym Apparel Market Share (2032) |
US$ 384.8 Billion |
Gym Apparel Market Growth Rate (2022-2032) |
6.2% |
Covid-19 Impact on the Global Gym Apparel Market
The unforeseen emergence of the Covid-19 epidemic prompted the imposition of strict lockdown laws in most parts of the world. Minimization of trans-border trade and shutting down of public places, including gyms and sports clubs, were the two fronts found to have a severe effect on the gym apparel market trends.
As recounted by the global market study on gym apparel products, the sales of gym apparel dropped down notably during the initial months of the Covid-19 pandemic. With that being said, this new market research report on gym apparel statistics elucidates some of the gainful implications of Covid-19 that proved to be instrumental in increasing the demand for gym apparel in the aftermath.
In response to the prolonging lockdown period, many individuals were encouraged to create a personal gym or join one in their locality. Such a surge in the number of people hitting the gym every day boosted the gym apparel market growth very shortly after the outbreak of the Covid-19 pandemic.
The previously witnessed CAGR was nearly 5.2%, as recorded by the gym apparel market survey covering the years 2017 to 2021. In time to come, the impetus for gym apparel adoption trends by the greater mass following the Covid-19 lockdown is expected to propel the gym apparel market future trends as well.
Let us know your requirement to get
100% FREE customization
What is the Future of Global Gym Apparel Market?
“Rising health concern amidst the globally disrupting Covid-19 infection cases was carried forward to the post pandemic period that is anticipated to be indirectly benefitting the gym apparel market trends and forecast.”
Youths worldwide leaning toward maintaining better physical fitness and maintaining good health have boosted the sales of gym apparel in recent years. Increment in disposable income of the large proportion of working group individuals has also enlarged the consumer base for fitness apparel and gym apparel market in various regions.
Swift expansion of urban areas around the world has favoured the establishment of more gyms and fitness clubs. A remarkable rise in gym subscriber count is predicted to also have enlarged the buyer base of the global gym apparel market. Many corporates and public institutions have established in-house gyms for their employees and members, which is anticipated drive the gym apparel market opportunities further.
A remarkable portion of the total sales of gym apparel is achieved over e-commerce platforms or online shopping websites. Proliferation in such modes of transactions with higher options of best workout clothes for men and women available to choose from is likely to boost the gym apparel market growth.
What are the Major Challenges Experienced by the Gym Apparel Market Players?
The higher cost of specially designed workout clothes is the major restraint in popularizing the product and gym apparel adoption trends in low-income regions. In line with this fact, the growing volume of low-quality and counterfeit gym wears or dry-fit clothes is surfacing as a major challenge for the global gym apparel market players supplying genuine products at a reasonable price.
No scope for customers to check the material quality of dry-fit clothes is a rare constraint that gym apparel market players face over online platforms in spite of it emerging as the fastest-growing distribution channel. Also, competing with the general apparel manufacturing companies supplying cheap athletic wear in bulk to the local market through their established outlets has also limited the gym apparel market growth.
Comparative View of Adjacent Gym Apparel Market
Gym Apparel Market:
Attributes |
Gym Apparel Market |
CAGR (2022 to 2032) |
5.6% |
Market Value (2027) |
US$ 276 Billion |
Growth Factor |
Rising number of gym goers with the increasingly aware young population. |
Future Opportunities |
Growing number of gyms and fitness centres at various localities. |
Market Trends |
Proliferation of e-commerce platforms have expanded the gym apparel market. |
Apparel and Leather Products Market:
Attributes |
Apparel and Leather Products Market |
CAGR (2022 to 2032) |
2.4% |
Market Value (2027) |
US$ 1.4 Trillion |
Growth Factor |
Burgeoning middle class with higher disposable income. |
Future Opportunities |
Digital advertising platforms for products and marketing to expand the consumer base. |
Market Trends |
Finding suitable products according to personal choices is getting easier over online sites. |
Luxury Fashion Market:
Attributes |
Luxury Fashion Market |
CAGR (2022 to 2032) |
5.5% |
Market Value (2027) |
US$ 160 Billion |
Growth Factor |
Growing trend among consumers to get associated with certain brand names. |
Future Opportunities |
Increasing count of internet and social media users to drive the demand further. |
Market Trends |
Growing popularity and sale of luxury items in Asia Pacific countries. |
Gym apparel manufacturers are incorporating new inventive elements into their products to suit the present needs pertaining to the budding trend of smart wear. Furthermore, the gym apparel industry is expected to benefit from different technical advances directed at improving the performance and comfort of the users. The introduction of smart nanotechnology fabric is regarded as one of the major breakthroughs for the emerging trends in the gym apparel market.
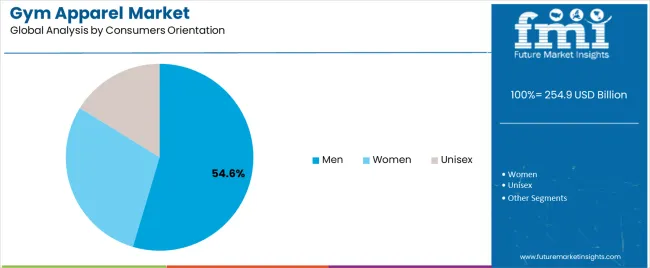
In the present time, particularly in third world countries, more women have started taking an interest in bodybuilding activities through the establishment of unisex gyms. Positive developments in this direction have resulted in exceptional growth in demand for workout clothes for women, especially in the long sleeve workout top section.
Government and international organizations carrying out development activities in developing nations are also encouraging the youths to participate in gyms. Such physical fitness drives are poised to provide some fresh opportunities for the gym apparel market segment in these regions.
Arrangement of competitions and events showcasing the benefits of working out and bodybuilding has had a similar impact in these countries and other areas as well. The growing popularity of such events is also predicted to turn out as a driving factor for gym apparel market key trends and opportunities.
Find your sweet spots for generating winning opportunities in this market.
Talk to AnalystWhat is the Growth Outlook for the Gym Apparel Market According to Different Segments?
“Workout sessions are particularly intense in sports and defence sector constituting them the major contributors of the gym apparel market trends since a very long time.”
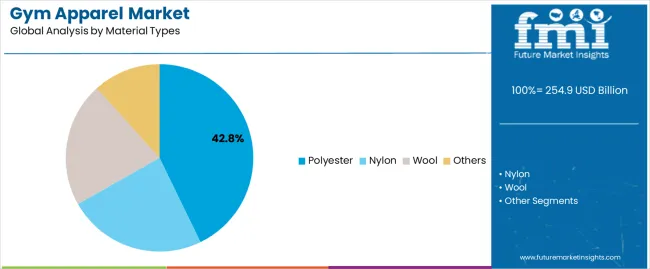
Different types of natural and artificial materials are integrated to achieve the right texture and feel of fabrics used for bodybuilding clothing. Polyester and nylon are the most widely used materials for this purpose, making them the largest segments of the global gym apparel market.
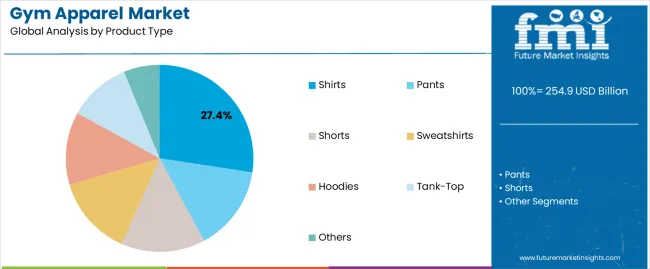
There has been an ample addition of new products into the gym attire creating new segments in the gym apparel market share that were not heard of before. However, gym clothes such as shorts, tank tops, sweatshirts & hoodies still remain the major contributing segment for the gym apparel market Share.
This segment is also expected to be the fastest-growing category of fitness apparel with a predicted CAGR of 4%, according to the gym apparel market analysis for the period following the year 2021. Other gym apparel product types like shirts and pants are surprising gaining popularity in the casual wear section, as evident from the new market research report on gym apparel.
Typically, direct sales and franchise stores are the most prevalent supply channels for different types of fitness apparel in the contemporary market. Contrarily, with the rapid expansion of internet users around the world, online retailers have started capturing the market and have taken into their purview the whole gym apparel market future trends.
How Different Regions are Performing for Gym Apparel Market?
North America has traditionally been the dominant region for the global gym apparel market owing to the presence of a large number of bigger players in the United States (US). The higher affluence of general citizens of this country with greater awareness about the benefits of working out is projected to retain the dominance of the US gym apparel market during the forecasted years of 2022 to 2032.
Currently, China and India have the largest proportion of young under the age group of 20 to 35, which has rendered the Asia Pacific region the most lucrative market for gym apparel items. It is witnessing an above-average growth rate for the gym apparel market owing to the improving economic condition of general citizens.
The Asia Pacific has also emerged as the major exporter of the global gym apparel market, with Japan and South Korea playing a crucial point in the international trade economy.

A unified Market Research Subscription Platform, built for today's disparate research needs.
How Strong is the Competitive Landscape for the Gym Apparel Market?
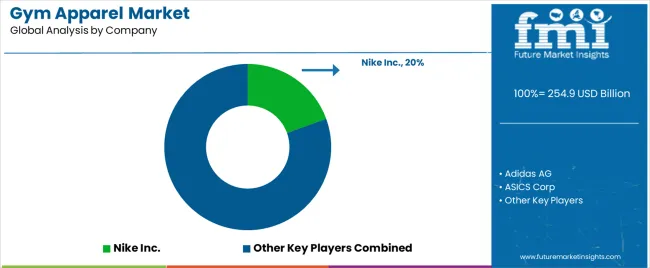
Due to the presence of a number of market players, the global gym apparel market has become fiercely competitive. Some of the prominent gym apparel market players have captured the major portion of the market. Nike workout clothes and Gymshark clothes are some the most popular products out there. Other big gym apparel brands that are quite popular in the present gym apparel market includes Adidas, Puma, Reebok, 2XU, Rhone, Asics, and Under Armour among others.
Recent Developments in the Gym Apparel Market
- Eastbay and Champs Sports released a new garment line, Eastbay performance in September 2021. Introduction of this new line is expected to augment the companies profile in compression tops, tights and tanks for training and casual purpose of gym junkies.
- Kappa is a leading Italian fashion brand and fibre manufacturer providing value chain solutions from textile mills to consumers. In October 2020, it collaborated with Hyosung to launch its new K-spirit e-sports and gym apparel collection at the venue of Tencent Global E-sports arena.
Key Gym Apparel Market Players
Key Segments
By Product Type:
- Shirts
- Pants
- Shorts
- Sweatshirts
- Hoodies
- Tank-top
- Others
By Material Type:
- Nylon
- Wool
- Polyester
- Others
By Consumer Orientation:
- Men
- Women
- Unisex
By Sales Channel:
- Direct Sales
- Franchised Stores
- Specialty Stores
- Online Retailers
- Mono Brand Stores
- Wholesalers or Retailers
- Other Sales Channel
By Region:
- North America
- Latin America
- Europe
- Asia Pacific
- Middle East and Africa (MEA)
Frequently Asked Questions
The global gym apparel market is estimated to record a CAGR of 6.2% during the forecast period of 2022 to 2032.
The global gym apparel market size is predicted to be valued at US$ 384.8 Billion by 2032.
The global gym apparel market share was valued at US$ 204.5 Billion in 2021.
North America accounts for the largest revenue share in the global gym apparel market.
Asia Pacific region is predicted to witness the highest CAGR in the gym apparel market.
Table of Content
1. Executive Summary
1.1. Global Market Outlook
1.2. Demand-side Trends
1.3. Supply-side Trends
1.4. Technology Roadmap Analysis
1.5. Analysis and Recommendations
2. Market Overview
2.1. Market Coverage / Taxonomy
2.2. Market Definition / Scope / Limitations
3. Market Background
3.1. Market Dynamics
3.1.1. Drivers
3.1.2. Restraints
3.1.3. Opportunity
3.1.4. Trends
3.2. Scenario Forecast
3.2.1. Demand in Optimistic Scenario
3.2.2. Demand in Likely Scenario
3.2.3. Demand in Conservative Scenario
3.3. Opportunity Map Analysis
3.4. Supply Chain Analysis
3.5. Investment Feasibility Matrix
3.6. Value Chain Analysis
3.6.1. Profit Margin Analysis
3.6.2. Wholesalers and Distributors
3.6.3. Retailers
3.7. PESTLE and Porter’s Analysis
4. Global Gym Apparel Market Analysis 2017-2021 and Forecast, 2022-2032
4.1. Historical Market Size Value (US$ Mn) & Volume (Units) Analysis, 2017-2021
4.2. Current and Future Market Size Value (US$ Mn) & Volume (Units) Projections, 2022-2032
4.2.1. Y-o-Y Growth Trend Analysis
4.2.2. Absolute $ Opportunity Analysis
5. Global Gym Apparel Market Analysis 2017-2021 and Forecast 2022-2032, By Product Type
5.1. Introduction / Key Findings
5.2. Historical Market Size Value (US$ Mn) & Volume (Units) Analysis By Product Type, 2017-2021
5.3. Current and Future Market Size Value (US$ Mn) & Volume (Units) Analysis and Forecast By Product Type, 2022-2032
5.3.1. Shirts
5.3.2. Pants
5.3.3. Others
5.4. Y-o-Y Growth Trend Analysis By Product Type, 2017-2021
5.5. Absolute $ Opportunity Analysis By Product Type, 2022-2032
6. Global Gym Apparel Market Analysis 2017-2021 and Forecast 2022-2032, By Material Type
6.1. Introduction / Key Findings
6.2. Historical Market Size Value (US$ Mn) & Volume (Units) Analysis By Material Type, 2017-2021
6.3. Current and Future Market Size Value (US$ Mn) & Volume (Units) Analysis and Forecast By Material Type, 2022-2032
6.3.1. Nylon
6.3.2. Wool
6.3.3. Polyester
6.3.4. Others
6.4. Y-o-Y Growth Trend Analysis By Material Type, 2017-2021
6.5. Absolute $ Opportunity Analysis By Material Type, 2022-2032
7. Global Gym Apparel Market Analysis 2017-2021 and Forecast 2022-2032, By Consumer Orientation
7.1. Introduction / Key Findings
7.2. Historical Market Size Value (US$ Mn) & Volume (Units) Analysis By Consumer Orientation, 2017-2021
7.3. Current and Future Market Size Value (US$ Mn) & Volume (Units) Analysis and Forecast By Consumer Orientation, 2022-2032
7.3.1. Men
7.3.2. Women
7.3.3. Unisex
7.4. Y-o-Y Growth Trend Analysis By Consumer Orientation, 2017-2021
7.5. Absolute $ Opportunity Analysis By Consumer Orientation, 2022-2032
8. Global Gym Apparel Market Analysis 2017-2021 and Forecast 2022-2032, By Sales Channel
8.1. Introduction / Key Findings
8.2. Historical Market Size Value (US$ Mn) & Volume (Units) Analysis By Sales Channel, 2017-2021
8.3. Current and Future Market Size Value (US$ Mn) & Volume (Units) Analysis and Forecast By Sales Channel, 2022-2032
8.3.1. Direct Sales
8.3.2. Franchise Stores
8.3.3. Specialty Stores
8.3.4. Online Retailers
8.3.5. Other Sales Channel
8.4. Y-o-Y Growth Trend Analysis By Sales Channel, 2017-2021
8.5. Absolute $ Opportunity Analysis By Sales Channel, 2022-2032
9. Global Gym Apparel Market Analysis 2017-2021 and Forecast 2022-2032, By Region
9.1. Introduction
9.2. Historical Market Size Value (US$ Mn) & Volume (Units) Analysis By Region, 2017-2021
9.3. Current Market Size Value (US$ Mn) & Volume (Units) Analysis and Forecast By Region, 2022-2032
9.3.1. North America
9.3.2. Latin America
9.3.3. Europe
9.3.4. East Asia
9.3.5. South Asia
9.3.6. Oceania
9.3.7. MEA
9.4. Market Attractiveness Analysis By Region
10. North America Gym Apparel Market Analysis 2017-2021 and Forecast 2022-2032, By Country
10.1. Historical Market Size Value (US$ Mn) & Volume (Units) Trend Analysis By Market Taxonomy, 2017-2021
10.2. Market Size Value (US$ Mn) & Volume (Units) Forecast By Market Taxonomy, 2022-2032
10.2.1. By Country
10.2.1.1. U.S.
10.2.1.2. Canada
10.2.2. By Product Type
10.2.3. By Material Type
10.2.4. By Consumer Orientation
10.2.5. By Sales Channel
10.3. Market Attractiveness Analysis
10.3.1. By Country
10.3.2. By Product Type
10.3.3. By Material Type
10.3.4. By Consumer Orientation
10.3.5. By Sales Channel
10.4. Key Takeaways
11. Latin America Gym Apparel Market Analysis 2017-2021 and Forecast 2022-2032, By Country
11.1. Historical Market Size Value (US$ Mn) & Volume (Units) Trend Analysis By Market Taxonomy, 2017-2021
11.2. Market Size Value (US$ Mn) & Volume (Units) Forecast By Market Taxonomy, 2022-2032
11.2.1. By Country
11.2.1.1. Brazil
11.2.1.2. Mexico
11.2.1.3. Argentina
11.2.1.4. Rest of Latin America
11.2.2. By Product Type
11.2.3. By Material Type
11.2.4. By Consumer Orientation
11.2.5. By Sales Channel
11.3. Market Attractiveness Analysis
11.3.1. By Country
11.3.2. By Product Type
11.3.3. By Material Type
11.3.4. By Consumer Orientation
11.3.5. By Sales Channel
11.4. Key Takeaways
12. Europe Gym Apparel Market Analysis 2017-2021 and Forecast 2022-2032, By Country
12.1. Historical Market Size Value (US$ Mn) & Volume (Units) Trend Analysis By Market Taxonomy, 2017-2021
12.2. Market Size Value (US$ Mn) & Volume (Units) Forecast By Market Taxonomy, 2022-2032
12.2.1. By Country
12.2.1.1. Germany
12.2.1.2. Italy
12.2.1.3. France
12.2.1.4. U.K.
12.2.1.5. Spain
12.2.1.6. Russia
12.2.1.7. BENELUX
12.2.1.8. Rest of Europe
12.2.2. By Product Type
12.2.3. By Material Type
12.2.4. By Consumer Orientation
12.2.5. By Sales Channel
12.3. Market Attractiveness Analysis
12.3.1. By Country
12.3.2. By Product Type
12.3.3. By Material Type
12.3.4. By Consumer Orientation
12.3.5. By Sales Channel
12.4. Key Takeaways
13. East Asia Gym Apparel Market Analysis 2017-2021 and Forecast 2022-2032, By Country
13.1. Historical Market Size Value (US$ Mn) & Volume (Units) Trend Analysis By Market Taxonomy, 2017-2021
13.2. Market Size Value (US$ Mn) & Volume (Units) Forecast By Market Taxonomy, 2022-2032
13.2.1. By Country
13.2.1.1. China
13.2.1.2. Japan
13.2.1.3. South Korea
13.2.2. By Product Type
13.2.3. By Material Type
13.2.4. By Consumer Orientation
13.2.5. By Sales Channel
13.3. Market Attractiveness Analysis
13.3.1. By Country
13.3.2. By Product Type
13.3.3. By Material Type
13.3.4. By Consumer Orientation
13.3.5. By Sales Channel
13.4. Key Takeaways
14. South Asia Gym Apparel Market Analysis 2017-2021 and Forecast 2022-2032, By Country
14.1. Historical Market Size Value (US$ Mn) & Volume (Units) Trend Analysis By Market Taxonomy, 2017-2021
14.2. Market Size Value (US$ Mn) & Volume (Units) Forecast By Market Taxonomy, 2022-2032
14.2.1. By Country
14.2.1.1. India
14.2.1.2. Thailand
14.2.1.3. Malaysia
14.2.1.4. Indonesia
14.2.1.5. Rest of South Asia
14.2.2. By Product Type
14.2.3. By Material Type
14.2.4. By Consumer Orientation
14.2.5. By Sales Channel
14.3. Market Attractiveness Analysis
14.3.1. By Country
14.3.2. By Product Type
14.3.3. By Material Type
14.3.4. By Consumer Orientation
14.3.5. By Sales Channel
14.4. Key Takeaways
15. Oceania Gym Apparel Market Analysis 2017-2021 and Forecast 2022-2032, By Country
15.1. Historical Market Size Value (US$ Mn) & Volume (Units) Trend Analysis By Market Taxonomy, 2017-2021
15.2. Market Size Value (US$ Mn) & Volume (Units) Forecast By Market Taxonomy, 2022-2032
15.2.1. By Country
15.2.1.1. Australia
15.2.1.2. New Zealand
15.2.2. By Product Type
15.2.3. By Material Type
15.2.4. By Consumer Orientation
15.2.5. By Sales Channel
15.3. Market Attractiveness Analysis
15.3.1. By Country
15.3.2. By Product Type
15.3.3. By Material Type
15.3.4. By Consumer Orientation
15.3.5. By Sales Channel
15.4. Key Takeaways
16. MEA Gym Apparel Market Analysis 2017-2021 and Forecast 2022-2032, By Country
16.1. Historical Market Size Value (US$ Mn) & Volume (Units) Trend Analysis By Market Taxonomy, 2017-2021
16.2. Market Size Value (US$ Mn) & Volume (Units) Forecast By Market Taxonomy, 2022-2032
16.2.1. By Country
16.2.1.1. GCC
16.2.1.2. South Africa
16.2.1.3. North Africa
16.2.1.4. Rest of MEA
16.2.2. By Product Type
16.2.3. By Material Type
16.2.4. By Consumer Orientation
16.2.5. By Sales Channel
16.3. Market Attractiveness Analysis
16.3.1. By Country
16.3.2. By Product Type
16.3.3. By Material Type
16.3.4. By Consumer Orientation
16.3.5. By Sales Channel
16.4. Key Takeaways
17. Key Countries Gym Apparel Market Analysis
17.1. U.S.
17.1.1. Pricing Analysis
17.1.2. Market Share Analysis, 2021
17.1.2.1. By Product Type
17.1.2.2. By Material Type
17.1.2.3. By Consumer Orientation
17.1.2.4. By Sales Channel
17.2. Canada
17.2.1. Pricing Analysis
17.2.2. Market Share Analysis, 2021
17.2.2.1. By Product Type
17.2.2.2. By Material Type
17.2.2.3. By Consumer Orientation
17.2.2.4. By Sales Channel
17.3. Brazil
17.3.1. Pricing Analysis
17.3.2. Market Share Analysis, 2021
17.3.2.1. By Product Type
17.3.2.2. By Material Type
17.3.2.3. By Consumer Orientation
17.3.2.4. By Sales Channel
17.4. Mexico
17.4.1. Pricing Analysis
17.4.2. Market Share Analysis, 2021
17.4.2.1. By Product Type
17.4.2.2. By Material Type
17.4.2.3. By Consumer Orientation
17.4.2.4. By Sales Channel
17.5. Argentina
17.5.1. Pricing Analysis
17.5.2. Market Share Analysis, 2021
17.5.2.1. By Product Type
17.5.2.2. By Material Type
17.5.2.3. By Consumer Orientation
17.5.2.4. By Sales Channel
17.6. UK
17.6.1. Pricing Analysis
17.6.2. Market Share Analysis, 2021
17.6.2.1. By Product Type
17.6.2.2. By Material Type
17.6.2.3. By Consumer Orientation
17.6.2.4. By Sales Channel
17.7. Germany
17.7.1. Pricing Analysis
17.7.2. Market Share Analysis, 2021
17.7.2.1. By Product Type
17.7.2.2. By Material Type
17.7.2.3. By Consumer Orientation
17.7.2.4. By Sales Channel
17.8. Italy
17.8.1. Pricing Analysis
17.8.2. Market Share Analysis, 2021
17.8.2.1. By Product Type
17.8.2.2. By Material Type
17.8.2.3. By Consumer Orientation
17.8.2.4. By Sales Channel
17.9. Spain
17.9.1. Pricing Analysis
17.9.2. Market Share Analysis, 2021
17.9.2.1. By Product Type
17.9.2.2. By Material Type
17.9.2.3. By Consumer Orientation
17.9.2.4. By Sales Channel
17.10. France
17.10.1. Pricing Analysis
17.10.2. Market Share Analysis, 2021
17.10.2.1. By Product Type
17.10.2.2. By Material Type
17.10.2.3. By Consumer Orientation
17.10.2.4. By Sales Channel
17.11. Australia
17.11.1. Pricing Analysis
17.11.2. Market Share Analysis, 2021
17.11.2.1. By Product Type
17.11.2.2. By Material Type
17.11.2.3. By Consumer Orientation
17.11.2.4. By Sales Channel
17.12. New Zealand
17.12.1. Pricing Analysis
17.12.2. Market Share Analysis, 2021
17.12.2.1. By Product Type
17.12.2.2. By Material Type
17.12.2.3. By Consumer Orientation
17.12.2.4. By Sales Channel
17.13. India
17.13.1. Pricing Analysis
17.13.2. Market Share Analysis, 2021
17.13.2.1. By Product Type
17.13.2.2. By Material Type
17.13.2.3. By Consumer Orientation
17.13.2.4. By Sales Channel
17.14. Thailand
17.14.1. Pricing Analysis
17.14.2. Market Share Analysis, 2021
17.14.2.1. By Product Type
17.14.2.2. By Material Type
17.14.2.3. By Consumer Orientation
17.14.2.4. By Sales Channel
17.15. Indonesia
17.15.1. Pricing Analysis
17.15.2. Market Share Analysis, 2021
17.15.2.1. By Product Type
17.15.2.2. By Material Type
17.15.2.3. By Consumer Orientation
17.15.2.4. By Sales Channel
17.16. China
17.16.1. Pricing Analysis
17.16.2. Market Share Analysis, 2021
17.16.2.1. By Product Type
17.16.2.2. By Material Type
17.16.2.3. By Consumer Orientation
17.16.2.4. By Sales Channel
17.17. Japan
17.17.1. Pricing Analysis
17.17.2. Market Share Analysis, 2021
17.17.2.1. By Product Type
17.17.2.2. By Material Type
17.17.2.3. By Consumer Orientation
17.17.2.4. By Sales Channel
17.18. South Korea
17.18.1. Pricing Analysis
17.18.2. Market Share Analysis, 2021
17.18.2.1. By Product Type
17.18.2.2. By Material Type
17.18.2.3. By Consumer Orientation
17.18.2.4. By Sales Channel
17.19. GCC Countries
17.19.1. Pricing Analysis
17.19.2. Market Share Analysis, 2021
17.19.2.1. By Product Type
17.19.2.2. By Material Type
17.19.2.3. By Consumer Orientation
17.19.2.4. By Sales Channel
18. Market Structure Analysis
18.1. Competition Dashboard
18.2. Competition Benchmarking
18.3. Market Share Analysis of Top Players
18.3.1. By Regional
18.3.2. By Product Type
18.3.3. By Material Type
18.3.4. By Consumer Orientation
18.3.5. By Sales Channel
19. Competition Analysis
19.1. Competition Deep Dive
19.1.1. Nike Inc
19.1.1.1. Overview
19.1.1.2. Product Portfolio
19.1.1.3. Sales Footprint
19.1.1.4. Strategy Overview
19.1.1.4.1. Marketing Strategy
19.1.1.4.2. Product Strategy
19.1.1.4.3. Channel Strategy
19.1.2. Adidas AG
19.1.2.1. Overview
19.1.2.2. Product Portfolio
19.1.2.3. Sales Footprint
19.1.2.4. Strategy Overview
19.1.2.4.1. Marketing Strategy
19.1.2.4.2. Product Strategy
19.1.2.4.3. Channel Strategy
19.1.3. Dick's Sports Goods
19.1.3.1. Overview
19.1.3.2. Product Portfolio
19.1.3.3. Sales Footprint
19.1.3.4. Strategy Overview
19.1.3.4.1. Marketing Strategy
19.1.3.4.2. Product Strategy
19.1.3.4.3. Channel Strategy
19.1.4. PUMA SE
19.1.4.1. Overview
19.1.4.2. Product Portfolio
19.1.4.3. Sales Footprint
19.1.4.4. Strategy Overview
19.1.4.4.1. Marketing Strategy
19.1.4.4.2. Product Strategy
19.1.4.4.3. Channel Strategy
19.1.5. Columbia Sports
19.1.5.1. Overview
19.1.5.2. Product Portfolio
19.1.5.3. Sales Footprint
19.1.5.4. Strategy Overview
19.1.5.4.1. Marketing Strategy
19.1.5.4.2. Product Strategy
19.1.5.4.3. Channel Strategy
19.1.6. ASICS Corp
19.1.6.1. Overview
19.1.6.2. Product Portfolio
19.1.6.3. Sales Footprint
19.1.6.4. Strategy Overview
19.1.6.4.1. Marketing Strategy
19.1.6.4.2. Product Strategy
19.1.6.4.3. Channel Strategy
19.1.7. VF Corporation
19.1.7.1. Overview
19.1.7.2. Product Portfolio
19.1.7.3. Sales Footprint
19.1.7.4. Strategy Overview
19.1.7.4.1. Marketing Strategy
19.1.7.4.2. Product Strategy
19.1.7.4.3. Channel Strategy
19.1.8. PVH Corporation
19.1.8.1. Overview
19.1.8.2. Product Portfolio
19.1.8.3. Sales Footprint
19.1.8.4. Strategy Overview
19.1.8.4.1. Marketing Strategy
19.1.8.4.2. Product Strategy
19.1.8.4.3. Channel Strategy
19.1.9. G-III Apparel Group Limited
19.1.9.1. Overview
19.1.9.2. Product Portfolio
19.1.9.3. Sales Footprint
19.1.9.4. Strategy Overview
19.1.9.4.1. Marketing Strategy
19.1.9.4.2. Product Strategy
19.1.9.4.3. Channel Strategy
19.1.10. Gildan Activewear Inc
19.1.10.1. Overview
19.1.10.2. Product Portfolio
19.1.10.3. Sales Footprint
19.1.10.4. Strategy Overview
19.1.10.4.1. Marketing Strategy
19.1.10.4.2. Product Strategy
19.1.10.4.3. Channel Strategy
19.1.11. Hanes Brands Inc
19.1.11.1. Overview
19.1.11.2. Product Portfolio
19.1.11.3. Sales Footprint
19.1.11.4. Strategy Overview
19.1.11.4.1. Marketing Strategy
19.1.11.4.2. Product Strategy
19.1.11.4.3. Channel Strategy
19.1.12. Patagonia Inc
19.1.12.1. Overview
19.1.12.2. Product Portfolio
19.1.12.3. Sales Footprint
19.1.12.4. Strategy Overview
19.1.12.4.1. Marketing Strategy
19.1.12.4.2. Product Strategy
19.1.12.4.3. Channel Strategy
20. Assumptions & Acronyms Used
21. Research Methodology
Let us know your requirement to get
100% FREE customization
List of Tables
Table 1: Global Gym Apparel Market Value (US$ Mn) Forecast by Region, 2017-2032
Table 2: Global Gym Apparel Market Volume (Units) Forecast by Region, 2017-2032
Table 3: Global Gym Apparel Market Value (US$ Mn) Forecast by Product Type, 2017-2032
Table 4: Global Gym Apparel Market Volume (Units) Forecast by Product Type, 2017-2032
Table 5: Global Gym Apparel Market Value (US$ Mn) Forecast by Material Type, 2017-2032
Table 6: Global Gym Apparel Market Volume (Units) Forecast by Material Type, 2017-2032
Table 7: Global Gym Apparel Market Value (US$ Mn) Forecast by Consumer Orientation, 2017-2032
Table 8: Global Gym Apparel Market Volume (Units) Forecast by Consumer Orientation, 2017-2032
Table 9: Global Gym Apparel Market Value (US$ Mn) Forecast by Sales Channel, 2017-2032
Table 10: Global Gym Apparel Market Volume (Units) Forecast by Sales Channel, 2017-2032
Table 11: North America Gym Apparel Market Value (US$ Mn) Forecast by Country, 2017-2032
Table 12: North America Gym Apparel Market Volume (Units) Forecast by Country, 2017-2032
Table 13: North America Gym Apparel Market Value (US$ Mn) Forecast by Product Type, 2017-2032
Table 14: North America Gym Apparel Market Volume (Units) Forecast by Product Type, 2017-2032
Table 15: North America Gym Apparel Market Value (US$ Mn) Forecast by Material Type, 2017-2032
Table 16: North America Gym Apparel Market Volume (Units) Forecast by Material Type, 2017-2032
Table 17: North America Gym Apparel Market Value (US$ Mn) Forecast by Consumer Orientation, 2017-2032
Table 18: North America Gym Apparel Market Volume (Units) Forecast by Consumer Orientation, 2017-2032
Table 19: North America Gym Apparel Market Value (US$ Mn) Forecast by Sales Channel, 2017-2032
Table 20: North America Gym Apparel Market Volume (Units) Forecast by Sales Channel, 2017-2032
Table 21: Latin America Gym Apparel Market Value (US$ Mn) Forecast by Country, 2017-2032
Table 22: Latin America Gym Apparel Market Volume (Units) Forecast by Country, 2017-2032
Table 23: Latin America Gym Apparel Market Value (US$ Mn) Forecast by Product Type, 2017-2032
Table 24: Latin America Gym Apparel Market Volume (Units) Forecast by Product Type, 2017-2032
Table 25: Latin America Gym Apparel Market Value (US$ Mn) Forecast by Material Type, 2017-2032
Table 26: Latin America Gym Apparel Market Volume (Units) Forecast by Material Type, 2017-2032
Table 27: Latin America Gym Apparel Market Value (US$ Mn) Forecast by Consumer Orientation, 2017-2032
Table 28: Latin America Gym Apparel Market Volume (Units) Forecast by Consumer Orientation, 2017-2032
Table 29: Latin America Gym Apparel Market Value (US$ Mn) Forecast by Sales Channel, 2017-2032
Table 30: Latin America Gym Apparel Market Volume (Units) Forecast by Sales Channel, 2017-2032
Table 31: Europe Gym Apparel Market Value (US$ Mn) Forecast by Country, 2017-2032
Table 32: Europe Gym Apparel Market Volume (Units) Forecast by Country, 2017-2032
Table 33: Europe Gym Apparel Market Value (US$ Mn) Forecast by Product Type, 2017-2032
Table 34: Europe Gym Apparel Market Volume (Units) Forecast by Product Type, 2017-2032
Table 35: Europe Gym Apparel Market Value (US$ Mn) Forecast by Material Type, 2017-2032
Table 36: Europe Gym Apparel Market Volume (Units) Forecast by Material Type, 2017-2032
Table 37: Europe Gym Apparel Market Value (US$ Mn) Forecast by Consumer Orientation, 2017-2032
Table 38: Europe Gym Apparel Market Volume (Units) Forecast by Consumer Orientation, 2017-2032
Table 39: Europe Gym Apparel Market Value (US$ Mn) Forecast by Sales Channel, 2017-2032
Table 40: Europe Gym Apparel Market Volume (Units) Forecast by Sales Channel, 2017-2032
Table 41: East Asia Gym Apparel Market Value (US$ Mn) Forecast by Country, 2017-2032
Table 42: East Asia Gym Apparel Market Volume (Units) Forecast by Country, 2017-2032
Table 43: East Asia Gym Apparel Market Value (US$ Mn) Forecast by Product Type, 2017-2032
Table 44: East Asia Gym Apparel Market Volume (Units) Forecast by Product Type, 2017-2032
Table 45: East Asia Gym Apparel Market Value (US$ Mn) Forecast by Material Type, 2017-2032
Table 46: East Asia Gym Apparel Market Volume (Units) Forecast by Material Type, 2017-2032
Table 47: East Asia Gym Apparel Market Value (US$ Mn) Forecast by Consumer Orientation, 2017-2032
Table 48: East Asia Gym Apparel Market Volume (Units) Forecast by Consumer Orientation, 2017-2032
Table 49: East Asia Gym Apparel Market Value (US$ Mn) Forecast by Sales Channel, 2017-2032
Table 50: East Asia Gym Apparel Market Volume (Units) Forecast by Sales Channel, 2017-2032
Table 51: South Asia Gym Apparel Market Value (US$ Mn) Forecast by Country, 2017-2032
Table 52: South Asia Gym Apparel Market Volume (Units) Forecast by Country, 2017-2032
Table 53: South Asia Gym Apparel Market Value (US$ Mn) Forecast by Product Type, 2017-2032
Table 54: South Asia Gym Apparel Market Volume (Units) Forecast by Product Type, 2017-2032
Table 55: South Asia Gym Apparel Market Value (US$ Mn) Forecast by Material Type, 2017-2032
Table 56: South Asia Gym Apparel Market Volume (Units) Forecast by Material Type, 2017-2032
Table 57: South Asia Gym Apparel Market Value (US$ Mn) Forecast by Consumer Orientation, 2017-2032
Table 58: South Asia Gym Apparel Market Volume (Units) Forecast by Consumer Orientation, 2017-2032
Table 59: South Asia Gym Apparel Market Value (US$ Mn) Forecast by Sales Channel, 2017-2032
Table 60: South Asia Gym Apparel Market Volume (Units) Forecast by Sales Channel, 2017-2032
Table 61: Oceania Gym Apparel Market Value (US$ Mn) Forecast by Country, 2017-2032
Table 62: Oceania Gym Apparel Market Volume (Units) Forecast by Country, 2017-2032
Table 63: Oceania Gym Apparel Market Value (US$ Mn) Forecast by Product Type, 2017-2032
Table 64: Oceania Gym Apparel Market Volume (Units) Forecast by Product Type, 2017-2032
Table 65: Oceania Gym Apparel Market Value (US$ Mn) Forecast by Material Type, 2017-2032
Table 66: Oceania Gym Apparel Market Volume (Units) Forecast by Material Type, 2017-2032
Table 67: Oceania Gym Apparel Market Value (US$ Mn) Forecast by Consumer Orientation, 2017-2032
Table 68: Oceania Gym Apparel Market Volume (Units) Forecast by Consumer Orientation, 2017-2032
Table 69: Oceania Gym Apparel Market Value (US$ Mn) Forecast by Sales Channel, 2017-2032
Table 70: Oceania Gym Apparel Market Volume (Units) Forecast by Sales Channel, 2017-2032
Table 71: MEA Gym Apparel Market Value (US$ Mn) Forecast by Country, 2017-2032
Table 72: MEA Gym Apparel Market Volume (Units) Forecast by Country, 2017-2032
Table 73: MEA Gym Apparel Market Value (US$ Mn) Forecast by Product Type, 2017-2032
Table 74: MEA Gym Apparel Market Volume (Units) Forecast by Product Type, 2017-2032
Table 75: MEA Gym Apparel Market Value (US$ Mn) Forecast by Material Type, 2017-2032
Table 76: MEA Gym Apparel Market Volume (Units) Forecast by Material Type, 2017-2032
Table 77: MEA Gym Apparel Market Value (US$ Mn) Forecast by Consumer Orientation, 2017-2032
Table 78: MEA Gym Apparel Market Volume (Units) Forecast by Consumer Orientation, 2017-2032
Table 79: MEA Gym Apparel Market Value (US$ Mn) Forecast by Sales Channel, 2017-2032
Table 80: MEA Gym Apparel Market Volume (Units) Forecast by Sales Channel, 2017-2032
Find your sweet spots for generating winning opportunities in this market.
Talk to AnalystList of Charts
Figure 1: Global Gym Apparel Market Value (US$ Mn) by Product Type, 2022-2032
Figure 2: Global Gym Apparel Market Value (US$ Mn) by Material Type, 2022-2032
Figure 3: Global Gym Apparel Market Value (US$ Mn) by Consumer Orientation, 2022-2032
Figure 4: Global Gym Apparel Market Value (US$ Mn) by Sales Channel, 2022-2032
Figure 5: Global Gym Apparel Market Value (US$ Mn) by Region, 2022-2032
Figure 6: Global Gym Apparel Market Value (US$ Mn) Analysis by Region, 2017-2032
Figure 7: Global Gym Apparel Market Volume (Units) Analysis by Region, 2017-2032
Figure 8: Global Gym Apparel Market Value Share (%) and BPS Analysis by Region, 2022-2032
Figure 9: Global Gym Apparel Market Y-o-Y Growth (%) Projections by Region, 2022-2032
Figure 10: Global Gym Apparel Market Value (US$ Mn) Analysis by Product Type, 2017-2032
Figure 11: Global Gym Apparel Market Volume (Units) Analysis by Product Type, 2017-2032
Figure 12: Global Gym Apparel Market Value Share (%) and BPS Analysis by Product Type, 2022-2032
Figure 13: Global Gym Apparel Market Y-o-Y Growth (%) Projections by Product Type, 2022-2032
Figure 14: Global Gym Apparel Market Value (US$ Mn) Analysis by Material Type, 2017-2032
Figure 15: Global Gym Apparel Market Volume (Units) Analysis by Material Type, 2017-2032
Figure 16: Global Gym Apparel Market Value Share (%) and BPS Analysis by Material Type, 2022-2032
Figure 17: Global Gym Apparel Market Y-o-Y Growth (%) Projections by Material Type, 2022-2032
Figure 18: Global Gym Apparel Market Value (US$ Mn) Analysis by Consumer Orientation, 2017-2032
Figure 19: Global Gym Apparel Market Volume (Units) Analysis by Consumer Orientation, 2017-2032
Figure 20: Global Gym Apparel Market Value Share (%) and BPS Analysis by Consumer Orientation, 2022-2032
Figure 21: Global Gym Apparel Market Y-o-Y Growth (%) Projections by Consumer Orientation, 2022-2032
Figure 22: Global Gym Apparel Market Value (US$ Mn) Analysis by Sales Channel, 2017-2032
Figure 23: Global Gym Apparel Market Volume (Units) Analysis by Sales Channel, 2017-2032
Figure 24: Global Gym Apparel Market Value Share (%) and BPS Analysis by Sales Channel, 2022-2032
Figure 25: Global Gym Apparel Market Y-o-Y Growth (%) Projections by Sales Channel, 2022-2032
Figure 26: Global Gym Apparel Market Attractiveness by Product Type, 2022-2032
Figure 27: Global Gym Apparel Market Attractiveness by Material Type, 2022-2032
Figure 28: Global Gym Apparel Market Attractiveness by Consumer Orientation, 2022-2032
Figure 29: Global Gym Apparel Market Attractiveness by Sales Channel, 2022-2032
Figure 30: Global Gym Apparel Market Attractiveness by Region, 2022-2032
Figure 31: North America Gym Apparel Market Value (US$ Mn) by Product Type, 2022-2032
Figure 32: North America Gym Apparel Market Value (US$ Mn) by Material Type, 2022-2032
Figure 33: North America Gym Apparel Market Value (US$ Mn) by Consumer Orientation, 2022-2032
Figure 34: North America Gym Apparel Market Value (US$ Mn) by Sales Channel, 2022-2032
Figure 35: North America Gym Apparel Market Value (US$ Mn) by Country, 2022-2032
Figure 36: North America Gym Apparel Market Value (US$ Mn) Analysis by Country, 2017-2032
Figure 37: North America Gym Apparel Market Volume (Units) Analysis by Country, 2017-2032
Figure 38: North America Gym Apparel Market Value Share (%) and BPS Analysis by Country, 2022-2032
Figure 39: North America Gym Apparel Market Y-o-Y Growth (%) Projections by Country, 2022-2032
Figure 40: North America Gym Apparel Market Value (US$ Mn) Analysis by Product Type, 2017-2032
Figure 41: North America Gym Apparel Market Volume (Units) Analysis by Product Type, 2017-2032
Figure 42: North America Gym Apparel Market Value Share (%) and BPS Analysis by Product Type, 2022-2032
Figure 43: North America Gym Apparel Market Y-o-Y Growth (%) Projections by Product Type, 2022-2032
Figure 44: North America Gym Apparel Market Value (US$ Mn) Analysis by Material Type, 2017-2032
Figure 45: North America Gym Apparel Market Volume (Units) Analysis by Material Type, 2017-2032
Figure 46: North America Gym Apparel Market Value Share (%) and BPS Analysis by Material Type, 2022-2032
Figure 47: North America Gym Apparel Market Y-o-Y Growth (%) Projections by Material Type, 2022-2032
Figure 48: North America Gym Apparel Market Value (US$ Mn) Analysis by Consumer Orientation, 2017-2032
Figure 49: North America Gym Apparel Market Volume (Units) Analysis by Consumer Orientation, 2017-2032
Figure 50: North America Gym Apparel Market Value Share (%) and BPS Analysis by Consumer Orientation, 2022-2032
Figure 51: North America Gym Apparel Market Y-o-Y Growth (%) Projections by Consumer Orientation, 2022-2032
Figure 52: North America Gym Apparel Market Value (US$ Mn) Analysis by Sales Channel, 2017-2032
Figure 53: North America Gym Apparel Market Volume (Units) Analysis by Sales Channel, 2017-2032
Figure 54: North America Gym Apparel Market Value Share (%) and BPS Analysis by Sales Channel, 2022-2032
Figure 55: North America Gym Apparel Market Y-o-Y Growth (%) Projections by Sales Channel, 2022-2032
Figure 56: North America Gym Apparel Market Attractiveness by Product Type, 2022-2032
Figure 57: North America Gym Apparel Market Attractiveness by Material Type, 2022-2032
Figure 58: North America Gym Apparel Market Attractiveness by Consumer Orientation, 2022-2032
Figure 59: North America Gym Apparel Market Attractiveness by Sales Channel, 2022-2032
Figure 60: North America Gym Apparel Market Attractiveness by Country, 2022-2032
Figure 61: Latin America Gym Apparel Market Value (US$ Mn) by Product Type, 2022-2032
Figure 62: Latin America Gym Apparel Market Value (US$ Mn) by Material Type, 2022-2032
Figure 63: Latin America Gym Apparel Market Value (US$ Mn) by Consumer Orientation, 2022-2032
Figure 64: Latin America Gym Apparel Market Value (US$ Mn) by Sales Channel, 2022-2032
Figure 65: Latin America Gym Apparel Market Value (US$ Mn) by Country, 2022-2032
Figure 66: Latin America Gym Apparel Market Value (US$ Mn) Analysis by Country, 2017-2032
Figure 67: Latin America Gym Apparel Market Volume (Units) Analysis by Country, 2017-2032
Figure 68: Latin America Gym Apparel Market Value Share (%) and BPS Analysis by Country, 2022-2032
Figure 69: Latin America Gym Apparel Market Y-o-Y Growth (%) Projections by Country, 2022-2032
Figure 70: Latin America Gym Apparel Market Value (US$ Mn) Analysis by Product Type, 2017-2032
Figure 71: Latin America Gym Apparel Market Volume (Units) Analysis by Product Type, 2017-2032
Figure 72: Latin America Gym Apparel Market Value Share (%) and BPS Analysis by Product Type, 2022-2032
Figure 73: Latin America Gym Apparel Market Y-o-Y Growth (%) Projections by Product Type, 2022-2032
Figure 74: Latin America Gym Apparel Market Value (US$ Mn) Analysis by Material Type, 2017-2032
Figure 75: Latin America Gym Apparel Market Volume (Units) Analysis by Material Type, 2017-2032
Figure 76: Latin America Gym Apparel Market Value Share (%) and BPS Analysis by Material Type, 2022-2032
Figure 77: Latin America Gym Apparel Market Y-o-Y Growth (%) Projections by Material Type, 2022-2032
Figure 78: Latin America Gym Apparel Market Value (US$ Mn) Analysis by Consumer Orientation, 2017-2032
Figure 79: Latin America Gym Apparel Market Volume (Units) Analysis by Consumer Orientation, 2017-2032
Figure 80: Latin America Gym Apparel Market Value Share (%) and BPS Analysis by Consumer Orientation, 2022-2032
Figure 81: Latin America Gym Apparel Market Y-o-Y Growth (%) Projections by Consumer Orientation, 2022-2032
Figure 82: Latin America Gym Apparel Market Value (US$ Mn) Analysis by Sales Channel, 2017-2032
Figure 83: Latin America Gym Apparel Market Volume (Units) Analysis by Sales Channel, 2017-2032
Figure 84: Latin America Gym Apparel Market Value Share (%) and BPS Analysis by Sales Channel, 2022-2032
Figure 85: Latin America Gym Apparel Market Y-o-Y Growth (%) Projections by Sales Channel, 2022-2032
Figure 86: Latin America Gym Apparel Market Attractiveness by Product Type, 2022-2032
Figure 87: Latin America Gym Apparel Market Attractiveness by Material Type, 2022-2032
Figure 88: Latin America Gym Apparel Market Attractiveness by Consumer Orientation, 2022-2032
Figure 89: Latin America Gym Apparel Market Attractiveness by Sales Channel, 2022-2032
Figure 90: Latin America Gym Apparel Market Attractiveness by Country, 2022-2032
Figure 91: Europe Gym Apparel Market Value (US$ Mn) by Product Type, 2022-2032
Figure 92: Europe Gym Apparel Market Value (US$ Mn) by Material Type, 2022-2032
Figure 93: Europe Gym Apparel Market Value (US$ Mn) by Consumer Orientation, 2022-2032
Figure 94: Europe Gym Apparel Market Value (US$ Mn) by Sales Channel, 2022-2032
Figure 95: Europe Gym Apparel Market Value (US$ Mn) by Country, 2022-2032
Figure 96: Europe Gym Apparel Market Value (US$ Mn) Analysis by Country, 2017-2032
Figure 97: Europe Gym Apparel Market Volume (Units) Analysis by Country, 2017-2032
Figure 98: Europe Gym Apparel Market Value Share (%) and BPS Analysis by Country, 2022-2032
Figure 99: Europe Gym Apparel Market Y-o-Y Growth (%) Projections by Country, 2022-2032
Figure 100: Europe Gym Apparel Market Value (US$ Mn) Analysis by Product Type, 2017-2032
Figure 101: Europe Gym Apparel Market Volume (Units) Analysis by Product Type, 2017-2032
Figure 102: Europe Gym Apparel Market Value Share (%) and BPS Analysis by Product Type, 2022-2032
Figure 103: Europe Gym Apparel Market Y-o-Y Growth (%) Projections by Product Type, 2022-2032
Figure 104: Europe Gym Apparel Market Value (US$ Mn) Analysis by Material Type, 2017-2032
Figure 105: Europe Gym Apparel Market Volume (Units) Analysis by Material Type, 2017-2032
Figure 106: Europe Gym Apparel Market Value Share (%) and BPS Analysis by Material Type, 2022-2032
Figure 107: Europe Gym Apparel Market Y-o-Y Growth (%) Projections by Material Type, 2022-2032
Figure 108: Europe Gym Apparel Market Value (US$ Mn) Analysis by Consumer Orientation, 2017-2032
Figure 109: Europe Gym Apparel Market Volume (Units) Analysis by Consumer Orientation, 2017-2032
Figure 110: Europe Gym Apparel Market Value Share (%) and BPS Analysis by Consumer Orientation, 2022-2032
Figure 111: Europe Gym Apparel Market Y-o-Y Growth (%) Projections by Consumer Orientation, 2022-2032
Figure 112: Europe Gym Apparel Market Value (US$ Mn) Analysis by Sales Channel, 2017-2032
Figure 113: Europe Gym Apparel Market Volume (Units) Analysis by Sales Channel, 2017-2032
Figure 114: Europe Gym Apparel Market Value Share (%) and BPS Analysis by Sales Channel, 2022-2032
Figure 115: Europe Gym Apparel Market Y-o-Y Growth (%) Projections by Sales Channel, 2022-2032
Figure 116: Europe Gym Apparel Market Attractiveness by Product Type, 2022-2032
Figure 117: Europe Gym Apparel Market Attractiveness by Material Type, 2022-2032
Figure 118: Europe Gym Apparel Market Attractiveness by Consumer Orientation, 2022-2032
Figure 119: Europe Gym Apparel Market Attractiveness by Sales Channel, 2022-2032
Figure 120: Europe Gym Apparel Market Attractiveness by Country, 2022-2032
Figure 121: East Asia Gym Apparel Market Value (US$ Mn) by Product Type, 2022-2032
Figure 122: East Asia Gym Apparel Market Value (US$ Mn) by Material Type, 2022-2032
Figure 123: East Asia Gym Apparel Market Value (US$ Mn) by Consumer Orientation, 2022-2032
Figure 124: East Asia Gym Apparel Market Value (US$ Mn) by Sales Channel, 2022-2032
Figure 125: East Asia Gym Apparel Market Value (US$ Mn) by Country, 2022-2032
Figure 126: East Asia Gym Apparel Market Value (US$ Mn) Analysis by Country, 2017-2032
Figure 127: East Asia Gym Apparel Market Volume (Units) Analysis by Country, 2017-2032
Figure 128: East Asia Gym Apparel Market Value Share (%) and BPS Analysis by Country, 2022-2032
Figure 129: East Asia Gym Apparel Market Y-o-Y Growth (%) Projections by Country, 2022-2032
Figure 130: East Asia Gym Apparel Market Value (US$ Mn) Analysis by Product Type, 2017-2032
Figure 131: East Asia Gym Apparel Market Volume (Units) Analysis by Product Type, 2017-2032
Figure 132: East Asia Gym Apparel Market Value Share (%) and BPS Analysis by Product Type, 2022-2032
Figure 133: East Asia Gym Apparel Market Y-o-Y Growth (%) Projections by Product Type, 2022-2032
Figure 134: East Asia Gym Apparel Market Value (US$ Mn) Analysis by Material Type, 2017-2032
Figure 135: East Asia Gym Apparel Market Volume (Units) Analysis by Material Type, 2017-2032
Figure 136: East Asia Gym Apparel Market Value Share (%) and BPS Analysis by Material Type, 2022-2032
Figure 137: East Asia Gym Apparel Market Y-o-Y Growth (%) Projections by Material Type, 2022-2032
Figure 138: East Asia Gym Apparel Market Value (US$ Mn) Analysis by Consumer Orientation, 2017-2032
Figure 139: East Asia Gym Apparel Market Volume (Units) Analysis by Consumer Orientation, 2017-2032
Figure 140: East Asia Gym Apparel Market Value Share (%) and BPS Analysis by Consumer Orientation, 2022-2032
Figure 141: East Asia Gym Apparel Market Y-o-Y Growth (%) Projections by Consumer Orientation, 2022-2032
Figure 142: East Asia Gym Apparel Market Value (US$ Mn) Analysis by Sales Channel, 2017-2032
Figure 143: East Asia Gym Apparel Market Volume (Units) Analysis by Sales Channel, 2017-2032
Figure 144: East Asia Gym Apparel Market Value Share (%) and BPS Analysis by Sales Channel, 2022-2032
Figure 145: East Asia Gym Apparel Market Y-o-Y Growth (%) Projections by Sales Channel, 2022-2032
Figure 146: East Asia Gym Apparel Market Attractiveness by Product Type, 2022-2032
Figure 147: East Asia Gym Apparel Market Attractiveness by Material Type, 2022-2032
Figure 148: East Asia Gym Apparel Market Attractiveness by Consumer Orientation, 2022-2032
Figure 149: East Asia Gym Apparel Market Attractiveness by Sales Channel, 2022-2032
Figure 150: East Asia Gym Apparel Market Attractiveness by Country, 2022-2032
Figure 151: South Asia Gym Apparel Market Value (US$ Mn) by Product Type, 2022-2032
Figure 152: South Asia Gym Apparel Market Value (US$ Mn) by Material Type, 2022-2032
Figure 153: South Asia Gym Apparel Market Value (US$ Mn) by Consumer Orientation, 2022-2032
Figure 154: South Asia Gym Apparel Market Value (US$ Mn) by Sales Channel, 2022-2032
Figure 155: South Asia Gym Apparel Market Value (US$ Mn) by Country, 2022-2032
Figure 156: South Asia Gym Apparel Market Value (US$ Mn) Analysis by Country, 2017-2032
Figure 157: South Asia Gym Apparel Market Volume (Units) Analysis by Country, 2017-2032
Figure 158: South Asia Gym Apparel Market Value Share (%) and BPS Analysis by Country, 2022-2032
Figure 159: South Asia Gym Apparel Market Y-o-Y Growth (%) Projections by Country, 2022-2032
Figure 160: South Asia Gym Apparel Market Value (US$ Mn) Analysis by Product Type, 2017-2032
Figure 161: South Asia Gym Apparel Market Volume (Units) Analysis by Product Type, 2017-2032
Figure 162: South Asia Gym Apparel Market Value Share (%) and BPS Analysis by Product Type, 2022-2032
Figure 163: South Asia Gym Apparel Market Y-o-Y Growth (%) Projections by Product Type, 2022-2032
Figure 164: South Asia Gym Apparel Market Value (US$ Mn) Analysis by Material Type, 2017-2032
Figure 165: South Asia Gym Apparel Market Volume (Units) Analysis by Material Type, 2017-2032
Figure 166: South Asia Gym Apparel Market Value Share (%) and BPS Analysis by Material Type, 2022-2032
Figure 167: South Asia Gym Apparel Market Y-o-Y Growth (%) Projections by Material Type, 2022-2032
Figure 168: South Asia Gym Apparel Market Value (US$ Mn) Analysis by Consumer Orientation, 2017-2032
Figure 169: South Asia Gym Apparel Market Volume (Units) Analysis by Consumer Orientation, 2017-2032
Figure 170: South Asia Gym Apparel Market Value Share (%) and BPS Analysis by Consumer Orientation, 2022-2032
Figure 171: South Asia Gym Apparel Market Y-o-Y Growth (%) Projections by Consumer Orientation, 2022-2032
Figure 172: South Asia Gym Apparel Market Value (US$ Mn) Analysis by Sales Channel, 2017-2032
Figure 173: South Asia Gym Apparel Market Volume (Units) Analysis by Sales Channel, 2017-2032
Figure 174: South Asia Gym Apparel Market Value Share (%) and BPS Analysis by Sales Channel, 2022-2032
Figure 175: South Asia Gym Apparel Market Y-o-Y Growth (%) Projections by Sales Channel, 2022-2032
Figure 176: South Asia Gym Apparel Market Attractiveness by Product Type, 2022-2032
Figure 177: South Asia Gym Apparel Market Attractiveness by Material Type, 2022-2032
Figure 178: South Asia Gym Apparel Market Attractiveness by Consumer Orientation, 2022-2032
Figure 179: South Asia Gym Apparel Market Attractiveness by Sales Channel, 2022-2032
Figure 180: South Asia Gym Apparel Market Attractiveness by Country, 2022-2032
Figure 181: Oceania Gym Apparel Market Value (US$ Mn) by Product Type, 2022-2032
Figure 182: Oceania Gym Apparel Market Value (US$ Mn) by Material Type, 2022-2032
Figure 183: Oceania Gym Apparel Market Value (US$ Mn) by Consumer Orientation, 2022-2032
Figure 184: Oceania Gym Apparel Market Value (US$ Mn) by Sales Channel, 2022-2032
Figure 185: Oceania Gym Apparel Market Value (US$ Mn) by Country, 2022-2032
Figure 186: Oceania Gym Apparel Market Value (US$ Mn) Analysis by Country, 2017-2032
Figure 187: Oceania Gym Apparel Market Volume (Units) Analysis by Country, 2017-2032
Figure 188: Oceania Gym Apparel Market Value Share (%) and BPS Analysis by Country, 2022-2032
Figure 189: Oceania Gym Apparel Market Y-o-Y Growth (%) Projections by Country, 2022-2032
Figure 190: Oceania Gym Apparel Market Value (US$ Mn) Analysis by Product Type, 2017-2032
Figure 191: Oceania Gym Apparel Market Volume (Units) Analysis by Product Type, 2017-2032
Figure 192: Oceania Gym Apparel Market Value Share (%) and BPS Analysis by Product Type, 2022-2032
Figure 193: Oceania Gym Apparel Market Y-o-Y Growth (%) Projections by Product Type, 2022-2032
Figure 194: Oceania Gym Apparel Market Value (US$ Mn) Analysis by Material Type, 2017-2032
Figure 195: Oceania Gym Apparel Market Volume (Units) Analysis by Material Type, 2017-2032
Figure 196: Oceania Gym Apparel Market Value Share (%) and BPS Analysis by Material Type, 2022-2032
Figure 197: Oceania Gym Apparel Market Y-o-Y Growth (%) Projections by Material Type, 2022-2032
Figure 198: Oceania Gym Apparel Market Value (US$ Mn) Analysis by Consumer Orientation, 2017-2032
Figure 199: Oceania Gym Apparel Market Volume (Units) Analysis by Consumer Orientation, 2017-2032
Figure 200: Oceania Gym Apparel Market Value Share (%) and BPS Analysis by Consumer Orientation, 2022-2032
Figure 201: Oceania Gym Apparel Market Y-o-Y Growth (%) Projections by Consumer Orientation, 2022-2032
Figure 202: Oceania Gym Apparel Market Value (US$ Mn) Analysis by Sales Channel, 2017-2032
Figure 203: Oceania Gym Apparel Market Volume (Units) Analysis by Sales Channel, 2017-2032
Figure 204: Oceania Gym Apparel Market Value Share (%) and BPS Analysis by Sales Channel, 2022-2032
Figure 205: Oceania Gym Apparel Market Y-o-Y Growth (%) Projections by Sales Channel, 2022-2032
Figure 206: Oceania Gym Apparel Market Attractiveness by Product Type, 2022-2032
Figure 207: Oceania Gym Apparel Market Attractiveness by Material Type, 2022-2032
Figure 208: Oceania Gym Apparel Market Attractiveness by Consumer Orientation, 2022-2032
Figure 209: Oceania Gym Apparel Market Attractiveness by Sales Channel, 2022-2032
Figure 210: Oceania Gym Apparel Market Attractiveness by Country, 2022-2032
Figure 211: MEA Gym Apparel Market Value (US$ Mn) by Product Type, 2022-2032
Figure 212: MEA Gym Apparel Market Value (US$ Mn) by Material Type, 2022-2032
Figure 213: MEA Gym Apparel Market Value (US$ Mn) by Consumer Orientation, 2022-2032
Figure 214: MEA Gym Apparel Market Value (US$ Mn) by Sales Channel, 2022-2032
Figure 215: MEA Gym Apparel Market Value (US$ Mn) by Country, 2022-2032
Figure 216: MEA Gym Apparel Market Value (US$ Mn) Analysis by Country, 2017-2032
Figure 217: MEA Gym Apparel Market Volume (Units) Analysis by Country, 2017-2032
Figure 218: MEA Gym Apparel Market Value Share (%) and BPS Analysis by Country, 2022-2032
Figure 219: MEA Gym Apparel Market Y-o-Y Growth (%) Projections by Country, 2022-2032
Figure 220: MEA Gym Apparel Market Value (US$ Mn) Analysis by Product Type, 2017-2032
Figure 221: MEA Gym Apparel Market Volume (Units) Analysis by Product Type, 2017-2032
Figure 222: MEA Gym Apparel Market Value Share (%) and BPS Analysis by Product Type, 2022-2032
Figure 223: MEA Gym Apparel Market Y-o-Y Growth (%) Projections by Product Type, 2022-2032
Figure 224: MEA Gym Apparel Market Value (US$ Mn) Analysis by Material Type, 2017-2032
Figure 225: MEA Gym Apparel Market Volume (Units) Analysis by Material Type, 2017-2032
Figure 226: MEA Gym Apparel Market Value Share (%) and BPS Analysis by Material Type, 2022-2032
Figure 227: MEA Gym Apparel Market Y-o-Y Growth (%) Projections by Material Type, 2022-2032
Figure 228: MEA Gym Apparel Market Value (US$ Mn) Analysis by Consumer Orientation, 2017-2032
Figure 229: MEA Gym Apparel Market Volume (Units) Analysis by Consumer Orientation, 2017-2032
Figure 230: MEA Gym Apparel Market Value Share (%) and BPS Analysis by Consumer Orientation, 2022-2032
Figure 231: MEA Gym Apparel Market Y-o-Y Growth (%) Projections by Consumer Orientation, 2022-2032
Figure 232: MEA Gym Apparel Market Value (US$ Mn) Analysis by Sales Channel, 2017-2032
Figure 233: MEA Gym Apparel Market Volume (Units) Analysis by Sales Channel, 2017-2032
Figure 234: MEA Gym Apparel Market Value Share (%) and BPS Analysis by Sales Channel, 2022-2032
Figure 235: MEA Gym Apparel Market Y-o-Y Growth (%) Projections by Sales Channel, 2022-2032
Figure 236: MEA Gym Apparel Market Attractiveness by Product Type, 2022-2032
Figure 237: MEA Gym Apparel Market Attractiveness by Material Type, 2022-2032
Figure 238: MEA Gym Apparel Market Attractiveness by Consumer Orientation, 2022-2032
Figure 239: MEA Gym Apparel Market Attractiveness by Sales Channel, 2022-2032
Figure 240: MEA Gym Apparel Market Attractiveness by Country, 2022-2032
Need specific information?
Request CustomizationExplore Consumer Product Insights
View Reports