Bamboo Apparel Market Size and Share Forecast Outlook (2022 to 2032)

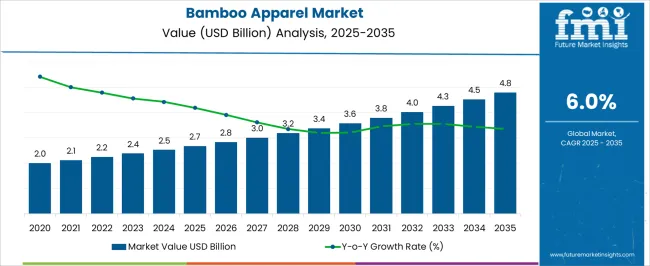
The bamboo apparel market is slated to expand at a CAGR of 6.0% during the forecast period (2022 to 2032). Sales in the market are projected to reach a valuation of USD 2,248.6 Million in 2022 and are likely to cross USD 4,026.9 Million by the end of 2032.

Growth in the market is owing to the increased awareness among consumers of eco-friendly products. The antibacterial qualities of bamboo cloth are one of the factors improving the demand for bamboo apparel across the globe. As per the research, scientists have found that bamboo grows with little to no need for pesticides, due to bamboo Kun - an anti-bacterial bio-agent. Bamboo Kun is considered to have a long shelf life in bamboo fabric as it is tightly bonded in the bamboo cells, resulting in demand for bamboo apparel.

Scientists have conducted tests to demonstrate that a significant amount of bacteria that naturally incubate on bamboo fabric does not survive. This is due to the bamboo Kun characteristic, making the fabric resistant to bacteria. Customers who have delicate skin or are prone to allergies especially favor bamboo apparel.

Additionally, the growing preference for eco-friendly products is providing an impetus to the demand for bamboo apparel. The demand for eco-fibers might increase as consciousness about sustainability and environmental preservation grows. The adoption of next-generation technology is anticipated to accelerate the agriculture sector's transformation and the production of raw materials for the industry.

It is projected that the use of bamboo in personal care and healthcare goods will increase, propelling growth in the market. Bamboo is employed in a variety of products, including handcrafted goods, furniture, and housing.

They are also used to make woven goods, charcoal, carpets, and flooring. Therefore, a wide variety of commercial applications is projected to increase bamboo fiber sales, which would then propel the demand over the forecast period. However, with the rising sustainability trend in the fashion industry, key manufacturers are now collaborating with textile companies and local players to expand their business.

As eco-consciousness in the fashion industry grows, the preference for bamboo apparel is surging. Along with bamboo fibers, the sales of clothes made of bamboo viscose and bamboo rayon are also surging, especially in East & South Asia. As per the research, these bamboo apparels are 3x softer and more durable than cotton clothes. Surging inclination towards eco-friendly clothing is also encouraging bamboo cultivation. This is predicted to boost the growth of bamboo apparel in the market.

Attributes Key Insights
Bamboo Apparel Current Market Size (2021) USD 2,122.1 Million
Estimated Market Size (2022) USD 2,248.6 Million
Projected Market Value (2032) USD 4,026.9 Million
CAGR Growth Rate (2022 to 2032) 6.0%

Comparison of Historical vs Future Outlook on Changing Consumer Trends for Bamboo Apparel Industry

As per Future Market Insights (FMI), the market is expected to witness robust growth owing to the growing sustainability concerns and growing demand for woven bamboo apparel across the globe. As bamboo is 100% natural, soft like silk, and completely biodegradable.

The bamboo apparel is manufactured from extremely soft bamboo pulp. Bamboo's hollow fibers give it exceptional breathing properties, which makes it a fantastic fabric for clothes. The bamboo fiber has more micro gaps and micropores than any other material, which provides for better moisture absorption and ventilation. Because bamboo contains bamboo Kun, an antimicrobial bio-agent, which also gives it natural anti-allergic qualities, bamboo fabrics also have a distinctive antibacterial quality.

Bamboo has a high level of breathability, in contrast to many other materials. The natural bamboo plant maintains its fabric form and, like its other attributes, keeps itself cool in the heat. Micro-gaps are spread across the bamboo fiber’s cross-section, improving the fabric's capacity for moisture absorption and breathability.

The high expenses connected with the production of eco-fibers like bamboo fiber as well as their processing and manufacturing constitute a significant constraint for this sector. Over the course of the forecast period, the market is anticipated to be driven by rising infrastructure development investments, expanding use of sustainable building and construction materials, and growing consumer awareness of the uses and advantages of bamboo. Bamboo is a renewable resource that may grow in a variety of climates, though a tropical climate is preferred.

Top Bamboo Apparel Market Dynamics and Industry Trends

Sustainable Fashion Trend to Push Bamboo Apparel Sales among Gen-Zs

Bamboo has become a favorite material among sustainable fashion brands since it requires less water, labor, and time to grow than other common plants that are used as fabrics. Hence, end users are focusing on sustainability as the numerous effects of climate change become more apparent. As a result, the market is gaining significant attraction in the current scenario.

Consumers using a particular amount of a product without having a substantial negative impact on the likelihood of its source's regeneration is referred to as sustainability. When it comes to environmentally friendly and sustainable products, bamboo has a plethora of advantages. It is becoming a more viable option than other materials for making durable and lightweight products, which is highly gaining prominence in the global market.
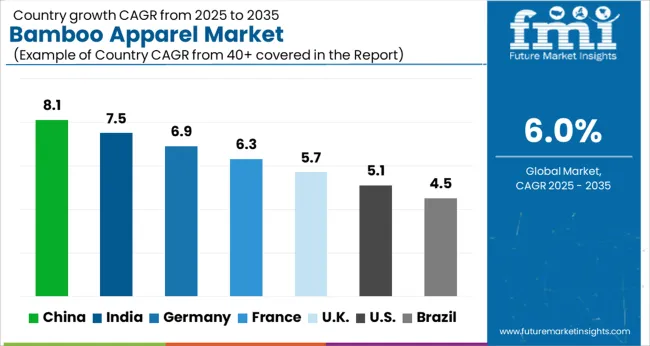
Analysis of Top Countries, Producing, Designing, Marketing, and Selling Bamboo Apparel

How will the Growth of Bamboo Apparels Unfold in India?

Increasing Product Launches and Celebrity Endorsements to Facilitate Bamboo Apparel Sales in India

One of the fastest-growing, most renewable, and biodegradable materials with significant environmental advantages is bamboo. As per FMI, the market in India is expected to grow at a CAGR of close to 10.4% during the forecast period.

Numerous product launches in India on the back of increasing demand for sustainable products are helping the brands to prosper. Further, a high number of celebrity endorsements by the players is attracting the young generation towards such product adoption.

For instance, Ranveer Singh, a Bollywood celebrity, endorsed Siya ram's campaign to promote the novel bamboo fabric. To bring the best of the world to Indian consumers, a leading apparel brand, Siyaram continuously develops goods and collaborates with some of the most talented craftspeople in the world.

How is the Demand for Bamboo Apparel Faring in China?

The rigorous strategies by organizations in China attract more consumers

China is expected to be the most prominent market in the East Asia region, with the country exhibiting a value share of around 56% in the East Asia market.

The Shanghai International Bamboo Industry Expo which has been organized for many years witnessed the transformation and innovation of the bamboo industry. As a result, the bamboo industry provided a new development model for rural regeneration and displayed its full industrial chain, high degree of industrial clustering, and notable resource advantages.

The organization is developing the only science, industry, and trade communication platform for the bamboo industry in China to assist consumers in choosing the best bamboo brands for their unique needs. Expand market sales of bamboo items to boost the bamboo industry's appeal. As a result, this industrial exhibition is driving the market in China.
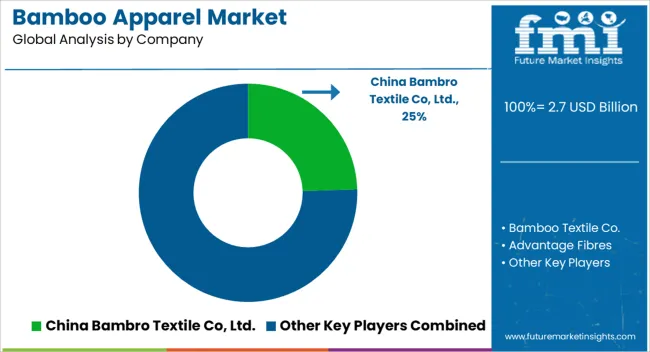
Bamboo Apparel Industry Analysis by Top Investment Segments

Which Type of Bamboo Apparels will be the Most Preferred?

Increased Adoption of T-Shirts, Especially Among Men, to Propel Bamboo Apparel Sales

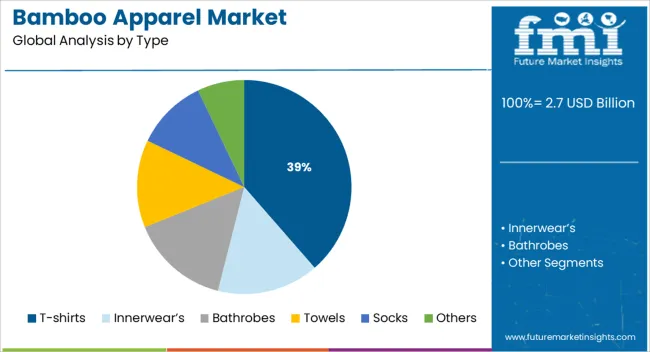
In terms of product type, t-shirts are the most prominent category with a value share of around 32% in the global market. The significant market share is a result of the increasing adoption of t-shirts by the younger generation on the back of gaining prominence of sustainable products and their effect on the environment.

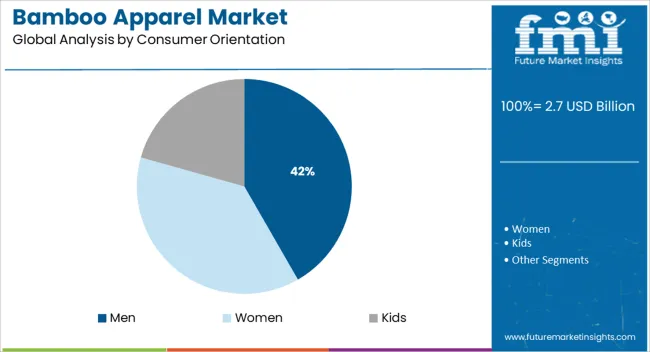
The rising presence of men on social media platforms and their browsing activity for new products in their leisure time is leading to an increased volume of sales of bamboo apparel by men. The category is anticipated to contribute a significant share of around 51.5% in the global bamboo apparel category during the forecast period.

Further, the women category is anticipated to grow at a prominent CAGR of around 8.1% owing to their increasing involvement in numerous sectors of the industry such as production, designing, marketing, etc.

Leading Suppliers of Bamboo Apparel

Some key players in the market are China Bambro Textile Co, Ltd., Bamboo Textile Co., Advantage Fibres, Wild Fibres, TIC Gums, China Thrive Industrial Co., Towel Industrial Co. Ltd., Xiamen Ebie Import & Export Co. Ltd., Boody Bamboo Clothing, Cozy Earth, Cariloha, Inc., BLUE BUNGALOW, Free Fly Apparel, Ettitude Holdings, Inc., and Thought Clothing among others.

Bamboo Clothing: Medialab announces their media partner support to Bamboo Clothing for brand growth strategy and focuses on increasing brand awareness in the United Kingdom market.

The recently established Leandrop company sells environmentally friendly apparel made of hemp and bamboo.

Key Bamboo Apparel Industry Highlights

Attribute Details
Estimated Market Size (2022) USD 2,248.6 Million
Projected Market Value (2032) USD 4,026.9 Million
CAGR Growth Rate (2022 to 2032) 6.0%
Historical Data Available for 2017 to 2021
Forecast Period 2022 to 2032
Quantitative units Revenue in USD Million, volume in Units, and CAGR from 2022 to 2032
Report Coverage Revenue forecast, volume forecast, company ranking, competitive landscape, growth factors, and trends, pricing analysis
Segments Covered Type, Fabric Type, Consumer Orientation, Distribution Channel, Region
Country scope USA, Canada, Mexico, Germany, United Kingdom, France, Italy, Spain, Russia, India, Thailand, China, India, Japan, Australia, Brazil, Argentina, Colombia, Saudi Arabia, United Arab Emirates(UAE), South Africa
Key Companies Profiled China Bambro Textile Co, Ltd.; Bamboo Textile Co.; Advantage Fibres; Wild Fibres; TIC Gums; China Thrive Industrial Co.;Towel Industrial Co. Ltd.; Xiamen Ebie import & Export Co. Ltd.; Boody Bamboo Clothing; Cozy Earth; Cariloha, Inc.; BLUE BUNGALOW; Free Fly Apparel; Ettitude Holdings, Inc.; Thought Clothing; Others

Top Segments Studied in the Bamboo Apparel Market Research Report

By Type:

  • T-shirts
  • Innerwear’s
  • Bathrobes
  • Towels
  • Socks
  • Others

By Fabric Type:

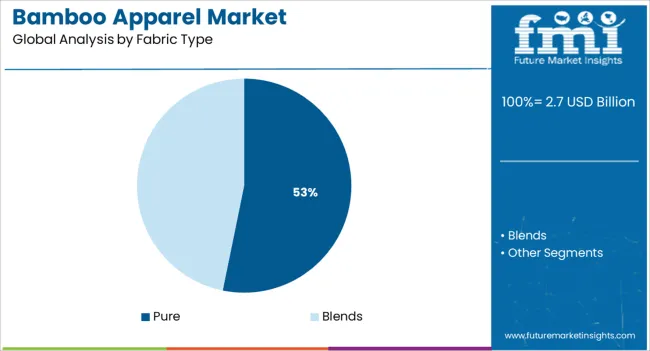
  • Pure
  • Blends

By Consumer Orientation:

  • Men
  • Women
  • Kids

By Distribution Channel:

  • Hypermarket/Supermarket
  • Wholesale Dealers
  • Specialty Stores
  • Independent Stores
  • Online Stores
  • Others

By Region:

  • North America
  • Latin America
  • Europe
  • East Asia
  • South Asia
  • Oceania
  • Middle East and Africa

Table of Content

  • 1. Executive Summary 
  • 2. Market Overview
  • 3. Key Market Trends
  • 4. Global Market Demand Analysis 2017 to 2021 and Forecast, 2022 to 2032
  • 5. Global Market Pricing Analysis
  • 6. Global Market Demand (in Value or in USD Million) Analysis 2017 to 2021 and Forecast, 2022 to 2032
  • 7. Market Background
  • 8. Global Market Analysis 2017 to 2021 and Forecast 2022 to 2032, by Type
    • 8.1. T-shirts
    • 8.2. Innerwear
    • 8.3. Bathrobes
    • 8.4. Towels
    • 8.5. Socks
    • 8.6. Others
  • 9. Global Market Analysis 2017 to 2021 and Forecast 2022 to 2032, by Fabric Type
    • 9.1. Pure
    • 9.2. Blends
  • 10. Global Market Analysis 2017 to 2021 and Forecast 2022 to 2032, by Consumer Orientation
    • 10.1. Men
    • 10.2. Women
    • 10.3. Kids
  • 11. Global Market Analysis 2017 to 2021 and Forecast 2022 to 2032, by Distribution Channel
    • 11.1. Hypermarket/Supermarket
    • 11.2. Wholesale Dealers
    • 11.3. Specialty Stores
    • 11.4. Independent Stores
    • 11.5. Online Store
    • 11.6. Others
  • 12. Global Market Analysis 2017 to 2021 and Forecast 2022 to 2032, by Region
    • 12.1. North America
    • 12.2. Latin America
    • 12.3. Europe
    • 12.4. East Asia
    • 12.5. South Asia
    • 12.6. Oceania
    • 12.7. Middle East and Africa (MEA)
  • 13. North America Market Analysis 2017 to 2021 and Forecast 2022 to 2032
  • 14. Latin America Market Analysis 2017 to 2021 and Forecast 2022 to 2032
  • 15. Europe Market Analysis 2017 to 2021 and Forecast 2022 to 2032
  • 16. East Asia Market Analysis 2017 to 2021 and Forecast 2022 to 2032
  • 17. South Asia Market Analysis 2017 to 2021 and Forecast 2022 to 2032
  • 18. Oceania Market Analysis 2017 to 2021 and Forecast 2022 to 2032
  • 19. MEA Market Analysis 2017 to 2021 and Forecast 2022 to 2032
  • 20. Market Structure Analysis
  • 21. Competition Analysis
    • 21.1. China Bambro Textile Co, Ltd.
    • 21.2. Bamboo Textile Co.
    • 21.3. Advantage Fibres
    • 21.4. Wild Fibres
    • 21.5. TIC Gums
    • 21.6. China Thrive Industrial Co.,
    • 21.7. Towel Industrial Co. Ltd.
    • 21.8. Xiamen Ebie import & Export Co. Ltd.
    • 21.9. Boody Bamboo Clothing
    • 21.10. Cozy Earth
    • 21.11. Cariloha, Inc.
    • 21.12. BLUE BUNGALOW
    • 21.13. Free Fly Apparel
    • 21.14. Ettitude Holdings, Inc.
    • 21.15. Thought Clothing
    • 21.16. Others
  • 22. Assumptions and Acronyms Used
  • 23. Research Methodology

List of Tables

Table 1: Global Market Value (US$ Million) Forecast, By Type, 2017 to 2032

Table 2: Global Market Volume (Units) Forecast, By Type, 2017 to 2032

Table 3: Global Market Value (US$ Million) Forecast, By Fabric Type, 2017 to 2032

Table 4: Global Market Volume (Units) Forecast, By Fabric Type, 2017 to 2032

Table 5: Global Market Value (US$ Million) Forecast, By Consumer Orientation, 2017 to 2032

Table 6: Global Market Volume (Units) Forecast, By Consumer Orientation, 2017 to 2032

Table 7: Global Market Value (US$ Million) Forecast, By Distribution Channel 2017 to 2032

Table 8: Global Market Volume (Units) Forecast, By Distribution Channel 2017 to 2032

Table 9: Global Market Value (US$ Million) Forecast, By Region, 2017 to 2032

Table 10: Global Market Volume (Units) Forecast, By Region, 2017 to 2032

Table 11: North America Market Value (US$ Million) Forecast, By Country, 2017 to 2032

Table 12: North America Market Volume (Units) Forecast, By Country, 2017 to 2032

Table 13: North America Market Value (US$ Million) Forecast, By Type, 2017 to 2032

Table 14: North America Market Volume (Units) Forecast, By Type, 2017 to 2032

Table 15: North America Market Value (US$ Million) Forecast, By Fabric Type, 2017 to 2032

Table 16: North America Market Volume (Units) Forecast, By Fabric Type, 2017 to 2032

Table 17: North America Market Value (US$ Million) Forecast, By Consumer Orientation, 2017 to 2032

Table 18: North America Market Volume (Units) Forecast, By Consumer Orientation, 2017 to 2032

Table 19: North America Market Value (US$ Million) Forecast, By Distribution Channel 2017 to 2032

Table 20: North America Market Volume (Units) Forecast, By Distribution Channel 2017 to 2032

Table 21: Latin America Market Value (US$ Million) Forecast, By Country, 2017 to 2032

Table 22: Latin America Market Volume (Units) Forecast, By Country, 2017 to 2032

Table 23: Latin America Market Value (US$ Million) Forecast, By Type, 2017 to 2032

Table 24: Latin America Market Volume (Units) Forecast, By Type, 2017 to 2032

Table 25: Latin America Market Value (US$ Million) Forecast, By Fabric Type, 2017 to 2032

Table 26: Latin America Market Volume (Units) Forecast, By Fabric Type, 2017 to 2032

Table 27: Latin America Market Value (US$ Million) Forecast, By Consumer Orientation, 2017 to 2032

Table 28: Latin America Market Volume (Units) Forecast, By Consumer Orientation, 2017 to 2032

Table 29: Latin America Market Value (US$ Million) Forecast, By Distribution Channel 2017 to 2032

Table 30: Latin America Market Volume (Units) Forecast, By Distribution Channel 2017 to 2032

Table 31: Europe Market Value (US$ Million) Forecast, By Country, 2017 to 2032

Table 32: Europe Market Volume (Units) Forecast, By Country, 2017 to 2032

Table 33: Europe Market Value (US$ Million) Forecast, By Type, 2017 to 2032

Table 34: Europe Market Volume (Units) Forecast, By Type, 2017 to 2032

Table 35: Europe Market Value (US$ Million) Forecast, By Fabric Type, 2017 to 2032

Table 36: Europe Market Volume (Units) Forecast, By Fabric Type, 2017 to 2032

Table 37: Europe Market Value (US$ Million) Forecast, By Consumer Orientation, 2017 to 2032

Table 38: Europe Market Volume (Units) Forecast, By Consumer Orientation, 2017 to 2032

Table 39: Europe Market Value (US$ Million) Forecast, By Distribution Channel 2017 to 2032

Table 40: Europe Market Volume (Units) Forecast, By Distribution Channel 2017 to 2032

Table 41: East Asia Market Value (US$ Million) Forecast, By Country, 2017 to 2032

Table 42: East Asia Market Volume (Units) Forecast, By Country, 2017 to 2032

Table 43: East Asia Market Value (US$ Million) Forecast, By Type, 2017 to 2032

Table 44: East Asia Market Volume (Units) Forecast, By Type, 2017 to 2032

Table 45: East Asia Market Value (US$ Million) Forecast, By Fabric Type, 2017 to 2032

Table 46: East Asia Market Volume (Units) Forecast, By Fabric Type, 2017 to 2032

Table 47: East Asia Market Value (US$ Million) Forecast, By Consumer Orientation, 2017 to 2032

Table 48: East Asia Market Volume (Units) Forecast, By Consumer Orientation, 2017 to 2032

Table 49: East Asia Market Value (US$ Million) Forecast, By Distribution Channel 2017 to 2032

Table 50: East Asia Market Volume (Units) Forecast, By Distribution Channel 2017 to 2032

Table 51: South Asia Market Value (US$ Million) Forecast, By Country, 2017 to 2032

Table 52: South Asia Market Volume (Units) Forecast, By Country, 2017 to 2032

Table 53: South Asia Market Value (US$ Million) Forecast, By Type, 2017 to 2032

Table 54: South Asia Market Volume (Units) Forecast, By Type, 2017 to 2032

Table 55: South Asia Market Value (US$ Million) Forecast, By Fabric Type, 2017 to 2032

Table 56: South Asia Market Volume (Units) Forecast, By Fabric Type, 2017 to 2032

Table 57: South Asia Market Value (US$ Million) Forecast, By Consumer Orientation, 2017 to 2032

Table 58: South Asia Market Volume (Units) Forecast, By Consumer Orientation, 2017 to 2032

Table 59: South Asia Market Value (US$ Million) Forecast, By Distribution Channel 2017 to 2032

Table 60: South Asia Market Volume (Units) Forecast, By Distribution Channel 2017 to 2032

Table 61: Oceania Market Value (US$ Million) Forecast, By Country, 2017 to 2032

Table 62: Oceania Market Volume (Units) Forecast, By Country, 2017 to 2032

Table 63: Oceania Market Value (US$ Million) Forecast, By Type, 2017 to 2032

Table 64: Oceania Market Volume (Units) Forecast, By Type, 2017 to 2032

Table 65: Oceania Market Value (US$ Million) Forecast, By Fabric Type, 2017 to 2032

Table 66: Oceania Market Volume (Units) Forecast, By Fabric Type, 2017 to 2032

Table 67: Oceania Market Value (US$ Million) Forecast, By Consumer Orientation, 2017 to 2032

Table 68: Oceania Market Volume (Units) Forecast, By Consumer Orientation, 2017 to 2032

Table 69: Oceania Market Value (US$ Million) Forecast, By Distribution Channel 2017 to 2032

Table 70: Oceania Market Volume (Units) Forecast, By Distribution Channel 2017 to 2032

Table 71: MEA Market Value (US$ Million) Forecast, By Country, 2017 to 2032

Table 72: MEA Market Volume (Units) Forecast, By Country, 2017 to 2032

Table 73: MEA Market Value (US$ Million) Forecast, By Type, 2017 to 2032

Table 74: MEA Market Volume (Units) Forecast, By Type, 2017 to 2032

Table 75: MEA Market Value (US$ Million) Forecast, By Fabric Type, 2017 to 2032

Table 76: MEA Market Volume (Units) Forecast, By Fabric Type, 2017 to 2032

Table 77: MEA Market Value (US$ Million) Forecast, By Consumer Orientation, 2017 to 2032

Table 78: MEA Market Volume (Units) Forecast, By Consumer Orientation, 2017 to 2032

Table 79: MEA Market Value (US$ Million) Forecast, By Distribution Channel 2017 to 2032

Table 80: MEA Market Volume (Units) Forecast, By Distribution Channel 2017 to 2032

List of Figures

Figure 01: Global Market Value (US$ Million) and Volume (Units) Analysis, 2017 to 2021

Figure 02: Global Market Value (US$ Million) and Volume (Units) Forecast, 2022 to 2032

Figure 03: Global Market Value (US$ Million) Analysis, 2017 to 2021

Figure 04: Global Market Value (US$ Million) Forecast, 2022 to 2032

Figure 05: Global Market Absolute $ Opportunity Value (US$ Million), 2022 to 2032

Figure 06: Global Market Value (US$ Million) Analysis By Type, 2017 to 2032

Figure 07: Global Market Volume (Units) Analysis By Type, 2017 to 2032

Figure 08: Global Market Y-o-Y Growth (%) Projections, By Type, 2022 to 2032

Figure 09: Global Market Attractiveness By Type, 2022 to 2032

Figure 10: Global Market Value (US$ Million) Analysis By Fabric Type, 2017 to 2032

Figure 11: Global Market Volume (Units) Analysis By Fabric Type, 2017 to 2032

Figure 12: Global Market Y-o-Y Growth (%) Projections, By Fabric Type, 2022 to 2032

Figure 13: Global Market Attractiveness By Fabric Type, 2022 to 2032

Figure 14: Global Market Value (US$ Million) Analysis By Consumer Orientation, 2017 to 2032

Figure 15: Global Market Volume (Units) Analysis By Consumer Orientation, 2017 to 2032

Figure 16: Global Market Y-o-Y Growth (%) Projections, By Consumer Orientation, 2022 to 2032

Figure 17: Global Market Attractiveness By Consumer Orientation, 2022 to 2032

Figure 18: Global Market Value (US$ Million) Analysis By Distribution Channel, 2017 to 2032

Figure 19: Global Market Volume (Units) Analysis By Distribution Channel, 2017 to 2032

Figure 20: Global Market Y-o-Y Growth (%) Projections, By Distribution Channel, 2022 to 2032

Figure 21: Global Market Attractiveness By Distribution Channel, 2022 to 2032

Figure 22: Global Market Value (US$ Million) Analysis By Region, 2017 to 2032

Figure 23: Global Market Volume (Units) Analysis By Region, 2017 to 2032

Figure 24: Global Market Y-o-Y Growth (%) Projections, By Region, 2022 to 2032

Figure 25: Global Market Attractiveness By Region, 2022 to 2032

Figure 26: North America Market Value (US$ Million) Analysis By Country, 2017 to 2032

Figure 27: North America Market Volume (Units) Analysis By Country, 2017 to 2032

Figure 28: North America Market Y-o-Y Growth (%) Projections, By Country, 2022 to 2032

Figure 29: North America Market Attractiveness By Country, 2022 to 2032

Figure 30: North America Market Value (US$ Million) Analysis By Type, 2017 to 2032

Figure 31: North America Market Volume (Units) Analysis By Type, 2017 to 2032

Figure 32: North America Market Y-o-Y Growth (%) Projections, By Type, 2022 to 2032

Figure 33: North America Market Attractiveness By Type, 2022 to 2032

Figure 34: North America Market Value (US$ Million) Analysis By Fabric Type, 2017 to 2032

Figure 35: North America Market Volume (Units) Analysis By Fabric Type, 2017 to 2032

Figure 36: North America Market Y-o-Y Growth (%) Projections, By Fabric Type, 2022 to 2032

Figure 37: North America Market Attractiveness By Fabric Type, 2022 to 2032

Figure 38: North America Market Value (US$ Million) Analysis By Consumer Orientation, 2017 to 2032

Figure 39: North America Market Volume (Units) Analysis By Consumer Orientation, 2017 to 2032

Figure 40: North America Market Y-o-Y Growth (%) Projections, By Consumer Orientation, 2022 to 2032

Figure 41: North America Market Attractiveness By Consumer Orientation, 2022 to 2032

Figure 42: North America Market Value (US$ Million) Analysis By Distribution Channel, 2017 to 2032

Figure 43: North America Market Volume (Units) Analysis By Distribution Channel, 2017 to 2032

Figure 44: North America Market Y-o-Y Growth (%) Projections, By Distribution Channel, 2022 to 2032

Figure 45: North America Market Attractiveness By Distribution Channel, 2022 to 2032

Figure 46: Latin America Market Value (US$ Million) Analysis By Country, 2017 to 2032

Figure 47: Latin America Market Volume (Units) Analysis By Country, 2017 to 2032

Figure 48: Latin America Market Y-o-Y Growth (%) Projections, By Country, 2022 to 2032

Figure 49: Latin America Market Attractiveness By Country, 2022 to 2032

Figure 50: Latin America Market Value (US$ Million) Analysis By Type, 2017 to 2032

Figure 51: Latin America Market Volume (Units) Analysis By Type, 2017 to 2032

Figure 52: Latin America Market Y-o-Y Growth (%) Projections, By Type, 2022 to 2032

Figure 53: Latin America Market Attractiveness By Type, 2022 to 2032

Figure 54: Latin America Market Value (US$ Million) Analysis By Fabric Type, 2017 to 2032

Figure 55: Latin America Market Volume (Units) Analysis By Fabric Type, 2017 to 2032

Figure 56: Latin America Market Y-o-Y Growth (%) Projections, By Fabric Type, 2022 to 2032

Figure 57: Latin America Market Attractiveness By Fabric Type, 2022 to 2032

Figure 58: Latin America Market Value (US$ Million) Analysis By Consumer Orientation, 2017 to 2032

Figure 59: Latin America Market Volume (Units) Analysis By Consumer Orientation, 2017 to 2032

Figure 60: Latin America Market Y-o-Y Growth (%) Projections, By Consumer Orientation, 2022 to 2032

Figure 61: Latin America Market Attractiveness By Consumer Orientation, 2022 to 2032

Figure 62: Latin America Market Value (US$ Million) Analysis By Distribution Channel, 2017 to 2032

Figure 63: Latin America Market Volume (Units) Analysis By Distribution Channel, 2017 to 2032

Figure 64: Latin America Market Y-o-Y Growth (%) Projections, By Distribution Channel, 2022 to 2032

Figure 65: Latin America Market Attractiveness By Distribution Channel, 2022 to 2032

Figure 66: Europe Market Value (US$ Million) Analysis By Country, 2017 to 2032

Figure 67: Europe Market Volume (Units) Analysis By Country, 2017 to 2032

Figure 68: Europe Market Y-o-Y Growth (%) Projections, By Country, 2022 to 2032

Figure 69: Europe Market Attractiveness By Country, 2022 to 2032

Figure 70: Europe Market Value (US$ Million) Analysis By Type, 2017 to 2032

Figure 71: Europe Market Volume (Units) Analysis By Type, 2017 to 2032

Figure 72: Europe Market Y-o-Y Growth (%) Projections, By Type, 2022 to 2032

Figure 73: Europe Market Attractiveness By Type, 2022 to 2032

Figure 74: Europe Market Value (US$ Million) Analysis By Fabric Type, 2017 to 2032

Figure 75: Europe Market Volume (Units) Analysis By Fabric Type, 2017 to 2032

Figure 76: Europe Market Y-o-Y Growth (%) Projections, By Fabric Type, 2022 to 2032

Figure 77: Europe Market Attractiveness By Fabric Type, 2022 to 2032

Figure 78: Europe Market Value (US$ Million) Analysis By Consumer Orientation, 2017 to 2032

Figure 79: Europe Market Volume (Units) Analysis By Consumer Orientation, 2017 to 2032

Figure 80: Europe Market Y-o-Y Growth (%) Projections, By Consumer Orientation, 2022 to 2032

Figure 81: Europe Market Attractiveness By Consumer Orientation, 2022 to 2032

Figure 82: Europe Market Value (US$ Million) Analysis By Distribution Channel, 2017 to 2032

Figure 83: Europe Market Volume (Units) Analysis By Distribution Channel, 2017 to 2032

Figure 84: Europe Market Y-o-Y Growth (%) Projections, By Distribution Channel, 2022 to 2032

Figure 85: Europe Market Attractiveness By Distribution Channel, 2022 to 2032

Figure 86: East Asia Market Value (US$ Million) Analysis By Country, 2017 to 2032

Figure 87: East Asia Market Volume (Units) Analysis By Country, 2017 to 2032

Figure 88: East Asia Market Y-o-Y Growth (%) Projections, By Country, 2022 to 2032

Figure 89: East Asia Market Attractiveness By Country, 2022 to 2032

Figure 90: East Asia Market Value (US$ Million) Analysis By Type, 2017 to 2032

Figure 91: East Asia Market Volume (Units) Analysis By Type, 2017 to 2032

Figure 92: East Asia Market Y-o-Y Growth (%) Projections, By Type, 2022 to 2032

Figure 93: East Asia Market Attractiveness By Type, 2022 to 2032

Figure 94: East Asia Market Value (US$ Million) Analysis By Fabric Type, 2017 to 2032

Figure 95: East Asia Market Volume (Units) Analysis By Fabric Type, 2017 to 2032

Figure 96: East Asia Market Y-o-Y Growth (%) Projections, By Fabric Type, 2022 to 2032

Figure 97: East Asia Market Attractiveness By Fabric Type, 2022 to 2032

Figure 98: East Asia Market Value (US$ Million) Analysis By Consumer Orientation, 2017 to 2032

Figure 99: East Asia Market Volume (Units) Analysis By Consumer Orientation, 2017 to 2032

Figure 100: East Asia Market Y-o-Y Growth (%) Projections, By Consumer Orientation, 2022 to 2032

Figure 101: East Asia Market Attractiveness By Consumer Orientation, 2022 to 2032

Figure 102: East Asia Market Value (US$ Million) Analysis By Distribution Channel, 2017 to 2032

Figure 103: East Asia Market Volume (Units) Analysis By Distribution Channel, 2017 to 2032

Figure 104: East Asia Market Y-o-Y Growth (%) Projections, By Distribution Channel, 2022 to 2032

Figure 105: East Asia Market Attractiveness By Distribution Channel, 2022 to 2032

Figure 106: South Asia Market Value (US$ Million) Analysis By Country, 2017 to 2032

Figure 107: South Asia Market Volume (Units) Analysis By Country, 2017 to 2032

Figure 108: South Asia Market Y-o-Y Growth (%) Projections, By Country, 2022 to 2032

Figure 109: South Asia Market Attractiveness By Country, 2022 to 2032

Figure 110: South Asia Market Value (US$ Million) Analysis By Type, 2017 to 2032

Figure 111: South Asia Market Volume (Units) Analysis By Type, 2017 to 2032

Figure 112: South Asia Market Y-o-Y Growth (%) Projections, By Type, 2022 to 2032

Figure 113: South Asia Market Attractiveness By Type, 2022 to 2032

Figure 114: South Asia Market Value (US$ Million) Analysis By Fabric Type, 2017 to 2032

Figure 115: South Asia Market Volume (Units) Analysis By Fabric Type, 2017 to 2032

Figure 116: South Asia Market Y-o-Y Growth (%) Projections, By Fabric Type, 2022 to 2032

Figure 117: South Asia Market Attractiveness By Fabric Type, 2022 to 2032

Figure 118: South Asia Market Value (US$ Million) Analysis By Consumer Orientation, 2017 to 2032

Figure 119: South Asia Market Volume (Units) Analysis By Consumer Orientation, 2017 to 2032

Figure 120: South Asia Market Y-o-Y Growth (%) Projections, By Consumer Orientation, 2022 to 2032

Figure 121: South Asia Market Attractiveness By Consumer Orientation, 2022 to 2032

Figure 122: South Asia Market Value (US$ Million) Analysis By Distribution Channel, 2017 to 2032

Figure 123: South Asia Market Volume (Units) Analysis By Distribution Channel, 2017 to 2032

Figure 124: South Asia Market Y-o-Y Growth (%) Projections, By Distribution Channel, 2022 to 2032

Figure 125: South Asia Market Attractiveness By Distribution Channel, 2022 to 2032

Figure 126: Oceania Market Value (US$ Million) Analysis By Country, 2017 to 2032

Figure 127: Oceania Market Volume (Units) Analysis By Country, 2017 to 2032

Figure 128: Oceania Market Y-o-Y Growth (%) Projections, By Country, 2022 to 2032

Figure 129: Oceania Market Attractiveness By Country, 2022 to 2032

Figure 130: Oceania Market Value (US$ Million) Analysis By Type, 2017 to 2032

Figure 131: Oceania Market Volume (Units) Analysis By Type, 2017 to 2032

Figure 132: Oceania Market Y-o-Y Growth (%) Projections, By Type, 2022 to 2032

Figure 133: Oceania Market Attractiveness By Type, 2022 to 2032

Figure 134: Oceania Market Value (US$ Million) Analysis By Fabric Type, 2017 to 2032

Figure 135: Oceania Market Volume (Units) Analysis By Fabric Type, 2017 to 2032

Figure 136: Oceania Market Y-o-Y Growth (%) Projections, By Fabric Type, 2022 to 2032

Figure 137: Oceania Market Attractiveness By Fabric Type, 2022 to 2032

Figure 138: Oceania Market Value (US$ Million) Analysis By Consumer Orientation, 2017 to 2032

Figure 139: Oceania Market Volume (Units) Analysis By Consumer Orientation, 2017 to 2032

Figure 140: Oceania Market Y-o-Y Growth (%) Projections, By Consumer Orientation, 2022 to 2032

Figure 141: Oceania Market Attractiveness By Consumer Orientation, 2022 to 2032

Figure 142: Oceania Market Value (US$ Million) Analysis By Distribution Channel, 2017 to 2032

Figure 143: Oceania Market Volume (Units) Analysis By Distribution Channel, 2017 to 2032

Figure 144: Oceania Market Y-o-Y Growth (%) Projections, By Distribution Channel, 2022 to 2032

Figure 145: Oceania Market Attractiveness By Distribution Channel, 2022 to 2032

Figure 146: MEA Market Value (US$ Million) Analysis By Country, 2017 to 2032

Figure 147: MEA Market Volume (Units) Analysis By Country, 2017 to 2032

Figure 148: MEA Market Y-o-Y Growth (%) Projections, By Country, 2022 to 2032

Figure 149: MEA Market Attractiveness By Country, 2022 to 2032

Figure 150: MEA Market Value (US$ Million) Analysis By Type, 2017 to 2032

Figure 151: MEA Market Volume (Units) Analysis By Type, 2017 to 2032

Figure 152: MEA Market Y-o-Y Growth (%) Projections, By Type, 2022 to 2032

Figure 153: MEA Market Attractiveness By Type, 2022 to 2032

Figure 154: MEA Market Value (US$ Million) Analysis By Fabric Type, 2017 to 2032

Figure 155: MEA Market Volume (Units) Analysis By Fabric Type, 2017 to 2032

Figure 156: MEA Market Y-o-Y Growth (%) Projections, By Fabric Type, 2022 to 2032

Figure 157: MEA Market Attractiveness By Fabric Type, 2022 to 2032

Figure 158: MEA Market Value (US$ Million) Analysis By Consumer Orientation, 2017 to 2032

Figure 159: MEA Market Volume (Units) Analysis By Consumer Orientation, 2017 to 2032

Figure 160: MEA Market Y-o-Y Growth (%) Projections, By Consumer Orientation, 2022 to 2032

Figure 161: MEA Market Attractiveness By Consumer Orientation, 2022 to 2032

Figure 162: MEA Market Value (US$ Million) Analysis By Distribution Channel, 2017 to 2032

Figure 163: MEA Market Volume (Units) Analysis By Distribution Channel, 2017 to 2032

Figure 164: MEA Market Y-o-Y Growth (%) Projections, By Distribution Channel, 2022 to 2032

Figure 165: MEA Market Attractiveness By Distribution Channel, 2022 to 2032

Frequently Asked Questions

What is the current bamboo apparel market value?

The market for bamboo apparel reached a valuation of USD 2,122.1 Million in 2021.

Who are the leading players driving the demand for bamboo apparels?

Leading players operating in the market are China Bambro Textile Co, Ltd., Bamboo Textile Co., Advantage Fibres, Wild Fibres, TIC Gums, China Thrive Industrial Co., and Towel Industrial Co. Ltd among others.

What are the key trends in the market for bamboo apparel market?

Growing sustainability concerns and cost-effective fashion trend across the globe is predicted to propel the demand in the market.

What is the demand outlook for bamboo apparel in the market?

Sales in the market are projected to reach a valuation of USD 4,026.9 Million by the end of 2032.

Which are the leading countries fueling the demand for bamboo apparels?

Demand for bamboo apparel in the market is anticipated to rise at a CAGR of 6% over the forecast period (2022 to 2032)

Explore Consumer Behavior Insights

Future Market Insights

Bamboo Apparel Market