Reports

- Global Locations -

Headquarters

Future Market Insights, Inc.

Christiana Corporate, 200
Continental Drive, Suite 401,
Newark, Delaware - 19713,
United States

T: +1-845-579-5705

Americas

Future Market Insights, Inc.

616 Corporate Way, Suite 2-9018,
Valley Cottage, NY 10989, United States

T: +1-347-918-3531

MEA

Future Market Insights

1602-6 Jumeirah Bay X2 Tower, Plot No: JLT-PH2-X2A,
Jumeirah Lakes Towers, Dubai,
United Arab Emirates

Europe

Future Market Insights

3rd Floor, 207 Regent Street,
W1B 3HH London
United Kingdom

T: + 44 (0) 20 8123 9659
D: +44 (0) 20 3287 4268

Asia Pacific

Future Market Insights

IndiaLand Global Tech Park, Unit UG-1, Behind Grand HighStreet, Phase 1, Hinjawadi, MH, Pune – 411057, India

Bamboo Packaging Market Outlook (2023 to 2033)

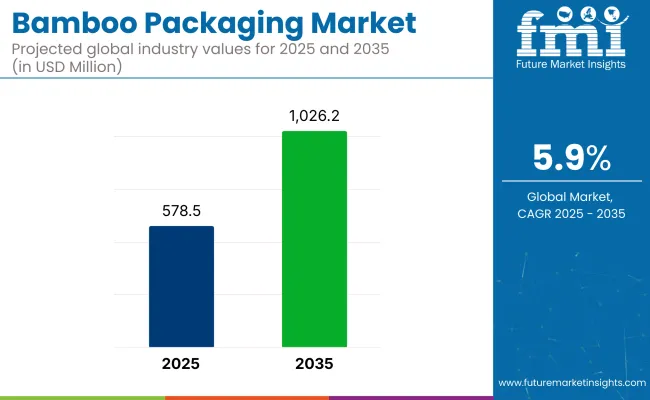
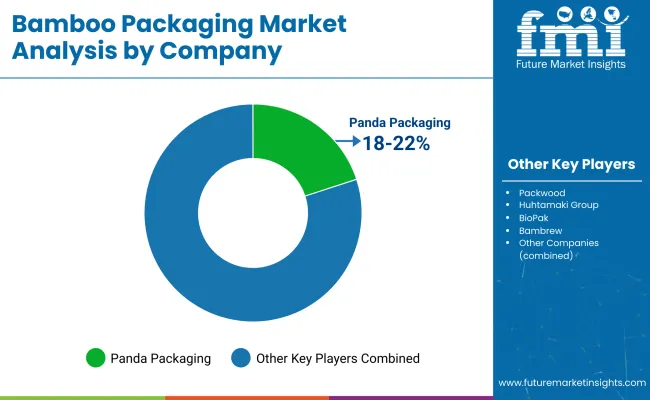
The global bamboo packaging market is set to enjoy a valuation of US$ 511 million in 2023 and further expand at a CAGR of 6.4% to reach US$ 950.3 million by 2033. Sales of bamboo packaging are anticipated to bolster at a robust pace, as the top 5 providers contributed 25 to 30% of revenue share in 2022.

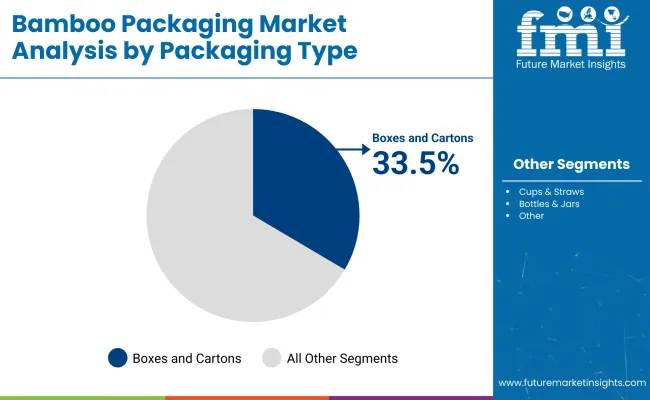
Based on the packaging types, the cups & straws segment is estimated to hold around 24% of the market value share by the end of 2033. This is due to the increasing demand for cups & straws by food service providers and the adoption of sustainable packaging solutions.

According to Future Market Insights (FMI), the bamboo packaging market totaled US$ 480.3 million in 2022 and is estimated to be worth US$ 950.3 million by 2033. The top 3 countries held around 35 to 40% of the global bamboo packaging market in 2022. A new forecast by FMI estimates that bamboo packaging sales are projected to create an incremental growth opportunity of US$ 414.8 million during the forecast years.

Regionally, South Asia and East Asia are anticipated to be the most remunerative markets due to the easy availability of bamboo material coupled with rising applications in food & beverage and cosmetics & personal care industries. On the back of these factors, the market is slated to expand by nearly 2x during the forecast period.

Attribute Details
Global Bamboo Packaging Market Valuation in 2022 US$ 480.3 million
Estimated Global Market Share in 2023 US$ 511 million
Forecasted Global Market Size by 2033 US$ 950.3 million
Projected Global Market Growth Rate from 2023 to 2033 6.4% CAGR
Historical Market Growth Rate from 2018 to 2022 4% CAGR
Collective Value Share of 3 Top Performing Countries in 2022 35 to 40%

Don't pay for what you don't need

Customize your report by selecting specific countries or regions and save 30%!

Bamboo Packaging Market Sales Analysis (2018 to 2022) Vs. Demand Forecast (2023 to 2033)

The bamboo packaging market recorded a 4.0% CAGR in the historical period of 2018 to 2022, according to Future Market Insights (FMI). The growing trend of sustainable and cost-effective packaging solutions in diverse industries such as food & beverage, personal care, and others underpins growth in the market.

Rising consciousness towards increasing environmental concerns and pollution is one of the core reasons the demand for bamboo packaging is surging. Preference for sustainable packaging compared to single-use plastic is also growing due to the stringent regulations on plastic use.

The bamboo packaging includes different packaging types such as cups & straws, bottles & jars, boxes & cartons, clamshells, tubes, mailers, barrels, crates, pallets, and others. Manufacturers are also spending resources on research and development to innovate new products and market their products in this packaging to woo consumers.

Initiatives from the government are supporting the cultivation of bamboo, and packaging manufacturers are trying to substitute plastic packaging with bamboo packaging. Bamboo is considered a sustainable and cost-effective source as it aids in reducing carbon footprints.

With increasing global warming and the burgeoning use of plastic, the amount of plastic waste has surged across the globe. To curb this, governments across the globe and end users are banning plastic packaging, resulting in increased sales of bamboo packaging. For instance, in 2018, India announced the launch of the Bamboo Mission to promote the use and conservation of bamboo and bamboo products.

Factors Prompting the Adoption of Bamboo Packaging

Need to Replace Plastic Packaging among End Users to Spur Sales

Due to the negative impact of plastic packaging on the environment, the need for sustainable packaging has increased. Bamboo is a natural material used for packaging purposes in diverse industries. Manufacturers are moving away from disposable plastics and are adapting bamboo packaging as an alternative solution.

Bamboo packaging is the best alternative to plastic packaging as it is natural, biodegradable, and cheaper to produce. As bamboo has over 1,000 species and can be cultivated in any rigid conditions, its easy availability has made it an easy and cost-effective solution to the plastic problem.

Bamboo produces nearly 35% more oxygen than other trees, which aids in reducing carbon footprints and is biodegradable. Hence, manufacturers are using bamboo packaging in packaging products such as boxes, straws, pallets, etc., making it a perfect alternative to plastic packaging. Thus, the demand for bamboo packaging is driven up by the increasing demand as a replacement for plastic packaging in the various end-use industries.

Application from Food & Beverage to Create Remunerative Prospects

Packaging plays an important role in the food industry as it protects food items from the external environment and contamination. Food containers made from bamboo are ideal for food packaging, as they are biodegradable and a secure packaging option. Bamboo packaging is also good insulation, which makes it a packaging option for both hot and cold food items.

The biological qualities of bamboo make it a striking option for disposable items such as food wrappers, takeout containers, coffee cups, boxes, and straws. In addition, bamboo packaging does not leech any harmful substances into the food as compared to plastic or any other food packaging material. Hence, the demand for eco-friendly packaging from the food industry is enhancing the growth of the bamboo packaging market.

Ismail Sutaria
Ismail Sutaria

Principal Consultant

Talk to Analyst

Find your sweet spots for generating winning opportunities in this market.

Country-wise insights

Need for Safe & Sustainable Packaging in the Food Service Industry to Boost the Market

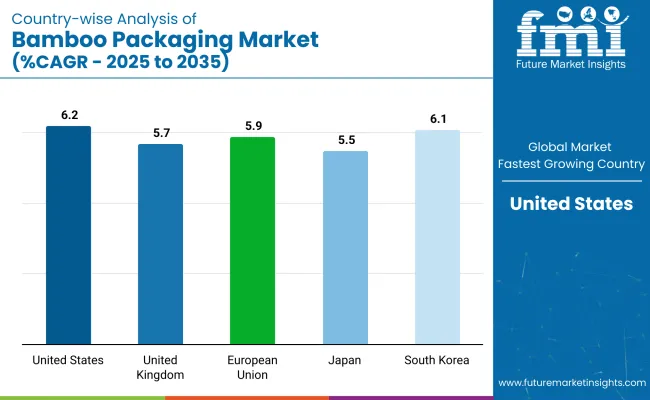
The United States bamboo packaging market is expected to create a growth opportunity of US$ 71.1 million during the forecast period. Bamboo packaging is expected to witness significant growth in the United States market due to the growing food service sector. As per the United States Department of Agriculture, in the year 2021, the food service industry and food retailing industries supplied food worth US$ 2.12 trillion.

In 2022, fast food and full-service restaurants accounted for around 70% of all food sales. The growth of the food & food service industry is bolstering the growth of bamboo packaging in the country.

Demand for Safe Packaging from the Cosmetic Industry to Generate Higher Profits

FMI opines that bamboo packaging in Germany is estimated to grow at a rate of 4.8% CAGR during the forecast period. In Europe, Germany has witnessed significant growth in the bamboo packaging market compared to other nations. According to Cosmetics Europe, Germany is considered the largest market for cosmetics and personal care.

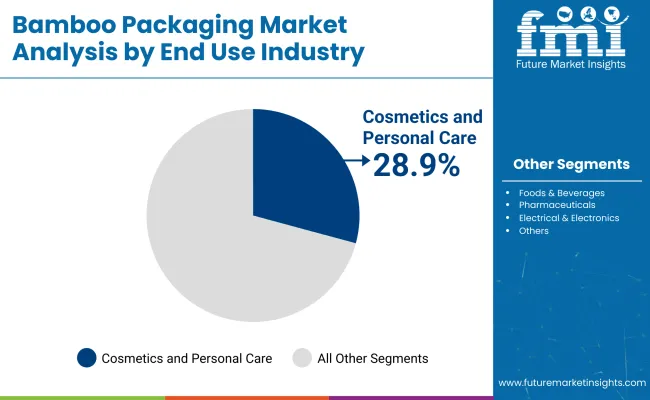
Bamboo packaging is extensively used in the cosmetics industry as it is considered the most sustainable solution. In addition, it is used to safeguard the integrity of cosmetics products and is a cheaper packaging solution. Thus, the significant growth of the cosmetics & personal care industry is expected to create revenue-generating opportunities for bamboo packaging manufacturers.

Category-wise Insights

Rising Use of Cups & Straws in the Food & Beverage Sector to Create Lucrative Prospects

In terms of product type, the cups & straws segment accounted for around 21% of the market value share in the year 2022. Further, growth in the segment is expected to surge by 2.1 times the current sales during the forecast period.

Bamboo cups & straws are the best alternative to toxic plastic cups & straws. Bamboo cups & straws are long-lasting and reusable, and the presence of the natural fiber in bamboo makes them highly durable. Moreover, bamboo cups & straws are completely natural and can be grown without harmful substances.

These cups & straws do not damage the environment and can be tossed off anywhere to get them to compose naturally. Thus, due to these benefits, bamboo cups & straws are popular packaging types in the global bamboo packaging market. Also, cups and straws are the most used products, especially in the food & beverage sector. Hence, packaging manufacturers are leveraging their sustainable packaging solutions to capitalize on the extensive use of these products.

The Trend of Aesthetic Look in the Food & Beverage Sector to Augment Demand

As per FMI, the food & beverages segment is considered the most lucrative segment over the forecast period. Sales in the segment are projected to register a CAGR of 5.9% between 2023 and 2033.

End users are adopting safe and sustainable bamboo packaging as it eliminates the risk of consumption of harmful chemicals leached from other packaging materials like plastic. Also, the growing trend of aesthetic packaging among Gen-Z and millennials is amplifying sales in the food & beverage industry.

Citing this trend, numerous restaurants and food services are focusing on the ambiance and vibes along with good food. As bamboo packaging provides an earthier and eco-friendly look, several food service and restaurant chains are increasing their adoption, propelling growth in the market.

Get the data you need at a Fraction of the cost

Personalize your report by choosing insights you need
and save 40%!

Competitive Landscape

Key players operating in the global bamboo packaging market are focusing on expanding their capabilities and resources to meet the growing demand for sustainable packaging. They are also aiming for mergers and acquisitions strategies. Some of the latest key developments by the key players are -

  • In March 2022, BeGreen Packaging expanded its packaging capabilities. They expanded their capabilities by including direct print to fiber and various packaging of geometric designs. This expansion may help the company in achieving packaging optimization and highly attractive packaging.
  • In April 2021, Huhtamäki Oyj announced the acquisition of Jiangsu Hihio-Art Packaging Co. Ltd. This acquisition may help Huhtamaki strengthen its position as a leading food-packaging provider and may extend its portfolio in the Asian region.

Bamboo Packaging in 2022: Moso, Dasso, and Tenbro Making It Sustainable, Yet Profitable!

The shift toward sustainability is felt across a range of products and services across the globe. The packaging industry is no different as it moves toward sustainability and eco-friendly products joining the bandwagon. Amongst the various available sustainable packaging solutions, bamboo packaging has gained prominence on account of its sturdiness and cost.

Moso International, one of the leading bamboo packaging pioneers, is betting big on this mode of packaging by launching a wide range of solutions for the needs of end-users. A key strategy of Moso International is to partner with companies that have a strong distribution network, as effective distribution is key to business growth in this space.

Moso International is analyzing the growing demand for bamboo packaging, and accordingly, it is investing in ramping up its production. The company is also opening new offices across the globe to be closer to end-users and ensure a seamless supply chain network. For instance, in 2022, the company announced it is reconstructing its head office in the Netherlands.

Dasso International, another prominent bamboo packaging manufacturer, is expanding into new territories to drive its growth. The company is opening new centers where bamboo cultivation and production are high. For instance, the company announced in June 2022 that it may open a new factory in Fujian, China. The new facility may have an output value of nearly 1 million square meters, and it may mainly produce the popular range of bamboo products known as dassoCTECH PLUS 3050.

Shanghai Tenbro Bamboo Textile Co Ltd. is focusing on offering bamboo packaging at a low cost to consolidate its position. The company’s leading bamboo product range, Tenbro, is widely noted for its sturdiness as well as affordability. In addition to being a leading producer of bamboo products, the company is also a prominent distributor of natural and manmade fibers. Shanghai Tenbro Bamboo Textiles Co Ltd. is involved in Research and Development practices, and many of its packaging solutions are patented. The company is among the first manufacturers accredited by the State Intellectual Property Bureau.

Scope of the Report

Attribute Details
Market Size 2022 US$ 480.3 million
Market Size 2033 US$ 950.3 million
Growth Rate CAGR of 6.4% from 2023 to 2033
Base Year for Estimation 2022
Historical Data 2015 to 2021
Forecast Period 2023 to 2033
Quantitative Units Revenue in US$ million and CAGR from 2023 to 2033
Report Coverage Revenue Forecast, Volume Forecast, Company Ranking, Competitive Landscape, Growth Factors, Trends, and Pricing Analysis
Segments Covered
  • Pulp Type
  • Packaging Type
  • End-use Industry
  • Region
Regions Covered
  • North America
  • Latin America
  • Europe
  • East Asia
  • South Asia
  • The Middle East and Africa
  • Oceania
Key Countries Covered
  • United States of America
  • Canada
  • Mexico
  • Brazil
  • Germany
  • United Kingdom
  • France
  • Italy
  • Spain
  • Russia
  • China
  • Japan
  • India
  • GCC countries
  • Australia
Key Companies Profiled
  • Huhtamäki Oyj
  • APackaging Group.
  • Pi Sustainable Packaging Co. Ltd.
  • Bloom Eco Packaging Co. Ltd.
  • Golden Arrow Inc.
  • Three Bamboo
  • Xiamen HBD Industry & Trade CO. LTD
  • Meysher Industrial Group
  • Sunken
  • GUANGZHOU HUIHUA PACKAGING PRODUCTS CO. LTD
  • Ningbo Willest International Trading Co. Ltd.
  • Yiwu Cool Commodity Co. Ltd.
  • Zhejiang Pando EP Technology Co.
  • BeGreen Packaging

Bamboo Packaging Market by Category

By Pulp Type:

  • Recycled Pulp
  • Virgin Pulp

By Packaging Type:

  • Cups & Straws
  • Bottles & Jars
  • Boxes & Cartons
  • Clamshell
  • Tubes
  • Mailers
  • Barrels
  • Crates
  • Pallets
  • Others (Bowls, Plates, etc.)

By End Use Industry:

  • Foods & Beverages
  • Pharmaceuticals
  • Cosmetics & Personal Care
  • Electrical & Electronics
  • E-Commerce
  • Automotive
  • Agriculture

By Region:

  • North America
  • Latin America
  • Europe
  • South Asia
  • East Asia
  • The Middle East & Africa
  • Oceania

Frequently Asked Questions

What does the Current Assessed Value of the Bamboo Packaging Market Amount to?

A valuation of US$ 511 million is attributed to the bamboo packaging market in 2023.

What is the Projected Size of the Bamboo Packaging Market by 2033?

The global bamboo packaging market size is anticipated to surpass US$ 950.3 million by 2033.

What is the CAGR Prediction for the Bamboo Packaging Market?

The bamboo packaging market is projected to accelerate at a CAGR of 6.4% between 2023 and 2033.

Which are the Top Two Countries Signifying Notable Profitability Potential for Bamboo Packaging?

India and China are the primary countries showcasing significant lucrativeness for bamboo packaging.

How has the Bamboo Packaging Market Evolved over the Past Five Years?

With a 4% CAGR between 2018 and 2022, the bamboo packaging market reached US$ 480.3 million in 2022.

Table of Content

1. Executive Summary

    1.1. Global Market Outlook

    1.2. Demand-side Trends

    1.3. Supply-side Trends

    1.4. Technology Roadmap Analysis

    1.5. Analysis and Recommendations

2. Market Overview

    2.1. Market Coverage / Taxonomy

    2.2. Market Definition / Scope / Limitations

3. Market Background

    3.1. Market Dynamics

        3.1.1. Drivers

        3.1.2. Restraints

        3.1.3. Opportunity

        3.1.4. Trends

    3.2. Scenario Forecast

        3.2.1. Demand in Optimistic Scenario

        3.2.2. Demand in Likely Scenario

        3.2.3. Demand in Conservative Scenario

    3.3. Opportunity Map Analysis

    3.4. Product Life Cycle Analysis

    3.5. Supply Chain Analysis

        3.5.1. Supply Side Participants and their Roles

            3.5.1.1. Producers

            3.5.1.2. Mid-Level Participants (Traders/ Agents/ Brokers)

            3.5.1.3. Wholesalers and Distributors

        3.5.2. Value Added and Value Created at Node in the Supply Chain

        3.5.3. List of Raw Material Suppliers

        3.5.4. List of Existing and Potential Buyer’s

    3.6. Investment Feasibility Matrix

    3.7. Value Chain Analysis

        3.7.1. Profit Margin Analysis

        3.7.2. Wholesalers and Distributors

        3.7.3. Retailers

    3.8. PESTLE and Porter’s Analysis

    3.9. Regulatory Landscape

        3.9.1. By Key Regions

        3.9.2. By Key Countries

    3.10. Regional Parent Market Outlook

    3.11. Production and Consumption Statistics

    3.12. Import and Export Statistics

4. Global Market Analysis 2018 to 2022 and Forecast, 2023 to 2033

    4.1. Historical Market Size Value (US$ Million) & Volume (Units) Analysis, 2018 to 2022

    4.2. Current and Future Market Size Value (US$ Million) & Volume (Units) Projections, 2023 to 2033

        4.2.1. Y-o-Y Growth Trend Analysis

        4.2.2. Absolute $ Opportunity Analysis

5. Global Market Analysis 2018 to 2022 and Forecast 2023 to 2033, By Pulp Type

    5.1. Introduction / Key Findings

    5.2. Historical Market Size Value (US$ Million) & Volume (Units) Analysis By Pulp Type, 2018 to 2022

    5.3. Current and Future Market Size Value (US$ Million) & Volume (Units) Analysis and Forecast By Pulp Type, 2023 to 2033

        5.3.1. Recycled Pulp

        5.3.2. Virgin Pulp

    5.4. Y-o-Y Growth Trend Analysis By Pulp Type, 2018 to 2022

    5.5. Absolute $ Opportunity Analysis By Pulp Type, 2023 to 2033

6. Global Market Analysis 2018 to 2022 and Forecast 2023 to 2033, By Packaging Type

    6.1. Introduction / Key Findings

    6.2. Historical Market Size Value (US$ Million) & Volume (Units) Analysis By Packaging Type, 2018 to 2022

    6.3. Current and Future Market Size Value (US$ Million) & Volume (Units) Analysis and Forecast By Packaging Type, 2023 to 2033

        6.3.1. Cups & Straws

        6.3.2. Bottles & Jars

        6.3.3. Boxes & Cartons

        6.3.4. Clamshell

        6.3.5. Tubes

        6.3.6. Mailers

        6.3.7. Barrels

        6.3.8. Crates

        6.3.9. Pallets

        6.3.10. Others

    6.4. Y-o-Y Growth Trend Analysis By Packaging Type, 2018 to 2022

    6.5. Absolute $ Opportunity Analysis By Packaging Type, 2023 to 2033

7. Global Market Analysis 2018 to 2022 and Forecast 2023 to 2033, By End-use Industry

    7.1. Introduction / Key Findings

    7.2. Historical Market Size Value (US$ Million) & Volume (Units) Analysis By End-use Industry, 2018 to 2022

    7.3. Current and Future Market Size Value (US$ Million) & Volume (Units) Analysis and Forecast By End-use Industry, 2023 to 2033

        7.3.1. Foods & Beverages

        7.3.2. Pharmaceuticals

        7.3.3. Cosmetics & Personal Care

        7.3.4. Electrical & Electronics

        7.3.5. E-Commerce

        7.3.6. Automotive

        7.3.7. Agriculture

    7.4. Y-o-Y Growth Trend Analysis By End-use Industry, 2018 to 2022

    7.5. Absolute $ Opportunity Analysis By End-use Industry, 2023 to 2033

8. Global Market Analysis 2018 to 2022 and Forecast 2023 to 2033, By Region

    8.1. Introduction

    8.2. Historical Market Size Value (US$ Million) & Volume (Units) Analysis By Region, 2018 to 2022

    8.3. Current Market Size Value (US$ Million) & Volume (Units) Analysis and Forecast By Region, 2023 to 2033

        8.3.1. North America

        8.3.2. Latin America

        8.3.3. Western Europe

        8.3.4. Eastern Europe

        8.3.5. South Asia and Pacific

        8.3.6. East Asia

        8.3.7. Middle East and Africa

    8.4. Market Attractiveness Analysis By Region

9. North America Market Analysis 2018 to 2022 and Forecast 2023 to 2033, By Country

    9.1. Historical Market Size Value (US$ Million) & Volume (Units) Trend Analysis By Market Taxonomy, 2018 to 2022

    9.2. Market Size Value (US$ Million) & Volume (Units) Forecast By Market Taxonomy, 2023 to 2033

        9.2.1. By Country

            9.2.1.1. The USA

            9.2.1.2. Canada

        9.2.2. By Pulp Type

        9.2.3. By Packaging Type

        9.2.4. By End-use Industry

    9.3. Market Attractiveness Analysis

        9.3.1. By Country

        9.3.2. By Pulp Type

        9.3.3. By Packaging Type

        9.3.4. By End-use Industry

    9.4. Key Takeaways

10. Latin America Market Analysis 2018 to 2022 and Forecast 2023 to 2033, By Country

    10.1. Historical Market Size Value (US$ Million) & Volume (Units) Trend Analysis By Market Taxonomy, 2018 to 2022

    10.2. Market Size Value (US$ Million) & Volume (Units) Forecast By Market Taxonomy, 2023 to 2033

        10.2.1. By Country

            10.2.1.1. Brazil

            10.2.1.2. Mexico

            10.2.1.3. Rest of Latin America

        10.2.2. By Pulp Type

        10.2.3. By Packaging Type

        10.2.4. By End-use Industry

    10.3. Market Attractiveness Analysis

        10.3.1. By Country

        10.3.2. By Pulp Type

        10.3.3. By Packaging Type

        10.3.4. By End-use Industry

    10.4. Key Takeaways

11. Western Europe Market Analysis 2018 to 2022 and Forecast 2023 to 2033, By Country

    11.1. Historical Market Size Value (US$ Million) & Volume (Units) Trend Analysis By Market Taxonomy, 2018 to 2022

    11.2. Market Size Value (US$ Million) & Volume (Units) Forecast By Market Taxonomy, 2023 to 2033

        11.2.1. By Country

            11.2.1.1. Germany

            11.2.1.2. United Kingdom

            11.2.1.3. France

            11.2.1.4. Spain

            11.2.1.5. Italy

            11.2.1.6. Rest of Western Europe

        11.2.2. By Pulp Type

        11.2.3. By Packaging Type

        11.2.4. By End-use Industry

    11.3. Market Attractiveness Analysis

        11.3.1. By Country

        11.3.2. By Pulp Type

        11.3.3. By Packaging Type

        11.3.4. By End-use Industry

    11.4. Key Takeaways

12. Eastern Europe Market Analysis 2018 to 2022 and Forecast 2023 to 2033, By Country

    12.1. Historical Market Size Value (US$ Million) & Volume (Units) Trend Analysis By Market Taxonomy, 2018 to 2022

    12.2. Market Size Value (US$ Million) & Volume (Units) Forecast By Market Taxonomy, 2023 to 2033

        12.2.1. By Country

            12.2.1.1. Poland

            12.2.1.2. Russia

            12.2.1.3. Czech Republic

            12.2.1.4. Romania

            12.2.1.5. Rest of Eastern Europe

        12.2.2. By Pulp Type

        12.2.3. By Packaging Type

        12.2.4. By End-use Industry

    12.3. Market Attractiveness Analysis

        12.3.1. By Country

        12.3.2. By Pulp Type

        12.3.3. By Packaging Type

        12.3.4. By End-use Industry

    12.4. Key Takeaways

13. South Asia and Pacific Market Analysis 2018 to 2022 and Forecast 2023 to 2033, By Country

    13.1. Historical Market Size Value (US$ Million) & Volume (Units) Trend Analysis By Market Taxonomy, 2018 to 2022

    13.2. Market Size Value (US$ Million) & Volume (Units) Forecast By Market Taxonomy, 2023 to 2033

        13.2.1. By Country

            13.2.1.1. India

            13.2.1.2. Bangladesh

            13.2.1.3. Australia

            13.2.1.4. New Zealand

            13.2.1.5. Rest of South Asia and Pacific

        13.2.2. By Pulp Type

        13.2.3. By Packaging Type

        13.2.4. By End-use Industry

    13.3. Market Attractiveness Analysis

        13.3.1. By Country

        13.3.2. By Pulp Type

        13.3.3. By Packaging Type

        13.3.4. By End-use Industry

    13.4. Key Takeaways

14. East Asia Market Analysis 2018 to 2022 and Forecast 2023 to 2033, By Country

    14.1. Historical Market Size Value (US$ Million) & Volume (Units) Trend Analysis By Market Taxonomy, 2018 to 2022

    14.2. Market Size Value (US$ Million) & Volume (Units) Forecast By Market Taxonomy, 2023 to 2033

        14.2.1. By Country

            14.2.1.1. China

            14.2.1.2. Japan

            14.2.1.3. South Korea

        14.2.2. By Pulp Type

        14.2.3. By Packaging Type

        14.2.4. By End-use Industry

    14.3. Market Attractiveness Analysis

        14.3.1. By Country

        14.3.2. By Pulp Type

        14.3.3. By Packaging Type

        14.3.4. By End-use Industry

    14.4. Key Takeaways

15. Middle East and Africa Market Analysis 2018 to 2022 and Forecast 2023 to 2033, By Country

    15.1. Historical Market Size Value (US$ Million) & Volume (Units) Trend Analysis By Market Taxonomy, 2018 to 2022

    15.2. Market Size Value (US$ Million) & Volume (Units) Forecast By Market Taxonomy, 2023 to 2033

        15.2.1. By Country

            15.2.1.1. GCC Countries

            15.2.1.2. South Africa

            15.2.1.3. Israel

            15.2.1.4. Rest of MEA

        15.2.2. By Pulp Type

        15.2.3. By Packaging Type

        15.2.4. By End-use Industry

    15.3. Market Attractiveness Analysis

        15.3.1. By Country

        15.3.2. By Pulp Type

        15.3.3. By Packaging Type

        15.3.4. By End-use Industry

    15.4. Key Takeaways

16. Key Countries Market Analysis

    16.1. USA

        16.1.1. Pricing Analysis

        16.1.2. Market Share Analysis, 2022

            16.1.2.1. By Pulp Type

            16.1.2.2. By Packaging Type

            16.1.2.3. By End-use Industry

    16.2. Canada

        16.2.1. Pricing Analysis

        16.2.2. Market Share Analysis, 2022

            16.2.2.1. By Pulp Type

            16.2.2.2. By Packaging Type

            16.2.2.3. By End-use Industry

    16.3. Brazil

        16.3.1. Pricing Analysis

        16.3.2. Market Share Analysis, 2022

            16.3.2.1. By Pulp Type

            16.3.2.2. By Packaging Type

            16.3.2.3. By End-use Industry

    16.4. Mexico

        16.4.1. Pricing Analysis

        16.4.2. Market Share Analysis, 2022

            16.4.2.1. By Pulp Type

            16.4.2.2. By Packaging Type

            16.4.2.3. By End-use Industry

    16.5. Germany

        16.5.1. Pricing Analysis

        16.5.2. Market Share Analysis, 2022

            16.5.2.1. By Pulp Type

            16.5.2.2. By Packaging Type

            16.5.2.3. By End-use Industry

    16.6. United Kingdom

        16.6.1. Pricing Analysis

        16.6.2. Market Share Analysis, 2022

            16.6.2.1. By Pulp Type

            16.6.2.2. By Packaging Type

            16.6.2.3. By End-use Industry

    16.7. France

        16.7.1. Pricing Analysis

        16.7.2. Market Share Analysis, 2022

            16.7.2.1. By Pulp Type

            16.7.2.2. By Packaging Type

            16.7.2.3. By End-use Industry

    16.8. Spain

        16.8.1. Pricing Analysis

        16.8.2. Market Share Analysis, 2022

            16.8.2.1. By Pulp Type

            16.8.2.2. By Packaging Type

            16.8.2.3. By End-use Industry

    16.9. Italy

        16.9.1. Pricing Analysis

        16.9.2. Market Share Analysis, 2022

            16.9.2.1. By Pulp Type

            16.9.2.2. By Packaging Type

            16.9.2.3. By End-use Industry

    16.10. Poland

        16.10.1. Pricing Analysis

        16.10.2. Market Share Analysis, 2022

            16.10.2.1. By Pulp Type

            16.10.2.2. By Packaging Type

            16.10.2.3. By End-use Industry

    16.11. Russia

        16.11.1. Pricing Analysis

        16.11.2. Market Share Analysis, 2022

            16.11.2.1. By Pulp Type

            16.11.2.2. By Packaging Type

            16.11.2.3. By End-use Industry

    16.12. Czech Republic

        16.12.1. Pricing Analysis

        16.12.2. Market Share Analysis, 2022

            16.12.2.1. By Pulp Type

            16.12.2.2. By Packaging Type

            16.12.2.3. By End-use Industry

    16.13. Romania

        16.13.1. Pricing Analysis

        16.13.2. Market Share Analysis, 2022

            16.13.2.1. By Pulp Type

            16.13.2.2. By Packaging Type

            16.13.2.3. By End-use Industry

    16.14. India

        16.14.1. Pricing Analysis

        16.14.2. Market Share Analysis, 2022

            16.14.2.1. By Pulp Type

            16.14.2.2. By Packaging Type

            16.14.2.3. By End-use Industry

    16.15. Bangladesh

        16.15.1. Pricing Analysis

        16.15.2. Market Share Analysis, 2022

            16.15.2.1. By Pulp Type

            16.15.2.2. By Packaging Type

            16.15.2.3. By End-use Industry

    16.16. Australia

        16.16.1. Pricing Analysis

        16.16.2. Market Share Analysis, 2022

            16.16.2.1. By Pulp Type

            16.16.2.2. By Packaging Type

            16.16.2.3. By End-use Industry

    16.17. New Zealand

        16.17.1. Pricing Analysis

        16.17.2. Market Share Analysis, 2022

            16.17.2.1. By Pulp Type

            16.17.2.2. By Packaging Type

            16.17.2.3. By End-use Industry

    16.18. China

        16.18.1. Pricing Analysis

        16.18.2. Market Share Analysis, 2022

            16.18.2.1. By Pulp Type

            16.18.2.2. By Packaging Type

            16.18.2.3. By End-use Industry

    16.19. Japan

        16.19.1. Pricing Analysis

        16.19.2. Market Share Analysis, 2022

            16.19.2.1. By Pulp Type

            16.19.2.2. By Packaging Type

            16.19.2.3. By End-use Industry

    16.20. South Korea

        16.20.1. Pricing Analysis

        16.20.2. Market Share Analysis, 2022

            16.20.2.1. By Pulp Type

            16.20.2.2. By Packaging Type

            16.20.2.3. By End-use Industry

    16.21. GCC Countries

        16.21.1. Pricing Analysis

        16.21.2. Market Share Analysis, 2022

            16.21.2.1. By Pulp Type

            16.21.2.2. By Packaging Type

            16.21.2.3. By End-use Industry

    16.22. South Africa

        16.22.1. Pricing Analysis

        16.22.2. Market Share Analysis, 2022

            16.22.2.1. By Pulp Type

            16.22.2.2. By Packaging Type

            16.22.2.3. By End-use Industry

    16.23. Israel

        16.23.1. Pricing Analysis

        16.23.2. Market Share Analysis, 2022

            16.23.2.1. By Pulp Type

            16.23.2.2. By Packaging Type

            16.23.2.3. By End-use Industry

17. Market Structure Analysis

    17.1. Competition Dashboard

    17.2. Competition Benchmarking

    17.3. Market Share Analysis of Top Players

        17.3.1. By Regional

        17.3.2. By Pulp Type

        17.3.3. By Packaging Type

        17.3.4. By End-use Industry

18. Competition Analysis

    18.1. Competition Deep Dive

        18.1.1. Huhtamäki Oyj

            18.1.1.1. Overview

            18.1.1.2. Product Portfolio

            18.1.1.3. Profitability by Market Segments

            18.1.1.4. Sales Footprint

            18.1.1.5. Strategy Overview

                18.1.1.5.1. Marketing Strategy

                18.1.1.5.2. Product Strategy

                18.1.1.5.3. Channel Strategy

        18.1.2. APackaging Group.

            18.1.2.1. Overview

            18.1.2.2. Product Portfolio

            18.1.2.3. Profitability by Market Segments

            18.1.2.4. Sales Footprint

            18.1.2.5. Strategy Overview

                18.1.2.5.1. Marketing Strategy

                18.1.2.5.2. Product Strategy

                18.1.2.5.3. Channel Strategy

        18.1.3. Pi sustainable packaging Co. Ltd.

            18.1.3.1. Overview

            18.1.3.2. Product Portfolio

            18.1.3.3. Profitability by Market Segments

            18.1.3.4. Sales Footprint

            18.1.3.5. Strategy Overview

                18.1.3.5.1. Marketing Strategy

                18.1.3.5.2. Product Strategy

                18.1.3.5.3. Channel Strategy

        18.1.4. Bloom Eco Packaging Co. Ltd.

            18.1.4.1. Overview

            18.1.4.2. Product Portfolio

            18.1.4.3. Profitability by Market Segments

            18.1.4.4. Sales Footprint

            18.1.4.5. Strategy Overview

                18.1.4.5.1. Marketing Strategy

                18.1.4.5.2. Product Strategy

                18.1.4.5.3. Channel Strategy

        18.1.5. Golden Arrow Inc.

            18.1.5.1. Overview

            18.1.5.2. Product Portfolio

            18.1.5.3. Profitability by Market Segments

            18.1.5.4. Sales Footprint

            18.1.5.5. Strategy Overview

                18.1.5.5.1. Marketing Strategy

                18.1.5.5.2. Product Strategy

                18.1.5.5.3. Channel Strategy

        18.1.6. Three Bamboo

            18.1.6.1. Overview

            18.1.6.2. Product Portfolio

            18.1.6.3. Profitability by Market Segments

            18.1.6.4. Sales Footprint

            18.1.6.5. Strategy Overview

                18.1.6.5.1. Marketing Strategy

                18.1.6.5.2. Product Strategy

                18.1.6.5.3. Channel Strategy

        18.1.7. Xiamen HBD Industry & Trade CO. LTD

            18.1.7.1. Overview

            18.1.7.2. Product Portfolio

            18.1.7.3. Profitability by Market Segments

            18.1.7.4. Sales Footprint

            18.1.7.5. Strategy Overview

                18.1.7.5.1. Marketing Strategy

                18.1.7.5.2. Product Strategy

                18.1.7.5.3. Channel Strategy

        18.1.8. Meysher Industrial Group

            18.1.8.1. Overview

            18.1.8.2. Product Portfolio

            18.1.8.3. Profitability by Market Segments

            18.1.8.4. Sales Footprint

            18.1.8.5. Strategy Overview

                18.1.8.5.1. Marketing Strategy

                18.1.8.5.2. Product Strategy

                18.1.8.5.3. Channel Strategy

        18.1.9. Sunken

            18.1.9.1. Overview

            18.1.9.2. Product Portfolio

            18.1.9.3. Profitability by Market Segments

            18.1.9.4. Sales Footprint

            18.1.9.5. Strategy Overview

                18.1.9.5.1. Marketing Strategy

                18.1.9.5.2. Product Strategy

                18.1.9.5.3. Channel Strategy

        18.1.10. GUANGZHOU HUIHUA PACKAGING PRODUCTS CO. LTD

            18.1.10.1. Overview

            18.1.10.2. Product Portfolio

            18.1.10.3. Profitability by Market Segments

            18.1.10.4. Sales Footprint

            18.1.10.5. Strategy Overview

                18.1.10.5.1. Marketing Strategy

                18.1.10.5.2. Product Strategy

                18.1.10.5.3. Channel Strategy

        18.1.11. Ningbo Willest International Trading Co. Ltd.

            18.1.11.1. Overview

            18.1.11.2. Product Portfolio

            18.1.11.3. Profitability by Market Segments

            18.1.11.4. Sales Footprint

            18.1.11.5. Strategy Overview

                18.1.11.5.1. Marketing Strategy

                18.1.11.5.2. Product Strategy

                18.1.11.5.3. Channel Strategy

        18.1.12. Yiwu Cool Commodity Co. Ltd.

            18.1.12.1. Overview

            18.1.12.2. Product Portfolio

            18.1.12.3. Profitability by Market Segments

            18.1.12.4. Sales Footprint

            18.1.12.5. Strategy Overview

                18.1.12.5.1. Marketing Strategy

                18.1.12.5.2. Product Strategy

                18.1.12.5.3. Channel Strategy

        18.1.13. Zhejiang Pando EP Technology Co.

            18.1.13.1. Overview

            18.1.13.2. Product Portfolio

            18.1.13.3. Profitability by Market Segments

            18.1.13.4. Sales Footprint

            18.1.13.5. Strategy Overview

                18.1.13.5.1. Marketing Strategy

                18.1.13.5.2. Product Strategy

                18.1.13.5.3. Channel Strategy

        18.1.14. BeGreen Packaging

            18.1.14.1. Overview

            18.1.14.2. Product Portfolio

            18.1.14.3. Profitability by Market Segments

            18.1.14.4. Sales Footprint

            18.1.14.5. Strategy Overview

                18.1.14.5.1. Marketing Strategy

                18.1.14.5.2. Product Strategy

                18.1.14.5.3. Channel Strategy

        18.1.15. Bio Transito SAS

            18.1.15.1. Overview

            18.1.15.2. Product Portfolio

            18.1.15.3. Profitability by Market Segments

            18.1.15.4. Sales Footprint

            18.1.15.5. Strategy Overview

                18.1.15.5.1. Marketing Strategy

                18.1.15.5.2. Product Strategy

                18.1.15.5.3. Channel Strategy

19. Assumptions & Acronyms Used

20. Research Methodology

Don't pay for what you don't need

Customize your report by selecting specific countries or regions and save 30%!

List of Tables

Table 1: Global Market Value (US$ Million) Forecast by Region, 2018 to 2033

Table 2: Global Market Volume (Units) Forecast by Region, 2018 to 2033

Table 3: Global Market Value (US$ Million) Forecast by Pulp Type, 2018 to 2033

Table 4: Global Market Volume (Units) Forecast by Pulp Type, 2018 to 2033

Table 5: Global Market Value (US$ Million) Forecast by Packaging Type, 2018 to 2033

Table 6: Global Market Volume (Units) Forecast by Packaging Type, 2018 to 2033

Table 7: Global Market Value (US$ Million) Forecast by End-use Industry, 2018 to 2033

Table 8: Global Market Volume (Units) Forecast by End-use Industry, 2018 to 2033

Table 9: North America Market Value (US$ Million) Forecast by Country, 2018 to 2033

Table 10: North America Market Volume (Units) Forecast by Country, 2018 to 2033

Table 11: North America Market Value (US$ Million) Forecast by Pulp Type, 2018 to 2033

Table 12: North America Market Volume (Units) Forecast by Pulp Type, 2018 to 2033

Table 13: North America Market Value (US$ Million) Forecast by Packaging Type, 2018 to 2033

Table 14: North America Market Volume (Units) Forecast by Packaging Type, 2018 to 2033

Table 15: North America Market Value (US$ Million) Forecast by End-use Industry, 2018 to 2033

Table 16: North America Market Volume (Units) Forecast by End-use Industry, 2018 to 2033

Table 17: Latin America Market Value (US$ Million) Forecast by Country, 2018 to 2033

Table 18: Latin America Market Volume (Units) Forecast by Country, 2018 to 2033

Table 19: Latin America Market Value (US$ Million) Forecast by Pulp Type, 2018 to 2033

Table 20: Latin America Market Volume (Units) Forecast by Pulp Type, 2018 to 2033

Table 21: Latin America Market Value (US$ Million) Forecast by Packaging Type, 2018 to 2033

Table 22: Latin America Market Volume (Units) Forecast by Packaging Type, 2018 to 2033

Table 23: Latin America Market Value (US$ Million) Forecast by End-use Industry, 2018 to 2033

Table 24: Latin America Market Volume (Units) Forecast by End-use Industry, 2018 to 2033

Table 25: Western Europe Market Value (US$ Million) Forecast by Country, 2018 to 2033

Table 26: Western Europe Market Volume (Units) Forecast by Country, 2018 to 2033

Table 27: Western Europe Market Value (US$ Million) Forecast by Pulp Type, 2018 to 2033

Table 28: Western Europe Market Volume (Units) Forecast by Pulp Type, 2018 to 2033

Table 29: Western Europe Market Value (US$ Million) Forecast by Packaging Type, 2018 to 2033

Table 30: Western Europe Market Volume (Units) Forecast by Packaging Type, 2018 to 2033

Table 31: Western Europe Market Value (US$ Million) Forecast by End-use Industry, 2018 to 2033

Table 32: Western Europe Market Volume (Units) Forecast by End-use Industry, 2018 to 2033

Table 33: Eastern Europe Market Value (US$ Million) Forecast by Country, 2018 to 2033

Table 34: Eastern Europe Market Volume (Units) Forecast by Country, 2018 to 2033

Table 35: Eastern Europe Market Value (US$ Million) Forecast by Pulp Type, 2018 to 2033

Table 36: Eastern Europe Market Volume (Units) Forecast by Pulp Type, 2018 to 2033

Table 37: Eastern Europe Market Value (US$ Million) Forecast by Packaging Type, 2018 to 2033

Table 38: Eastern Europe Market Volume (Units) Forecast by Packaging Type, 2018 to 2033

Table 39: Eastern Europe Market Value (US$ Million) Forecast by End-use Industry, 2018 to 2033

Table 40: Eastern Europe Market Volume (Units) Forecast by End-use Industry, 2018 to 2033

Table 41: South Asia and Pacific Market Value (US$ Million) Forecast by Country, 2018 to 2033

Table 42: South Asia and Pacific Market Volume (Units) Forecast by Country, 2018 to 2033

Table 43: South Asia and Pacific Market Value (US$ Million) Forecast by Pulp Type, 2018 to 2033

Table 44: South Asia and Pacific Market Volume (Units) Forecast by Pulp Type, 2018 to 2033

Table 45: South Asia and Pacific Market Value (US$ Million) Forecast by Packaging Type, 2018 to 2033

Table 46: South Asia and Pacific Market Volume (Units) Forecast by Packaging Type, 2018 to 2033

Table 47: South Asia and Pacific Market Value (US$ Million) Forecast by End-use Industry, 2018 to 2033

Table 48: South Asia and Pacific Market Volume (Units) Forecast by End-use Industry, 2018 to 2033

Table 49: East Asia Market Value (US$ Million) Forecast by Country, 2018 to 2033

Table 50: East Asia Market Volume (Units) Forecast by Country, 2018 to 2033

Table 51: East Asia Market Value (US$ Million) Forecast by Pulp Type, 2018 to 2033

Table 52: East Asia Market Volume (Units) Forecast by Pulp Type, 2018 to 2033

Table 53: East Asia Market Value (US$ Million) Forecast by Packaging Type, 2018 to 2033

Table 54: East Asia Market Volume (Units) Forecast by Packaging Type, 2018 to 2033

Table 55: East Asia Market Value (US$ Million) Forecast by End-use Industry, 2018 to 2033

Table 56: East Asia Market Volume (Units) Forecast by End-use Industry, 2018 to 2033

Table 57: Middle East and Africa Market Value (US$ Million) Forecast by Country, 2018 to 2033

Table 58: Middle East and Africa Market Volume (Units) Forecast by Country, 2018 to 2033

Table 59: Middle East and Africa Market Value (US$ Million) Forecast by Pulp Type, 2018 to 2033

Table 60: Middle East and Africa Market Volume (Units) Forecast by Pulp Type, 2018 to 2033

Table 61: Middle East and Africa Market Value (US$ Million) Forecast by Packaging Type, 2018 to 2033

Table 62: Middle East and Africa Market Volume (Units) Forecast by Packaging Type, 2018 to 2033

Table 63: Middle East and Africa Market Value (US$ Million) Forecast by End-use Industry, 2018 to 2033

Table 64: Middle East and Africa Market Volume (Units) Forecast by End-use Industry, 2018 to 2033
Ismail Sutaria
Ismail Sutaria

Principal Consultant

Talk to Analyst

Find your sweet spots for generating winning opportunities in this market.

List of Charts

Figure 1: Global Market Value (US$ Million) by Pulp Type, 2023 to 2033

Figure 2: Global Market Value (US$ Million) by Packaging Type, 2023 to 2033

Figure 3: Global Market Value (US$ Million) by End-use Industry, 2023 to 2033

Figure 4: Global Market Value (US$ Million) by Region, 2023 to 2033

Figure 5: Global Market Value (US$ Million) Analysis by Region, 2018 to 2033

Figure 6: Global Market Volume (Units) Analysis by Region, 2018 to 2033

Figure 7: Global Market Value Share (%) and BPS Analysis by Region, 2023 to 2033

Figure 8: Global Market Y-o-Y Growth (%) Projections by Region, 2023 to 2033

Figure 9: Global Market Value (US$ Million) Analysis by Pulp Type, 2018 to 2033

Figure 10: Global Market Volume (Units) Analysis by Pulp Type, 2018 to 2033

Figure 11: Global Market Value Share (%) and BPS Analysis by Pulp Type, 2023 to 2033

Figure 12: Global Market Y-o-Y Growth (%) Projections by Pulp Type, 2023 to 2033

Figure 13: Global Market Value (US$ Million) Analysis by Packaging Type, 2018 to 2033

Figure 14: Global Market Volume (Units) Analysis by Packaging Type, 2018 to 2033

Figure 15: Global Market Value Share (%) and BPS Analysis by Packaging Type, 2023 to 2033

Figure 16: Global Market Y-o-Y Growth (%) Projections by Packaging Type, 2023 to 2033

Figure 17: Global Market Value (US$ Million) Analysis by End-use Industry, 2018 to 2033

Figure 18: Global Market Volume (Units) Analysis by End-use Industry, 2018 to 2033

Figure 19: Global Market Value Share (%) and BPS Analysis by End-use Industry, 2023 to 2033

Figure 20: Global Market Y-o-Y Growth (%) Projections by End-use Industry, 2023 to 2033

Figure 21: Global Market Attractiveness by Pulp Type, 2023 to 2033

Figure 22: Global Market Attractiveness by Packaging Type, 2023 to 2033

Figure 23: Global Market Attractiveness by End-use Industry, 2023 to 2033

Figure 24: Global Market Attractiveness by Region, 2023 to 2033

Figure 25: North America Market Value (US$ Million) by Pulp Type, 2023 to 2033

Figure 26: North America Market Value (US$ Million) by Packaging Type, 2023 to 2033

Figure 27: North America Market Value (US$ Million) by End-use Industry, 2023 to 2033

Figure 28: North America Market Value (US$ Million) by Country, 2023 to 2033

Figure 29: North America Market Value (US$ Million) Analysis by Country, 2018 to 2033

Figure 30: North America Market Volume (Units) Analysis by Country, 2018 to 2033

Figure 31: North America Market Value Share (%) and BPS Analysis by Country, 2023 to 2033

Figure 32: North America Market Y-o-Y Growth (%) Projections by Country, 2023 to 2033

Figure 33: North America Market Value (US$ Million) Analysis by Pulp Type, 2018 to 2033

Figure 34: North America Market Volume (Units) Analysis by Pulp Type, 2018 to 2033

Figure 35: North America Market Value Share (%) and BPS Analysis by Pulp Type, 2023 to 2033

Figure 36: North America Market Y-o-Y Growth (%) Projections by Pulp Type, 2023 to 2033

Figure 37: North America Market Value (US$ Million) Analysis by Packaging Type, 2018 to 2033

Figure 38: North America Market Volume (Units) Analysis by Packaging Type, 2018 to 2033

Figure 39: North America Market Value Share (%) and BPS Analysis by Packaging Type, 2023 to 2033

Figure 40: North America Market Y-o-Y Growth (%) Projections by Packaging Type, 2023 to 2033

Figure 41: North America Market Value (US$ Million) Analysis by End-use Industry, 2018 to 2033

Figure 42: North America Market Volume (Units) Analysis by End-use Industry, 2018 to 2033

Figure 43: North America Market Value Share (%) and BPS Analysis by End-use Industry, 2023 to 2033

Figure 44: North America Market Y-o-Y Growth (%) Projections by End-use Industry, 2023 to 2033

Figure 45: North America Market Attractiveness by Pulp Type, 2023 to 2033

Figure 46: North America Market Attractiveness by Packaging Type, 2023 to 2033

Figure 47: North America Market Attractiveness by End-use Industry, 2023 to 2033

Figure 48: North America Market Attractiveness by Country, 2023 to 2033

Figure 49: Latin America Market Value (US$ Million) by Pulp Type, 2023 to 2033

Figure 50: Latin America Market Value (US$ Million) by Packaging Type, 2023 to 2033

Figure 51: Latin America Market Value (US$ Million) by End-use Industry, 2023 to 2033

Figure 52: Latin America Market Value (US$ Million) by Country, 2023 to 2033

Figure 53: Latin America Market Value (US$ Million) Analysis by Country, 2018 to 2033

Figure 54: Latin America Market Volume (Units) Analysis by Country, 2018 to 2033

Figure 55: Latin America Market Value Share (%) and BPS Analysis by Country, 2023 to 2033

Figure 56: Latin America Market Y-o-Y Growth (%) Projections by Country, 2023 to 2033

Figure 57: Latin America Market Value (US$ Million) Analysis by Pulp Type, 2018 to 2033

Figure 58: Latin America Market Volume (Units) Analysis by Pulp Type, 2018 to 2033

Figure 59: Latin America Market Value Share (%) and BPS Analysis by Pulp Type, 2023 to 2033

Figure 60: Latin America Market Y-o-Y Growth (%) Projections by Pulp Type, 2023 to 2033

Figure 61: Latin America Market Value (US$ Million) Analysis by Packaging Type, 2018 to 2033

Figure 62: Latin America Market Volume (Units) Analysis by Packaging Type, 2018 to 2033

Figure 63: Latin America Market Value Share (%) and BPS Analysis by Packaging Type, 2023 to 2033

Figure 64: Latin America Market Y-o-Y Growth (%) Projections by Packaging Type, 2023 to 2033

Figure 65: Latin America Market Value (US$ Million) Analysis by End-use Industry, 2018 to 2033

Figure 66: Latin America Market Volume (Units) Analysis by End-use Industry, 2018 to 2033

Figure 67: Latin America Market Value Share (%) and BPS Analysis by End-use Industry, 2023 to 2033

Figure 68: Latin America Market Y-o-Y Growth (%) Projections by End-use Industry, 2023 to 2033

Figure 69: Latin America Market Attractiveness by Pulp Type, 2023 to 2033

Figure 70: Latin America Market Attractiveness by Packaging Type, 2023 to 2033

Figure 71: Latin America Market Attractiveness by End-use Industry, 2023 to 2033

Figure 72: Latin America Market Attractiveness by Country, 2023 to 2033

Figure 73: Western Europe Market Value (US$ Million) by Pulp Type, 2023 to 2033

Figure 74: Western Europe Market Value (US$ Million) by Packaging Type, 2023 to 2033

Figure 75: Western Europe Market Value (US$ Million) by End-use Industry, 2023 to 2033

Figure 76: Western Europe Market Value (US$ Million) by Country, 2023 to 2033

Figure 77: Western Europe Market Value (US$ Million) Analysis by Country, 2018 to 2033

Figure 78: Western Europe Market Volume (Units) Analysis by Country, 2018 to 2033

Figure 79: Western Europe Market Value Share (%) and BPS Analysis by Country, 2023 to 2033

Figure 80: Western Europe Market Y-o-Y Growth (%) Projections by Country, 2023 to 2033

Figure 81: Western Europe Market Value (US$ Million) Analysis by Pulp Type, 2018 to 2033

Figure 82: Western Europe Market Volume (Units) Analysis by Pulp Type, 2018 to 2033

Figure 83: Western Europe Market Value Share (%) and BPS Analysis by Pulp Type, 2023 to 2033

Figure 84: Western Europe Market Y-o-Y Growth (%) Projections by Pulp Type, 2023 to 2033

Figure 85: Western Europe Market Value (US$ Million) Analysis by Packaging Type, 2018 to 2033

Figure 86: Western Europe Market Volume (Units) Analysis by Packaging Type, 2018 to 2033

Figure 87: Western Europe Market Value Share (%) and BPS Analysis by Packaging Type, 2023 to 2033

Figure 88: Western Europe Market Y-o-Y Growth (%) Projections by Packaging Type, 2023 to 2033

Figure 89: Western Europe Market Value (US$ Million) Analysis by End-use Industry, 2018 to 2033

Figure 90: Western Europe Market Volume (Units) Analysis by End-use Industry, 2018 to 2033

Figure 91: Western Europe Market Value Share (%) and BPS Analysis by End-use Industry, 2023 to 2033

Figure 92: Western Europe Market Y-o-Y Growth (%) Projections by End-use Industry, 2023 to 2033

Figure 93: Western Europe Market Attractiveness by Pulp Type, 2023 to 2033

Figure 94: Western Europe Market Attractiveness by Packaging Type, 2023 to 2033

Figure 95: Western Europe Market Attractiveness by End-use Industry, 2023 to 2033

Figure 96: Western Europe Market Attractiveness by Country, 2023 to 2033

Figure 97: Eastern Europe Market Value (US$ Million) by Pulp Type, 2023 to 2033

Figure 98: Eastern Europe Market Value (US$ Million) by Packaging Type, 2023 to 2033

Figure 99: Eastern Europe Market Value (US$ Million) by End-use Industry, 2023 to 2033

Figure 100: Eastern Europe Market Value (US$ Million) by Country, 2023 to 2033

Figure 101: Eastern Europe Market Value (US$ Million) Analysis by Country, 2018 to 2033

Figure 102: Eastern Europe Market Volume (Units) Analysis by Country, 2018 to 2033

Figure 103: Eastern Europe Market Value Share (%) and BPS Analysis by Country, 2023 to 2033

Figure 104: Eastern Europe Market Y-o-Y Growth (%) Projections by Country, 2023 to 2033

Figure 105: Eastern Europe Market Value (US$ Million) Analysis by Pulp Type, 2018 to 2033

Figure 106: Eastern Europe Market Volume (Units) Analysis by Pulp Type, 2018 to 2033

Figure 107: Eastern Europe Market Value Share (%) and BPS Analysis by Pulp Type, 2023 to 2033

Figure 108: Eastern Europe Market Y-o-Y Growth (%) Projections by Pulp Type, 2023 to 2033

Figure 109: Eastern Europe Market Value (US$ Million) Analysis by Packaging Type, 2018 to 2033

Figure 110: Eastern Europe Market Volume (Units) Analysis by Packaging Type, 2018 to 2033

Figure 111: Eastern Europe Market Value Share (%) and BPS Analysis by Packaging Type, 2023 to 2033

Figure 112: Eastern Europe Market Y-o-Y Growth (%) Projections by Packaging Type, 2023 to 2033

Figure 113: Eastern Europe Market Value (US$ Million) Analysis by End-use Industry, 2018 to 2033

Figure 114: Eastern Europe Market Volume (Units) Analysis by End-use Industry, 2018 to 2033

Figure 115: Eastern Europe Market Value Share (%) and BPS Analysis by End-use Industry, 2023 to 2033

Figure 116: Eastern Europe Market Y-o-Y Growth (%) Projections by End-use Industry, 2023 to 2033

Figure 117: Eastern Europe Market Attractiveness by Pulp Type, 2023 to 2033

Figure 118: Eastern Europe Market Attractiveness by Packaging Type, 2023 to 2033

Figure 119: Eastern Europe Market Attractiveness by End-use Industry, 2023 to 2033

Figure 120: Eastern Europe Market Attractiveness by Country, 2023 to 2033

Figure 121: South Asia and Pacific Market Value (US$ Million) by Pulp Type, 2023 to 2033

Figure 122: South Asia and Pacific Market Value (US$ Million) by Packaging Type, 2023 to 2033

Figure 123: South Asia and Pacific Market Value (US$ Million) by End-use Industry, 2023 to 2033

Figure 124: South Asia and Pacific Market Value (US$ Million) by Country, 2023 to 2033

Figure 125: South Asia and Pacific Market Value (US$ Million) Analysis by Country, 2018 to 2033

Figure 126: South Asia and Pacific Market Volume (Units) Analysis by Country, 2018 to 2033

Figure 127: South Asia and Pacific Market Value Share (%) and BPS Analysis by Country, 2023 to 2033

Figure 128: South Asia and Pacific Market Y-o-Y Growth (%) Projections by Country, 2023 to 2033

Figure 129: South Asia and Pacific Market Value (US$ Million) Analysis by Pulp Type, 2018 to 2033

Figure 130: South Asia and Pacific Market Volume (Units) Analysis by Pulp Type, 2018 to 2033

Figure 131: South Asia and Pacific Market Value Share (%) and BPS Analysis by Pulp Type, 2023 to 2033

Figure 132: South Asia and Pacific Market Y-o-Y Growth (%) Projections by Pulp Type, 2023 to 2033

Figure 133: South Asia and Pacific Market Value (US$ Million) Analysis by Packaging Type, 2018 to 2033

Figure 134: South Asia and Pacific Market Volume (Units) Analysis by Packaging Type, 2018 to 2033

Figure 135: South Asia and Pacific Market Value Share (%) and BPS Analysis by Packaging Type, 2023 to 2033

Figure 136: South Asia and Pacific Market Y-o-Y Growth (%) Projections by Packaging Type, 2023 to 2033

Figure 137: South Asia and Pacific Market Value (US$ Million) Analysis by End-use Industry, 2018 to 2033

Figure 138: South Asia and Pacific Market Volume (Units) Analysis by End-use Industry, 2018 to 2033

Figure 139: South Asia and Pacific Market Value Share (%) and BPS Analysis by End-use Industry, 2023 to 2033

Figure 140: South Asia and Pacific Market Y-o-Y Growth (%) Projections by End-use Industry, 2023 to 2033

Figure 141: South Asia and Pacific Market Attractiveness by Pulp Type, 2023 to 2033

Figure 142: South Asia and Pacific Market Attractiveness by Packaging Type, 2023 to 2033

Figure 143: South Asia and Pacific Market Attractiveness by End-use Industry, 2023 to 2033

Figure 144: South Asia and Pacific Market Attractiveness by Country, 2023 to 2033

Figure 145: East Asia Market Value (US$ Million) by Pulp Type, 2023 to 2033

Figure 146: East Asia Market Value (US$ Million) by Packaging Type, 2023 to 2033

Figure 147: East Asia Market Value (US$ Million) by End-use Industry, 2023 to 2033

Figure 148: East Asia Market Value (US$ Million) by Country, 2023 to 2033

Figure 149: East Asia Market Value (US$ Million) Analysis by Country, 2018 to 2033

Figure 150: East Asia Market Volume (Units) Analysis by Country, 2018 to 2033

Figure 151: East Asia Market Value Share (%) and BPS Analysis by Country, 2023 to 2033

Figure 152: East Asia Market Y-o-Y Growth (%) Projections by Country, 2023 to 2033

Figure 153: East Asia Market Value (US$ Million) Analysis by Pulp Type, 2018 to 2033

Figure 154: East Asia Market Volume (Units) Analysis by Pulp Type, 2018 to 2033

Figure 155: East Asia Market Value Share (%) and BPS Analysis by Pulp Type, 2023 to 2033

Figure 156: East Asia Market Y-o-Y Growth (%) Projections by Pulp Type, 2023 to 2033

Figure 157: East Asia Market Value (US$ Million) Analysis by Packaging Type, 2018 to 2033

Figure 158: East Asia Market Volume (Units) Analysis by Packaging Type, 2018 to 2033

Figure 159: East Asia Market Value Share (%) and BPS Analysis by Packaging Type, 2023 to 2033

Figure 160: East Asia Market Y-o-Y Growth (%) Projections by Packaging Type, 2023 to 2033

Figure 161: East Asia Market Value (US$ Million) Analysis by End-use Industry, 2018 to 2033

Figure 162: East Asia Market Volume (Units) Analysis by End-use Industry, 2018 to 2033

Figure 163: East Asia Market Value Share (%) and BPS Analysis by End-use Industry, 2023 to 2033

Figure 164: East Asia Market Y-o-Y Growth (%) Projections by End-use Industry, 2023 to 2033

Figure 165: East Asia Market Attractiveness by Pulp Type, 2023 to 2033

Figure 166: East Asia Market Attractiveness by Packaging Type, 2023 to 2033

Figure 167: East Asia Market Attractiveness by End-use Industry, 2023 to 2033

Figure 168: East Asia Market Attractiveness by Country, 2023 to 2033

Figure 169: Middle East and Africa Market Value (US$ Million) by Pulp Type, 2023 to 2033

Figure 170: Middle East and Africa Market Value (US$ Million) by Packaging Type, 2023 to 2033

Figure 171: Middle East and Africa Market Value (US$ Million) by End-use Industry, 2023 to 2033

Figure 172: Middle East and Africa Market Value (US$ Million) by Country, 2023 to 2033

Figure 173: Middle East and Africa Market Value (US$ Million) Analysis by Country, 2018 to 2033

Figure 174: Middle East and Africa Market Volume (Units) Analysis by Country, 2018 to 2033

Figure 175: Middle East and Africa Market Value Share (%) and BPS Analysis by Country, 2023 to 2033

Figure 176: Middle East and Africa Market Y-o-Y Growth (%) Projections by Country, 2023 to 2033

Figure 177: Middle East and Africa Market Value (US$ Million) Analysis by Pulp Type, 2018 to 2033

Figure 178: Middle East and Africa Market Volume (Units) Analysis by Pulp Type, 2018 to 2033

Figure 179: Middle East and Africa Market Value Share (%) and BPS Analysis by Pulp Type, 2023 to 2033

Figure 180: Middle East and Africa Market Y-o-Y Growth (%) Projections by Pulp Type, 2023 to 2033

Figure 181: Middle East and Africa Market Value (US$ Million) Analysis by Packaging Type, 2018 to 2033

Figure 182: Middle East and Africa Market Volume (Units) Analysis by Packaging Type, 2018 to 2033

Figure 183: Middle East and Africa Market Value Share (%) and BPS Analysis by Packaging Type, 2023 to 2033

Figure 184: Middle East and Africa Market Y-o-Y Growth (%) Projections by Packaging Type, 2023 to 2033

Figure 185: Middle East and Africa Market Value (US$ Million) Analysis by End-use Industry, 2018 to 2033

Figure 186: Middle East and Africa Market Volume (Units) Analysis by End-use Industry, 2018 to 2033

Figure 187: Middle East and Africa Market Value Share (%) and BPS Analysis by End-use Industry, 2023 to 2033

Figure 188: Middle East and Africa Market Y-o-Y Growth (%) Projections by End-use Industry, 2023 to 2033

Figure 189: Middle East and Africa Market Attractiveness by Pulp Type, 2023 to 2033

Figure 190: Middle East and Africa Market Attractiveness by Packaging Type, 2023 to 2033

Figure 191: Middle East and Africa Market Attractiveness by End-use Industry, 2023 to 2033

Figure 192: Middle East and Africa Market Attractiveness by Country, 2023 to 2033

Recommendations

Packaging

Flexible Packaging Paper Market

Published : March 2024

Packaging

Biodegradable Packaging Market

Published : September 2022

Explore Packaging Insights

View Reports