The global bamboo straw market is valued at USD 2,134 million in 2025 and is set to reach USD 4,287 million by 2035, growing at a CAGR of 7.2%. The market stands at the forefront of a transformative decade that promises to redefine eco-friendly drinking solutions and biodegradable utensil excellence across restaurants, cafes, households, and food service sectors. The market's journey from USD 2,134 million in 2025 to USD 4,287 million by 2035 represents substantial growth, demonstrating the accelerating adoption of natural drinking alternatives and sophisticated bamboo processing systems across hospitality venues, health-conscious consumers, zero-waste initiatives, and premium beverage applications.
The first half of the decade (2025 to 2030) will witness the market climbing from USD 2,134 million to approximately USD 2,891 million, adding USD 757 million in value, which constitutes 35% of the total forecast growth period. This phase will be characterized by the rapid adoption of plastic-free culture, driven by increasing demand for biodegradable alternatives and enhanced durability requirements worldwide. Superior antibacterial properties and reusable characteristics will become standard expectations rather than premium options.
The latter half (2030 to 2035) will witness sustained growth from USD 2,891 million to USD 4,287 million, representing an addition of USD 1,396 million or 65% of the decade's expansion. This period will be defined by mass market penetration of premium bamboo straw systems, integration with comprehensive food service platforms, and seamless compatibility with existing beverage operations. The market trajectory signals fundamental shifts in how restaurants and consumers approach eco-friendly drinking solutions, with participants positioned to benefit from sustained demand across multiple food service segments.
Technological innovations in bamboo straw production are also playing a key role in market growth. Manufacturers are improving the production processes of bamboo straws to enhance their durability, texture, and usability, making them more appealing to consumers. Innovations such as the development of various sizes, packaging options, and the ability to produce customized bamboo straws are catering to diverse consumer needs across different industries. Additionally, the integration of eco-friendly manufacturing techniques, such as non-toxic finishes and coatings, is helping to ensure that bamboo straws maintain their sustainability credentials throughout their lifecycle.
Regulatory pressures and consumer awareness are also playing a role in the bamboo straw market's expansion. Governments around the world are introducing stricter regulations on plastic usage, which is directly benefiting the bamboo straw market. Many countries have implemented or are planning to implement bans on single-use plastic straws, providing an opportunity for alternative products like bamboo straws to fill the gap. Furthermore, as consumer awareness about plastic pollution continues to rise, demand for sustainable alternatives like bamboo straws is expected to increase across various regions.
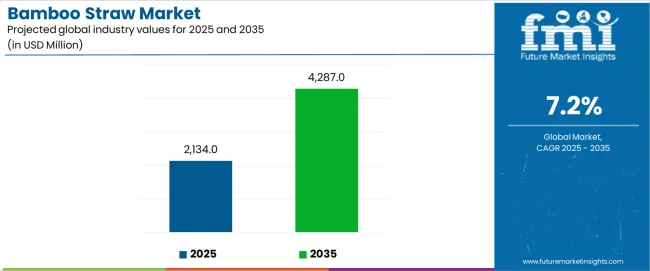
The bamboo straw market demonstrates distinct growth phases with varying market characteristics and competitive dynamics. Between 2025 and 2030, the market progresses through its eco-conscious adoption phase, expanding from USD 2,134 million to USD 2,891 million with steady annual increments averaging 6.8% growth. This period showcases the transition from disposable plastic straws to natural bamboo alternatives with enhanced durability and integrated antibacterial properties becoming mainstream features.
The 2025 to 2030 phase adds USD 757 million to market value, representing 35% of total decade expansion. Market maturation factors include standardization of length specifications, declining manufacturing costs for premium bamboo processing, and increasing restaurant awareness of bamboo straw benefits reaching 70-75% effectiveness in beverage service applications. Competitive landscape evolution during this period features established manufacturers like Jungle Straws and Simply Straws expanding their product portfolios while new entrants focus on specialized organic processing and enhanced durability technology.
From 2030 to 2035, market dynamics shift toward advanced customization and multi-venue deployment, with growth accelerating from USD 2,891 million to USD 4,287 million, adding USD 1,396 million or 65% of total expansion. This phase transition logic centers on universal bamboo straw systems, integration with automated cleaning equipment, and deployment across diverse food service scenarios, becoming standard rather than specialized utensils. The competitive environment matures with focus shifting from basic functionality to comprehensive durability performance and compatibility with high-volume food service operations.
At-a-Glance Metrics
| Metric | Value |
|---|---|
| Market Value (2025) | USD 2,134 million |
| Market Forecast (2035) | USD 4,287 million |
| Growth Rate | 7.20% CAGR |
| Leading Type | Reusable |
| Primary Application | Restaurants & Cafes |
The market demonstrates strong fundamentals with reusable bamboo straws capturing a dominant share through superior durability and cost-effectiveness over multiple uses. Restaurant and cafe applications drive primary demand, supported by increasing environmental consciousness requirements and plastic-free dining solutions. Geographic expansion remains concentrated in developed markets with established eco-friendly infrastructure, while emerging economies show accelerating adoption rates driven by environmental awareness projects and rising premium food service activity.
The bamboo straw market represents a compelling intersection of environmental innovation, food safety, and biodegradable utensil management. With robust growth projected from USD 2,134 million in 2025 to USD 4,287 million by 2035 at a 7.20% CAGR, this market is driven by increasing plastic ban legislation trends, eco-conscious consumer requirements, and commercial demand for high-quality drinking alternatives.
The market's expansion reflects a fundamental shift in how food service operators and consumers approach drinking utensil infrastructure. Strong growth opportunities exist across diverse applications, from restaurants requiring plastic-free alternatives to households demanding eco-friendly solutions. Geographic expansion is particularly pronounced in Asia-Pacific markets, led by India (8.5% CAGR) and China (8.2% CAGR), while established markets in North America and Europe drive innovation and specialized segment development.
The dominance of reusable types and restaurant applications underscores the importance of proven durability technology and cost-effectiveness in driving adoption. Manufacturing complexity and quality consistency remain key challenges, creating opportunities for companies that can deliver reliable performance while maintaining competitive pricing.
Market expansion rests on three fundamental shifts driving adoption across food service and consumer sectors. Environmental awareness creates compelling advantages through bamboo straw systems that provide comprehensive plastic reduction with enhanced biodegradability, enabling restaurants to meet eco-friendly standards and maintain service quality while justifying premium positioning over traditional plastic alternatives. Consumer preference evolution accelerates as environmentally conscious individuals worldwide seek plastic-free drinking access that delivers natural material benefits directly to daily consumption environments, enabling health differentiation that aligns with organic lifestyle expectations and maximizes environmental impact reduction. Food service operations optimization drives adoption from restaurants requiring efficient plastic-free solutions that maximize customer satisfaction while maintaining durability standards during service and cleaning operations.
However, growth faces headwinds from manufacturing complexity variations that differ across bamboo processing facilities regarding quality control and production speeds, potentially limiting performance reliability in high-volume service categories. Cleaning requirements also persist regarding sanitization protocols and maintenance procedures that may increase operational complexity in markets with demanding hygiene standards.
Primary Classification: The market segments by type into reusable, disposable, and treated categories, representing the evolution from basic straws to premium processed formats for comprehensive food service operations.
Secondary Breakdown: Application segmentation divides the market into restaurants & cafes, hotels & resorts, households, bars & pubs, and others sectors, reflecting distinct requirements for durability, size variety, and antibacterial performance.
Regional Classification: Geographic distribution covers Asia Pacific, North America, Europe, Latin America, and the Middle East & Africa, with developing markets leading adoption while established economies show accelerating growth patterns driven by environmental legislation programs.
The segmentation structure reveals technology progression from standard bamboo straws toward integrated processing platforms with enhanced antibacterial treatment and durability capabilities, while application diversity spans from restaurant operations to household consumption requiring comprehensive eco-friendly solutions and reusable serving systems.
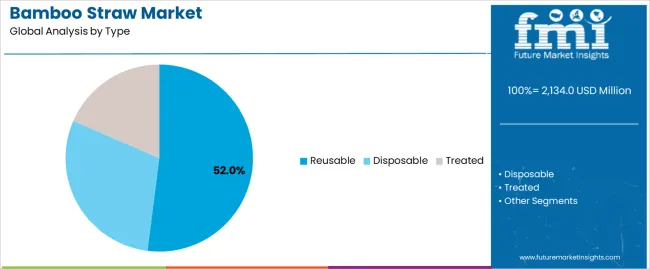
Reusable segment is estimated to account for 52% of the bamboo straw market share in 2025. The segment's leading position stems from its fundamental role as a critical component in cost-effective applications and its extensive use across multiple restaurant and household sectors. Reusable bamboo straws' dominance is attributed to their superior durability, including natural antibacterial properties, excellent longevity, and balanced economic benefits that make them indispensable for premium eco-friendly operations.
Market Position: Reusable systems command the leading position in the bamboo straw market through advanced processing technologies, including comprehensive diameter control, uniform cutting precision, and reliable cleaning compatibility that enable food service operators to deploy straws across diverse beverage applications.
Value Drivers: The segment benefits from consumer preference for multi-use eco-friendly products that provide exceptional cost savings without requiring frequent replacement. Efficient cleaning capabilities enable deployment in restaurant operations, hotel services, and household applications where environmental responsibility and economic efficiency represent critical selection requirements.
Competitive Advantages: Reusable systems differentiate through excellent durability characteristics, proven longevity performance, and compatibility with standard cleaning equipment that enhance service quality while maintaining economical straw profiles suitable for diverse food service applications.
Key market characteristics:
Restaurants & cafes segment is projected to hold 41% of the bamboo straw market share in 2025. The segment's market leadership is driven by the extensive use of bamboo straws in beverage service, table settings, takeaway orders, and eco-friendly branding, where straws serve as both functional utensils and environmental statement tools. The food service industry's consistent investment in environmental compliance supports the segment's dominant position.
Market Context: Restaurant and cafe applications dominate the market due to widespread adoption of plastic-free dining and increasing focus on environmental customer experiences, cost reduction, and eco-friendly positioning that extend brand value while maintaining service standards.
Appeal Factors: Food service operators prioritize durability, easy cleaning procedures, and integration with existing beverage service that enable coordinated deployment across multiple dining points. The segment benefits from substantial environmental legislation growth and customer standards that emphasize natural material access for dining experiences.
Growth Drivers: Restaurant expansion programs incorporate bamboo straws as standard eco-friendly tools for beverage service, while cafe initiatives increase demand for branded natural alternatives that comply with local environmental regulations and enhance customer loyalty programs.
Market Challenges: Size standardization requirements and cleaning protocol variations may limit deployment flexibility in ultra-high-volume operations or extreme cost-sensitive scenarios.
Application dynamics include:
Growth Accelerators: Environmental legislation drives primary adoption as bamboo straw systems provide exceptional plastic reduction that enables compliance without compromising service quality, supporting restaurant cost efficiency and customer satisfaction that require biodegradable drinking alternatives. Consumer awareness innovation accelerates market growth as individuals seek authentic eco-friendly experiences that maintain natural material characteristics during use while enhancing environmental responsibility through refined straw design. Health-conscious culture increases worldwide, creating sustained demand for natural drinking systems that complement organic lifestyle and provide competitive advantages in material safety differentiation.
Growth Inhibitors: Manufacturing complexity challenges differ across bamboo processing facilities regarding quality control capability and production efficiency, which may limit market penetration and consistency in high-volume categories with demanding service requirements. Cleaning protocol requirements persist regarding sanitization standards and maintenance procedures that may increase operational costs in hygiene-sensitive applications with strict food safety specifications. Market fragmentation across multiple length sizes and diameter types creates compatibility concerns between different beverage types and existing food service infrastructure.
Market Evolution Patterns: Adoption accelerates in restaurant and household sectors where plastic-free access justifies straw investments, with geographic concentration in developing markets transitioning toward mainstream adoption in established economies driven by environmental culture development and eco-friendly beverage expansion. Technology development focuses on enhanced antibacterial treatment, improved durability mechanisms, and integration with automated cleaning systems that optimize service quality and operational efficiency. The market could face disruption if alternative biodegradable technologies or straw innovations significantly challenge bamboo advantages in food service applications.
The bamboo straw market demonstrates varied regional dynamics with Growth Leaders including India (8.5% CAGR) and China (8.2% CAGR) driving expansion through environmental awareness development and eco-friendly culture adoption. Steady Performers encompass the USA (7.8% CAGR), Germany (6.9% CAGR), and Japan (6.4% CAGR), benefiting from established environmental sectors and premium eco-friendly adoption.
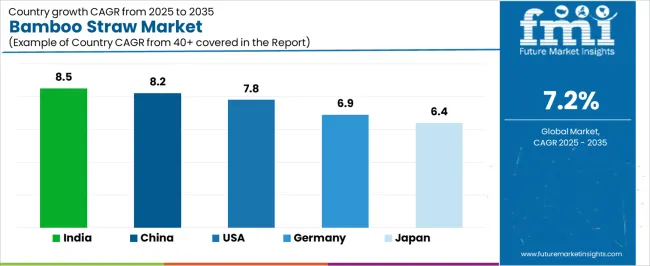
| Country | CAGR (2025-2035) |
|---|---|
| India | 8.5% |
| China | 8.2% |
| USA | 7.8% |
| Germany | 6.9% |
| Japan | 6.4% |
Regional synthesis reveals Asia-Pacific markets leading growth through environmental consciousness expansion and eco-friendly product development, while European countries maintain steady expansion supported by traditional environmental heritage and premium natural product requirements. North American markets show strong growth driven by restaurant industry transformation and household eco-friendly applications.
India establishes regional leadership through explosive eco-friendly expansion and comprehensive environmental culture modernization, integrating advanced bamboo straw systems as standard components in restaurant operations and premium food service applications. The country's 8.5% CAGR through 2035 reflects consumer preference evolution promoting plastic-free consumption and domestic environmental activity that mandate the use of biodegradable alternatives in food service operations. Growth concentrates in major urban centers, including Mumbai, Delhi, and Bangalore, where restaurants showcase integrated bamboo straw systems that appeal to environmentally conscious consumers seeking authentic eco-friendly experiences and international environmental standards.
Indian food service operators are developing innovative bamboo straw solutions that combine local bamboo advantages with international durability specifications, including enhanced antibacterial treatment and advanced processing capabilities.
Strategic Market Indicators:
The Chinese market emphasizes food service applications, including rapid eco-friendly development and comprehensive product modernization that increasingly incorporates bamboo straws for restaurant service and household consumption applications. The country is projected to show an 8.2% CAGR through 2035, driven by massive environmental activity under plastic reduction initiatives and commercial demand for affordable, high-quality biodegradable systems. Chinese manufacturers prioritize cost-effectiveness with bamboo straws delivering eco-friendly access through economical processing usage and efficient production capabilities.
Technology deployment channels include major food service companies, restaurant chains, and eco-friendly retailers that support high-volume usage for domestic and hospitality applications.
Performance Metrics:
The USA market emphasizes advanced bamboo straw features, including innovative processing technologies and integration with comprehensive food service platforms that manage beverage service, customer experience, and environmental compliance applications through unified straw systems. The country is projected to show a 7.8% CAGR through 2035, driven by restaurant expansion under eco-friendly trends and commercial demand for premium, reliable biodegradable systems. American food service operators prioritize customer satisfaction with bamboo straws delivering comprehensive eco-friendly benefits through refined processing and durability control.
Technology deployment channels include major restaurant chains, food service suppliers, and specialty eco-friendly manufacturers that support custom development for premium operations.
Performance Metrics:
In Berlin, Munich, and Hamburg, German restaurants and food service manufacturers are implementing advanced bamboo straw systems to enhance service capabilities and support environmental culture preservation that aligns with ecological protocols and quality standards. The German market demonstrates sustained growth with a 6.9% CAGR through 2035, driven by traditional environmental innovation programs and eco-friendly investments that emphasize premium natural systems for beverage service and specialty applications. German food service facilities are prioritizing bamboo straw systems that provide exceptional durability while maintaining compliance with food safety standards and minimizing environmental impact, particularly important in organic restaurants and specialty dining facilities.
Market expansion benefits from environmental heritage programs that mandate enhanced biodegradability in utensil specifications, creating sustained demand across Germany's food service and hospitality sectors, where environmental integrity and product reliability represent critical requirements.
Strategic Market Indicators:
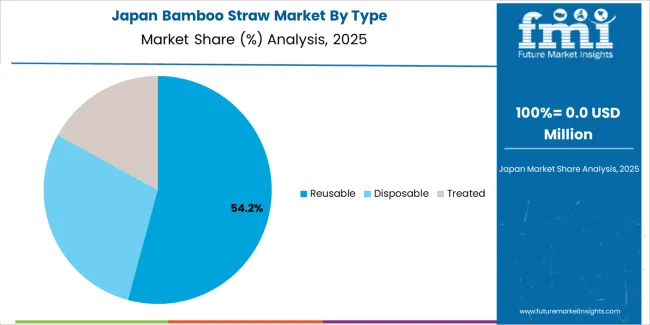
Japan's sophisticated food service market demonstrates meticulous bamboo straw deployment, growing at 6.4% CAGR, with documented operational excellence in eco-friendly service and restaurant applications through integration with existing beverage systems and quality assurance infrastructure. The country leverages manufacturing expertise in bamboo processing and cutting precision to maintain market leadership. Food service centers, including Tokyo, Osaka, and Kyoto, showcase advanced installations where bamboo straw systems integrate with comprehensive service platforms and environmental systems to optimize customer satisfaction and environmental compliance.
Japanese restaurants prioritize processing precision and product consistency in straw development, creating demand for premium bamboo systems with advanced features, including ultra-reliable durability and integration with automated cleaning protocols. The market benefits from established food service infrastructure and willingness to invest in specialized eco-friendly technologies that provide superior performance and regulatory compliance.
Market Intelligence Brief:
The bamboo straw market in Europe is projected to grow from USD 641 million in 2025 to USD 1,028 million by 2035, registering a CAGR of 4.8% over the forecast period. Germany is expected to maintain its leadership position with a 32.4% market share in 2025, declining slightly to 31.9% by 2035, supported by its environmental excellence and major eco-friendly centers, including Bavaria and North Rhine-Westphalia.
United Kingdom follows with a 26.1% share in 2025, projected to reach 26.7% by 2035, driven by comprehensive environmental legislation and food service industry adoption. France holds a 18.3% share in 2025, expected to maintain 18.6% by 2035 through established organic food sectors and premium eco-friendly adoption.
Italy commands a 11.7% share, while Netherlands accounts for 6.2% in 2025. The Rest of Europe region is anticipated to gain momentum, expanding its collective share from 5.3% to 5.8% by 2035, attributed to increasing environmental development in Eastern European countries and emerging Nordic eco-friendly brands implementing premium natural product programs.
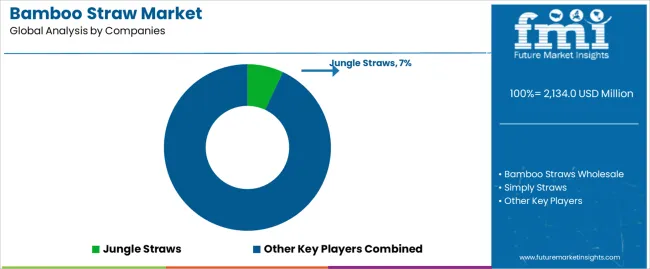
The Bamboo Straw Market features approximately 12–18 players with moderate concentration, where the top three companies collectively hold around 34–40% of global market share through strong branding, sustainable material sourcing, and established partnerships with foodservice chains, eco-centric retailers, and hospitality operators. The leading company, Jungle Straws, holds roughly 7% market share supported by its ethically sourced bamboo program, global distribution network, and strong presence in environmentally focused retail channels. Competition centers on sustainability certification, product durability, customization options, and brand credibility rather than simple cost competition.
Market leaders such as Jungle Straws, Bamboo Straws Wholesale, and Simply Straws maintain their competitive edge through stringent quality standards, certified organic sourcing, and the ability to offer reusable, biodegradable bamboo straws with consistent finishing and durability. Their strengths lie in strong brand positioning, compliance with food-contact safety regulations, and effective retail partnerships that cater to cafes, restaurants, and consumers seeking plastic-free alternatives. These companies also differentiate by offering branded, engraved, and customized straws for corporate and hospitality clients.
Challenger companies including Buluh Straws, Aardvark Straws, and Eco-Products compete by focusing on specialty product lines, innovative packaging formats, and strong sustainability messaging. These firms target environmentally conscious buyers through compostability certifications, toxin-free processing, and partnerships with regional distributors serving foodservice and event-management sectors. Their flexibility in order size, custom packaging, and private-label production enhances their competitiveness.
Additional pressure arises from regional and niche players such as StrawZ, Bamboo India, Green Paper Products, and World Centric, which capitalize on growing demand in Asia-Pacific, North America, and Europe. Their advantages include localized manufacturing, competitive pricing, and the ability to offer bamboo straws integrated with broader eco-friendly product portfolios. These companies strengthen their market presence by offering fast delivery times, tailored sustainability solutions, and products aligned with zero-waste lifestyles.
| Item | Value |
|---|---|
| Quantitative Units | USD 2,134 million |
| Type | Reusable, Disposable, Treated |
| Application | Restaurants & Cafes, Hotels & Resorts, Households, Bars & Pubs, Others |
| Regions Covered | Asia Pacific, North America, Europe, Latin America, Middle East & Africa |
| Countries Covered | India, China, U.S., Germany, Japan, and 25+ additional countries |
| Key Companies Profiled | Jungle Straws, Bamboo Straws Wholesale, Simply Straws, Buluh Straws, Aardvark Straws, Eco-Products, StrawZ, Bamboo India, Green Paper Products, World Centric |
| Additional Attributes | Dollar sales by type and application categories, regional adoption trends across Asia Pacific, North America, and Europe, competitive landscape with bamboo processors and food service suppliers, restaurant preferences for durability and cleaning compatibility, integration with beverage service equipment and sanitization systems, innovations in antibacterial treatment technology and processing control, and development of specialized eco-friendly solutions with enhanced durability capabilities and user-friendly features |
The global bamboo straw market is estimated to be valued at USD 2,134.0 million in 2025.
The market size for the bamboo straw market is projected to reach USD 4,287.0 million by 2035.
The bamboo straw market is expected to grow at a 7.2% CAGR between 2025 and 2035.
The key product types in bamboo straw market are reusable, disposable and treated.
In terms of application, restaurants & cafes segment to command 41.0% share in the bamboo straw market in 2025.


Our Research Products

The "Full Research Suite" delivers actionable market intel, deep dives on markets or technologies, so clients act faster, cut risk, and unlock growth.

The Leaderboard benchmarks and ranks top vendors, classifying them as Established Leaders, Leading Challengers, or Disruptors & Challengers.

Locates where complements amplify value and substitutes erode it, forecasting net impact by horizon

We deliver granular, decision-grade intel: market sizing, 5-year forecasts, pricing, adoption, usage, revenue, and operational KPIs—plus competitor tracking, regulation, and value chains—across 60 countries broadly.

Spot the shifts before they hit your P&L. We track inflection points, adoption curves, pricing moves, and ecosystem plays to show where demand is heading, why it is changing, and what to do next across high-growth markets and disruptive tech

Real-time reads of user behavior. We track shifting priorities, perceptions of today’s and next-gen services, and provider experience, then pace how fast tech moves from trial to adoption, blending buyer, consumer, and channel inputs with social signals (#WhySwitch, #UX).

Partner with our analyst team to build a custom report designed around your business priorities. From analysing market trends to assessing competitors or crafting bespoke datasets, we tailor insights to your needs.
Supplier Intelligence
Discovery & Profiling
Capacity & Footprint
Performance & Risk
Compliance & Governance
Commercial Readiness
Who Supplies Whom
Scorecards & Shortlists
Playbooks & Docs
Category Intelligence
Definition & Scope
Demand & Use Cases
Cost Drivers
Market Structure
Supply Chain Map
Trade & Policy
Operating Norms
Deliverables
Buyer Intelligence
Account Basics
Spend & Scope
Procurement Model
Vendor Requirements
Terms & Policies
Entry Strategy
Pain Points & Triggers
Outputs
Pricing Analysis
Benchmarks
Trends
Should-Cost
Indexation
Landed Cost
Commercial Terms
Deliverables
Brand Analysis
Positioning & Value Prop
Share & Presence
Customer Evidence
Go-to-Market
Digital & Reputation
Compliance & Trust
KPIs & Gaps
Outputs
Full Research Suite comprises of:
Market outlook & trends analysis
Interviews & case studies
Strategic recommendations
Vendor profiles & capabilities analysis
5-year forecasts
8 regions and 60+ country-level data splits
Market segment data splits
12 months of continuous data updates
DELIVERED AS:
PDF EXCEL ONLINE
Market Share Insights for Bamboo Straw Providers
Straw Market Size and Share Forecast Outlook 2025 to 2035
Bamboo Market Analysis - Size, Share, and Forecast Outlook 2025 to 2035
Bamboo Extracts for Anti-Aging Market Analysis - Size and Share Forecast Outlook 2025 to 2035
Bamboo Extracts for Skin Market Analysis - Size and Share Forecast Outlook 2025 to 2035
Bamboo Apparel Market Size and Share Forecast Outlook 2025 to 2035
Bamboo Fiber Tableware and Kitchenware Market Size and Share Forecast Outlook 2025 to 2035
Bamboo Engineered Wood Market Size and Share Forecast Outlook 2025 to 2035
Bamboo Market Analysis - Demand, Trends & Industry Forecast 2024 to 2034
Bamboo Packaging Market Share, Growth & Trends 2025 to 2035
Bamboo Cups Market Analysis and Insights for 2025 to 2035
Strawberry Seed Oil Market Analysis by Application, End-use, Distribution channel and Region Through 2035
Bamboo Products Market Analysis – Trends & Growth 2025 to 2035
Leading Providers & Market Share in the Straw Industry
Straw Paper Market Trends - Growth & Sustainability 2025 to 2035
Strawless Lids Market
Metal Straw Market Size and Share Forecast Outlook 2025 to 2035
Canada Straws Market Size and Share Forecast Outlook 2025 to 2035
Reusable Straws Market Analysis - Trends, Growth & Forecast 2025 to 2035
Demand for Bamboo Products in USA Size and Share Forecast Outlook 2025 to 2035

Thank you!
You will receive an email from our Business Development Manager. Please be sure to check your SPAM/JUNK folder too.
Chat With
MaRIA