Compostable Straws Market Size, Share & Forecast 2025 to 2035

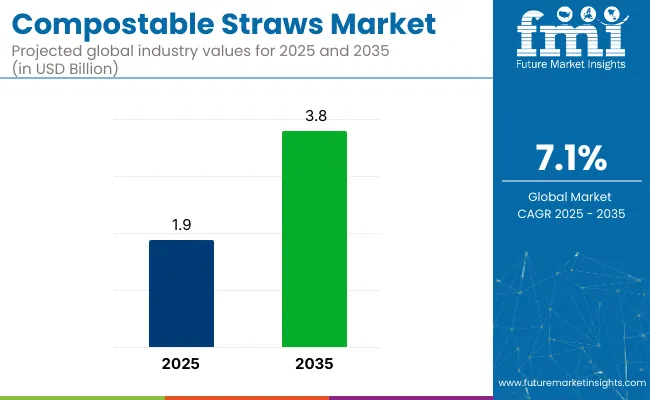
The global compostable straws market is projected to grow from USD 1.9 billion in 2025 to USD 3.8 billion by 2035, registering a CAGR of 7.1% during the forecast period. Sales in 2024 were recorded at USD 1.8 billion. This growth is primarily attributed to the rising implementation of plastic bans, growing environmental consciousness, and increasing adoption of eco-friendly alternatives in the foodservice and hospitality sectors.
Quick Stats of Compostable Straws Market

  • Market Value (2025): USD 1.9 billion
  • Forecast Value (2035): USD 3.8 billion
  • Forecast CAGR: 7.1%
  • Material Type Leader in 2025: Paper (44.3% market share)
  • Top End Use: Foodservice (52.8% share)
  • Key Growth Country: North America (United States to witness maximum CAGR of 7.5%)

Compostable Straws Market

Metric Value
Estimated Size (2025E) USD 1.9 billion
Projected Value (2035F) USD 3.8 billion
CAGR (2025 to 2035) 7.1%

Compostable straws, made from materials such as polylactic acid (PLA), paper, wheat, and bamboo, provide a biodegradable and non-toxic solution to plastic straws, breaking down naturally without harming the environment. Their expanding application in cafés, quick-service restaurants, and institutional catering has accelerated global market penetration.

In 2023, Sulapac Ltd., a Finland-based sustainable packaging innovator, secured €15 million in a funding round co-led by Lifeline Ventures and Chanel to scale up the production of its bio-based straws and packaging solutions. The investment was directed toward expanding manufacturing capabilities and developing new PLA-free compostable straw technologies to address micro plastic concerns.

We are excited that these international players recognize the potential of our innovation and support our mission to save the world from plastic waste. The renewed support from the leading luxury house Chanel also indicates that sustainability is a priority in the luxury market. As a truly sustainable alternative celebrating premium quality and design, Sulapac is the perfect fit for this segment.”- Suvi Haimi, CEO of Sulapac.

Recent innovations in the compostable straws market focus on durability and water resistance. Manufacturers are developing multi-layered coatings, using cellulose, agar, and edible-grade materials to improve functionality. These designs prevent premature sogginess while ensuring full composability.

The market is expected to witness significant growth in Asia-Pacific due to expanding foodservice sectors and strong government support for biodegradable materials. Manufacturers are expected to scale local production and invest in cost-efficient materials to meet volume demand and regulatory compliance.

Analyzing Compostable Straws Market by Top Investment Segment

The market has been segmented based on material type, width/diameter, sales channel, end use, and product type. By material type, paper, virgin Kraft paper, recycled paper, pasta, bamboo, and polylactic acid (PLA) have been adopted to align with biodegradability goals, consumer safety, and regulatory compliance in sustainable foodservice packaging.

Width segmentation includes <7 mm, 7-10 mm, 10-15 mm, and >15 mm variants to accommodate various beverage types, from soft drinks to smoothies and bubble tea. Sales channels include manufacturers, distributors, brick & mortar stores, hypermarkets, supermarkets, convenience stores, specialty stores, discount stores, and e-retail, reflecting the expanding accessibility of eco-friendly straws across B2B and B2C landscapes.

End use is segmented into foodservice (hotels & restaurants, bars & lounges, cafés & fast food chains, cinemas, airline & railway), institutional (educational, healthcare, corporate), and households to capture diversified consumption environments. Product types include straight and flexible straws, each available in printed and non-printed formats to cater to brand customization needs and visual appeal in different service settings.
Paper Segment to Lead Amid Biodegradability and Cost-Effectiveness

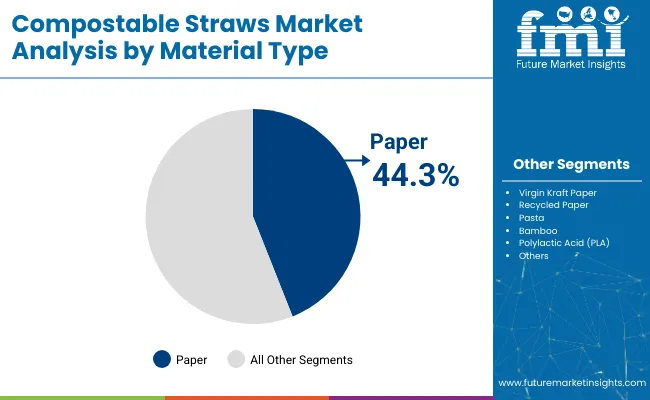
Compostable Straws Market Analysis By Material Type

The paper segment is expected to dominate the compostable straws market with a 44.3% share in 2025, driven by its eco-friendliness, wide availability, and compliance with global plastic-ban mandates. Paper straws decompose naturally within 30-60 days under industrial composting, making them a go-to alternative to single-use plastic straws in regulatory-sensitive regions such as North America and the EU.

Manufacturers prefer paper due to its ease of molding into various diameters, compatibility with food-safe inks, and ability to hold up in cold beverages for up to 2-3 hours. Innovations in multi-ply construction, moisture-resistant coatings, and enhanced bonding adhesives have significantly improved the structural integrity and user experience of paper-based straws, narrowing the performance gap between paper and synthetic options.

With global initiatives like the EU’s Single-Use Plastics Directive and India’s plastic straw ban, demand for paper-based compostable straws has surged across fast-food chains, cafés, bars, and event caterers. Additionally, the lower cost of raw materials and simpler production infrastructure relative to PLA or bamboo options gives paper an economic advantage, especially for high-volume foodservice applications. This segment is expected to remain dominant as both private-label and branded suppliers expand capacity and customization capabilities.
Foodservice Segment Gains Traction Amid Eco-Friendly Consumer Dining Preferences

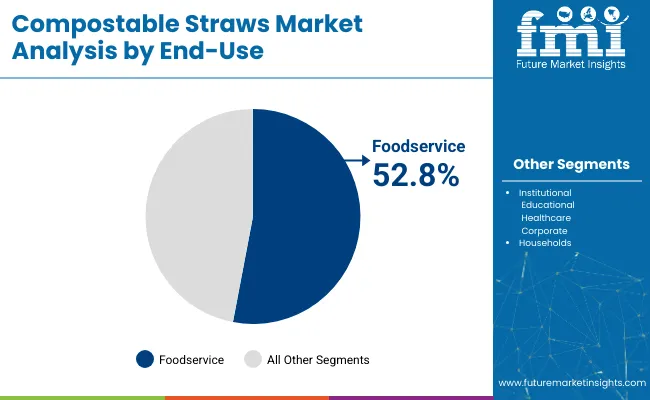
Compostable Straws Market Analysis By End Use

The foodservice segment is projected to account for the largest share of 52.8% in the compostable straws market in 2025, owing to rising sustainability commitments among restaurants, QSRs, hotels, and cafés. As consumers increasingly demand green packaging in their dining experiences, foodservice operators have adopted compostable straws to reinforce brand values and meet regulatory requirements.

This shift is particularly prominent in North America and Western Europe, where large fast-food chains (e.g., McDonald’s, Starbucks, Costa Coffee) have eliminated plastic straws in favor of compostable alternatives. Public sector institutions, catering services, and airline lounges are also rapidly adopting compostable straw formats in line with zero-waste and ESG compliance goals.

Beyond sustainability, the segment’s growth is reinforced by operational benefits including ease of bulk procurement, custom-print branding options, and compatibility with paper cups and lids. Compostable straws offer seamless integration into dine-in, takeaway, and delivery ecosystems without requiring equipment changes. With growing demand from bars, juice bars, and fast-casual outlets in urban centers, the foodservice segment is set to remain the key demand driver through 2035, supported by evolving dining norms and green certification requirements.

Challenge and Opportunity

Challenge: Disposal Infrastructure and Cost Constraints

Maybe one of the largest challenges the compostable straws market faces is a lack of disposal infrastructure to facilitate appropriate biodegradation. Compostable straws are meant to degrade easier than plastic, yet they are most often reliant on industrial composting not accessible to much of the nation. Without a way to obtain it, compostable straws will also end up in landfills and forfeit the environmental advantage they provide.

Another flaw is that they are more expensive than standard plastic straws. The added expense makes them undesirable for small food establishments and dollar stores, where price sensitivity is issue number one. So the utilization of compostable straws is not being promoted on a broad scale, and most companies will not be able to switch over on an expense basis.

Opportunity: Improvements in Material Science and Consumer Demand

Advances in material technology are opening up new avenues of possibility for compostable straws to achieve performance as much as sustainability. New-generation coating technologies are enhancing the water resistance of paper straws in a manner that they can be made robust without sacrificing their biodegradable character.

Other newer options such as seaweed, rice, or tapioca-based edible straws are being found as well, providing new consumer experiences and minimizing waste. This is due to the increasing need for green restaurants, especially from green-conscious millennials and Gen Z.

Their willingness to utilize green alternatives is a gigantic business opportunity for companies that have embraced green practice. As the customers increasingly demand greener products, the companies can gain from the trend towards greener living.
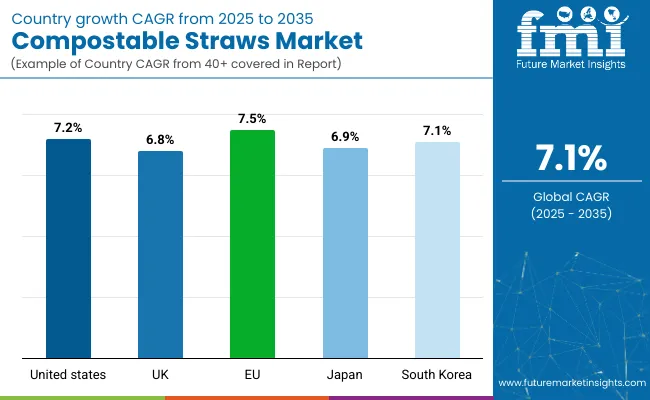
Country-Wise Outlook

Compostable Straws Market Country Wise Analysis

United States

US demand for compostable straws grew due to growing environmental consciousness and government restrictions on single-use plastics in the majority of states, including California and New York. Demand has been driven by the foodservice industry, coffee shops, and fast food restaurants.

In coming years, more companies will utilize compostable straws produced from renewable resources such as plant polymers and straw fibers. Compostable straws will be made more durable by coming technology, as well as even more pleasant to use, and they will be food service favorite number one.

Increased Demand by Quick-Service Restaurants: Major chains like McDonald's and Starbucks have launched compostable straw programs, and mass-market expansion has been the result. The close to USD 150 billion USA food delivery market continues to drive demand for biodegradable straws with sustainable packaging increasing more mainstream.

Country CAGR (2025 to 2035)
USA 7.2%

United Kingdom

UK compostable straw market is seeing a fast expansion with the plastic straw prohibition in the 2020 Single-Use Plastics Directive. The environment, social movements, hospitality sector pressure drive the market.

The sector is also investing in completely compostable products such as wheat, bamboo, and PLA straws. The drinks sector and retailers are also adopting completely compostable products in an effort to acquire new customer base via sustainable adoption of straws.

Hospitality and Retail Growth: UK hospitality industry worth more than £100 billion is increasingly turning to compostable straws in its bid for sustainability. Waste management infrastructure growth continues to drive industry expansion.

Country CAGR (2025 to 2035)
UK 6.8%

European Union

European Union also has been the forerunner in prohibiting single-use plastics with strict control through EU Directive on Plastics. Plastic straws are banned in Germany, France, and Italy, and compostable straws are trending nowadays.

Compostable straws market is growing as consumers are in search of eco-friendly products and CSR. Additionally, R&D effort towards manufacturing technology has made the cost of bio-based straws lower, and now they become affordable to business.

Increased Investment in Sustainable Packaging: The European food and beverage packaging industry valued at approximately €350 billion still contains biodegradable and compostable material, thus further increasing demand for sustainable straws.

Country CAGR (2025 to 2035)
European Union 7.5%

Japan

The market of biodegradable straws in Japan is led by the Japanese government moving away from plastic waste and towards more environmentally friendly alternatives. The Japanese Ministry of the Environment initiated aggressive campaigns to cut plastic waste by 25% in 2030, and it has accelerated the use of biodegradable straws at a faster pace.

They enjoy a longer lifespan of a product and dependability, so very long-lasting products exist in the form of compostable straws which are manufactured using fresh raw materials such as rice, seaweed, and break-down plastic. Convenience stores, supermarkets, and beverage chains employed more and more of the compostable type.

Innovation Technologies of Biodegradable Straws: Nanotechnology-derived bioplastics mixed with very thin but extremely durable material in its bioform already dominating marketplaces Japan first before top rank for green straw manufacturing.

Country CAGR (2025 to 2035)
Japan 6.9%

South Korea

The South Korean market is expanding for biodegradable straws due to strict waste management regulations and consumer demand for eco-friendly products. The government's Zero Waste campaign and banning plastic straws in coffee shops compelled companies to shift to biodegradable straws.

The region's local production is also turning to new material such as cornstarch, bamboo fibers, and bioplastics PLA-based biodegradable materials to manufacture straws sustainable and stronger. South Korea's goal of a carbon-neutral target by 2050 is catalyzing the market demand.

Green Packaging Solution Development: South Korea's green food and retail market with chain leaders such as Starbucks Korea and Paris Baguette adopted compostable straws with total passion, catalyzing growth in the market.

Country CAGR (2025 to 2035)
South Korea 7.1%

Competitive Outlook

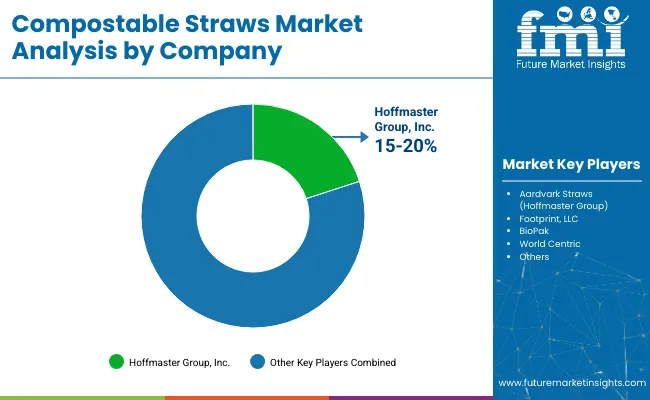
Compostable Straws Market Analysis By Company

Compostable straw is a competitive industry with the dominance of powerful global players and a combination of regional producers specializing in sustainable packaging. There are some powerful players with large market shares, specializing in material innovation and sustainable product development.

The companies are leadership-generating in biodegradable alternatives to plastic, responding to global regulatory policy and changing consumer behavior. The market is controlled by a combination of seasoned industry players and new entrants to the market, all of whom have important parts to play in shaping industry trends through technological innovation and strategic partnerships.

Key Companies

  • Stora Enso Oyj​
  • Biopac (UK) Ltd​
  • Sulapac Ltd.​
  • The Paper Straw Co.​
  • Tembo Paper B.V.​
  • Vegware Ltd.​
  • Hello Straw​
  • Hoffmaster Group, Inc.​
  • Intrinsic Paper Straws​
  • The Blue Straw

Key Segments

By Material Type

  • Paper
    • Virgin Kraft Paper
    • Recycled Paper
  • Pasta
  • Bamboo
  • Polylactic Acid (PLA)

By Width/Diameter:

  • < 7 mm
  • 7 - 10 mm
  • 10 - 15 mm
  • > 15 mm

By Sales Channel

  • Manufacturers
  • Distributors
  • Brick & Mortar Stores
    • Hypermarkets
    • Supermarkets
    • Convenience Stores
    • Specialty Stores
    • Discount Stores
  • E-retail

By End Use:

  • Foodservice
    • Hotels & Restaurants
    • Bars & Lounges
    • Cafés & Fast Food Chains
    • Cinemas
    • Airline & Railway
  • Institutional
    • Educational
    • Healthcare
    • Corporate
  • Households

By Product Type:

  • Straight Straw
    • Printed
    • Non-Printed
  • Flexible Straw
    • Printed
    • Non-Printed

By Region:

  • North America
  • Latin America
  • Europe
  • APAC
  • MEA

Table of Content

  1. Executive Summary
    • Global Market Outlook
    • Demand-side Trends
    • Supply-side Trends
    • Technology Roadmap Analysis
    • Analysis and Recommendations
  2. Market Overview
    • Market Coverage / Taxonomy
    • Market Definition / Scope / Limitations
  3. Market Background
    • Market Dynamics
      • Drivers
      • Restraints
      • Opportunity
      • Trends
    • Scenario Forecast
      • Demand in Optimistic Scenario
      • Demand in Likely Scenario
      • Demand in Conservative Scenario
    • Opportunity Map Analysis
    • Product Life Cycle Analysis
    • Supply Chain Analysis
      • Supply Side Participants and their Roles
        • Producers
        • Mid-Level Participants (Traders/ Agents/ Brokers)
        • Wholesalers and Distributors
      • Value Added and Value Created at Node in the Supply Chain
      • List of Raw Material Suppliers
      • List of Existing and Potential Buyer’s
    • Investment Feasibility Matrix
    • Value Chain Analysis
      • Profit Margin Analysis
      • Wholesalers and Distributors
      • Retailers
    • PESTLE and Porter’s Analysis
    • Regulatory Landscape
      • By Key Regions
      • By Key Countries
    • Regional Parent Market Outlook
    • Production and Consumption Statistics
    • Import and Export Statistics
  4. Global Market Analysis 2020 to 2024 and Forecast, 2025 to 2035
    • Historical Market Size Value (USD Million) & Volume (Units) Analysis, 2020 to 2024
    • Current and Future Market Size Value (USD Million) & Volume (Units) Projections, 2025 to 2035
      • Y-o-Y Growth Trend Analysis
      • Absolute $ Opportunity Analysis
  5. Global Market Pricing Analysis 2020 to 2024 and Forecast 2025 to 2035
  6. Global Market Analysis 2020 to 2024 and Forecast 2025 to 2035, By Material Type
    • Introduction / Key Findings
    • Historical Market Size Value (USD Million) & Volume (Units) Analysis By Material Type, 2020 to 2024
    • Current and Future Market Size Value (USD Million) & Volume (Units) Analysis and Forecast By Material Type, 2025 to 2035
      • Paper
        • Virgin Kraft Paper
        • Recycled Paper
      • Pasta
      • Bamboo
      • Polylactic Acid (PLA)
    • Y-o-Y Growth Trend Analysis By Material Type, 2020 to 2024
    • Absolute $ Opportunity Analysis By Material Type, 2025 to 2035
  7. Global Market Analysis 2020 to 2024 and Forecast 2025 to 2035, By Width/Diameter
    • Introduction / Key Findings
    • Historical Market Size Value (USD Million) & Volume (Units) Analysis By Width/Diameter, 2020 to 2024
    • Current and Future Market Size Value (USD Million) & Volume (Units) Analysis and Forecast By Width/Diameter, 2025 to 2035
      • < 7 mm
      • 7 - 10 mm
      • 10 - 15 mm
      • > 15 mm
    • Y-o-Y Growth Trend Analysis By Width/Diameter, 2020 to 2024
    • Absolute $ Opportunity Analysis By Width/Diameter, 2025 to 2035
  8. Global Market Analysis 2020 to 2024 and Forecast 2025 to 2035, By Sales Channel
    • Introduction / Key Findings
    • Historical Market Size Value (USD Million) & Volume (Units) Analysis By Sales Channel, 2020 to 2024
    • Current and Future Market Size Value (USD Million) & Volume (Units) Analysis and Forecast By Sales Channel, 2025 to 2035
      • Manufacturers
      • Distributors
      • Brick & Mortar Stores
        • Hypermarkets
        • Supermarkets
        • Convenience Stores
        • Specialty Stores
        • Discount Stores
      • E-retail
    • Y-o-Y Growth Trend Analysis By Sales Channel, 2020 to 2024
    • Absolute $ Opportunity Analysis By Sales Channel, 2025 to 2035
  9. Global Market Analysis 2020 to 2024 and Forecast 2025 to 2035, By End Use
    • Introduction / Key Findings
    • Historical Market Size Value (USD Million) & Volume (Units) Analysis By End Use, 2020 to 2024
    • Current and Future Market Size Value (USD Million) & Volume (Units) Analysis and Forecast By End Use, 2025 to 2035
      • Foodservice
        • Hotels & Restaurants
        • Bars & Lounges
        • Cafés & Fast Food Chains
        • Cinemas
        • Airline & Railway
      • Institutional
        • Educational
        • Healthcare
        • Corporate
      • Households
    • Y-o-Y Growth Trend Analysis By End Use, 2020 to 2024
    • Absolute $ Opportunity Analysis By End Use, 2025 to 2035
  10. Global Market Analysis 2020 to 2024 and Forecast 2025 to 2035, By Product Type
    • Introduction / Key Findings
    • Historical Market Size Value (USD Million) & Volume (Units) Analysis By Product Type, 2020 to 2024
    • Current and Future Market Size Value (USD Million) & Volume (Units) Analysis and Forecast By Product Type, 2025 to 2035
      • Straight Straw
        • Printed
        • Non-Printed
      • Flexible Straw
        • Printed
        • Non-Printed
    • Y-o-Y Growth Trend Analysis By Product Type, 2020 to 2024
    • Absolute $ Opportunity Analysis By Product Type, 2025 to 2035
  11. Global Market Analysis 2020 to 2024 and Forecast 2025 to 2035, By Region
    • Introduction
    • Historical Market Size Value (USD Million) & Volume (Units) Analysis By Region, 2020 to 2024
    • Current Market Size Value (USD Million) & Volume (Units) Analysis and Forecast By Region, 2025 to 2035
      • North America
      • Latin America
      • Europe
      • East Asia
      • South Asia
      • Oceania
      • MEA
    • Market Attractiveness Analysis By Region
  12. North America Market Analysis 2020 to 2024 and Forecast 2025 to 2035, By Country
    • Historical Market Size Value (USD Million) & Volume (Units) Trend Analysis By Market Taxonomy, 2020 to 2024
    • Market Size Value (USD Million) & Volume (Units) Forecast By Market Taxonomy, 2025 to 2035
      • By Country
        • USA
        • Canada
      • By Material Type
      • By Width/Diameter
      • By Sales Channel
      • By End Use
      • By Product Type
    • Market Attractiveness Analysis
      • By Country
      • By Material Type
      • By Width/Diameter
      • By Sales Channel
      • By End Use
      • By Product Type
    • Key Takeaways
  13. Latin America Market Analysis 2020 to 2024 and Forecast 2025 to 2035, By Country
    • Historical Market Size Value (USD Million) & Volume (Units) Trend Analysis By Market Taxonomy, 2020 to 2024
    • Market Size Value (USD Million) & Volume (Units) Forecast By Market Taxonomy, 2025 to 2035
      • By Country
        • Brazil
        • Mexico
        • Argentina
        • Chile
        • Peru
        • Rest of Latin America
      • By Material Type
      • By Width/Diameter
      • By Sales Channel
      • By End Use
      • By Product Type
    • Market Attractiveness Analysis
      • By Country
      • By Material Type
      • By Width/Diameter
      • By Sales Channel
      • By End Use
      • By Product Type
    • Key Takeaways
  14. Europe Market Analysis 2020 to 2024 and Forecast 2025 to 2035, By Country
    • Historical Market Size Value (USD Million) & Volume (Units) Trend Analysis By Market Taxonomy, 2020 to 2024
    • Market Size Value (USD Million) & Volume (Units) Forecast By Market Taxonomy, 2025 to 2035
      • By Country
        • Germany
        • Italy
        • France
        • U.K.
        • Spain
        • Russia
        • BENELUX
        • Rest of Europe
      • By Material Type
      • By Width/Diameter
      • By Sales Channel
      • By End Use
      • By Product Type
    • Market Attractiveness Analysis
      • By Country
      • By Material Type
      • By Width/Diameter
      • By Sales Channel
      • By End Use
      • By Product Type
    • Key Takeaways
  15. East Asia Market Analysis 2020 to 2024 and Forecast 2025 to 2035, By Country
    • Historical Market Size Value (USD Million) & Volume (Units) Trend Analysis By Market Taxonomy, 2020 to 2024
    • Market Size Value (USD Million) & Volume (Units) Forecast By Market Taxonomy, 2025 to 2035
      • By Country
        • China
        • Japan
        • South Korea
      • By Material Type
      • By Width/Diameter
      • By Sales Channel
      • By End Use
      • By Product Type
    • Market Attractiveness Analysis
      • By Country
      • By Material Type
      • By Width/Diameter
      • By Sales Channel
      • By End Use
      • By Product Type
    • Key Takeaways
  16. South Asia Market Analysis 2020 to 2024 and Forecast 2025 to 2035, By Country
    • Historical Market Size Value (USD Million) & Volume (Units) Trend Analysis By Market Taxonomy, 2020 to 2024
    • Market Size Value (USD Million) & Volume (Units) Forecast By Market Taxonomy, 2025 to 2035
      • By Country
        • India
        • Thailand
        • Malaysia
        • Indonesia
        • Rest of South Asia
      • By Material Type
      • By Width/Diameter
      • By Sales Channel
      • By End Use
      • By Product Type
    • Market Attractiveness Analysis
      • By Country
      • By Material Type
      • By Width/Diameter
      • By Sales Channel
      • By End Use
      • By Product Type
    • Key Takeaways
  17. Oceania Market Analysis 2020 to 2024 and Forecast 2025 to 2035, By Country
    • Historical Market Size Value (USD Million) & Volume (Units) Trend Analysis By Market Taxonomy, 2020 to 2024
    • Market Size Value (USD Million) & Volume (Units) Forecast By Market Taxonomy, 2025 to 2035
      • By Country
        • Australia
        • New Zealand
      • By Material Type
      • By Width/Diameter
      • By Sales Channel
      • By End Use
      • By Product Type
    • Market Attractiveness Analysis
      • By Country
      • By Material Type
      • By Width/Diameter
      • By Sales Channel
      • By End Use
      • By Product Type
    • Key Takeaways
  18. MEA Market Analysis 2020 to 2024 and Forecast 2025 to 2035, By Country
    • Historical Market Size Value (USD Million) & Volume (Units) Trend Analysis By Market Taxonomy, 2020 to 2024
    • Market Size Value (USD Million) & Volume (Units) Forecast By Market Taxonomy, 2025 to 2035
      • By Country
        • GCC
        • Rest of MEA
      • By Material Type
      • By Width/Diameter
      • By Sales Channel
      • By End Use
      • By Product Type
    • Market Attractiveness Analysis
      • By Country
      • By Material Type
      • By Width/Diameter
      • By Sales Channel
      • By End Use
      • By Product Type
    • Key Takeaways
  19. Key Countries Market Analysis
    • USA
      • Pricing Analysis
      • Market Share Analysis, 2024
        • By Material Type
        • By Width/Diameter
        • By Sales Channel
        • By End Use
        • By Product Type
    • Canada
      • Pricing Analysis
      • Market Share Analysis, 2024
        • By Material Type
        • By Width/Diameter
        • By Sales Channel
        • By End Use
        • By Product Type
    • Brazil
      • Pricing Analysis
      • Market Share Analysis, 2024
        • By Material Type
        • By Width/Diameter
        • By Sales Channel
        • By End Use
        • By Product Type
    • Mexico
      • Pricing Analysis
      • Market Share Analysis, 2024
        • By Material Type
        • By Width/Diameter
        • By Sales Channel
        • By End Use
        • By Product Type
    • Argentina
      • Pricing Analysis
      • Market Share Analysis, 2024
        • By Material Type
        • By Width/Diameter
        • By Sales Channel
        • By End Use
        • By Product Type
  20. Market Structure Analysis
    • Competition Dashboard
    • Competition Benchmarking
    • Market Share Analysis of Top Players
      • By Regional
      • By Material Type
      • By Width/Diameter
      • By Sales Channel
      • By End Use
      • By Product Type
  21. Competition Analysis
    • Competition Deep Dive
      • Stora Enso Oyj
        • Overview
        • Product Portfolio
        • Profitability by Market Segments (Product/Age /Sales Channel/Region)
        • Sales Footprint
        • Strategy Overview
          • Marketing Strategy
          • Product Strategy
          • Channel Strategy
      • Biopac (UK) Ltd
        • Overview
        • Product Portfolio
        • Profitability by Market Segments (Product/Age /Sales Channel/Region)
        • Sales Footprint
        • Strategy Overview
          • Marketing Strategy
          • Product Strategy
          • Channel Strategy
      • Sulapac Ltd.
        • Overview
        • Product Portfolio
        • Profitability by Market Segments (Product/Age /Sales Channel/Region)
        • Sales Footprint
        • Strategy Overview
          • Marketing Strategy
          • Product Strategy
          • Channel Strategy
      • The Paper Straw Co.
        • Overview
        • Product Portfolio
        • Profitability by Market Segments (Product/Age /Sales Channel/Region)
        • Sales Footprint
        • Strategy Overview
          • Marketing Strategy
          • Product Strategy
          • Channel Strategy
      • Tembo Paper B.V.
        • Overview
        • Product Portfolio
        • Profitability by Market Segments (Product/Age /Sales Channel/Region)
        • Sales Footprint
        • Strategy Overview
          • Marketing Strategy
          • Product Strategy
          • Channel Strategy
      • Vegware Ltd.
        • Overview
        • Product Portfolio
        • Profitability by Market Segments (Product/Age /Sales Channel/Region)
        • Sales Footprint
        • Strategy Overview
          • Marketing Strategy
          • Product Strategy
          • Channel Strategy
      • Hello Straw
        • Overview
        • Product Portfolio
        • Profitability by Market Segments (Product/Age /Sales Channel/Region)
        • Sales Footprint
        • Strategy Overview
          • Marketing Strategy
          • Product Strategy
          • Channel Strategy
      • Hoffmaster Group, Inc.
        • Overview
        • Product Portfolio
        • Profitability by Market Segments (Product/Age /Sales Channel/Region)
        • Sales Footprint
        • Strategy Overview
          • Marketing Strategy
          • Product Strategy
          • Channel Strategy
      • Intrinsic Paper Straws
        • Overview
        • Product Portfolio
        • Profitability by Market Segments (Product/Age /Sales Channel/Region)
        • Sales Footprint
        • Strategy Overview
          • Marketing Strategy
          • Product Strategy
          • Channel Strategy
      • The Blue Straw
        • Overview
        • Product Portfolio
        • Profitability by Market Segments (Product/Age /Sales Channel/Region)
        • Sales Footprint
        • Strategy Overview
          • Marketing Strategy
          • Product Strategy
          • Channel Strategy
  22. Assumptions & Acronyms Used
  23. Research Methodology

List of Tables

  • Table 1: Global Market Value (USD Million) Forecast by Region, 2020-2035
  • Table 2: Global Market Volume (Units) Forecast by Region, 2020-2035
  • Table 3: Global Market Value (USD Million) Forecast by Material Type, 2020-2035
  • Table 4: Global Market Volume (Units) Forecast by Material Type, 2020-2035
  • Table 5: Global Market Value (USD Million) Forecast by Width/Diameter, 2020-2035
  • Table 6: Global Market Volume (Units) Forecast by Width/Diameter, 2020-2035
  • Table 7: Global Market Value (USD Million) Forecast by Sales Channel, 2020-2035
  • Table 8: Global Market Volume (Units) Forecast by Sales Channel, 2020-2035
  • Table 9: Global Market Value (USD Million) Forecast by End Use, 2020-2035
  • Table 10: Global Market Volume (Units) Forecast by End Use, 2020-2035
  • Table 11: Global Market Value (USD Million) Forecast by Product Type, 2020-2035
  • Table 12: Global Market Volume (Units) Forecast by Product Type, 2020-2035
  • Table 13: North America Market Value (USD Million) Forecast by Country, 2020-2035
  • Table 14: North America Market Volume (Units) Forecast by Country, 2020-2035
  • Table 15: North America Market Value (USD Million) Forecast by Material Type, 2020-2035
  • Table 16: North America Market Volume (Units) Forecast by Material Type, 2020-2035
  • Table 17: North America Market Value (USD Million) Forecast by Width/Diameter, 2020-2035
  • Table 18: North America Market Volume (Units) Forecast by Width/Diameter, 2020-2035
  • Table 19: North America Market Value (USD Million) Forecast by Sales Channel, 2020-2035
  • Table 20: North America Market Volume (Units) Forecast by Sales Channel, 2020-2035
  • Table 21: North America Market Value (USD Million) Forecast by End Use, 2020-2035
  • Table 22: North America Market Volume (Units) Forecast by End Use, 2020-2035
  • Table 23: North America Market Value (USD Million) Forecast by Product Type, 2020-2035
  • Table 24: North America Market Volume (Units) Forecast by Product Type, 2020-2035
  • Table 25: Latin America Market Value (USD Million) Forecast by Country, 2020-2035
  • Table 26: Latin America Market Volume (Units) Forecast by Country, 2020-2035
  • Table 27: Latin America Market Value (USD Million) Forecast by Material Type, 2020-2035
  • Table 28: Latin America Market Volume (Units) Forecast by Material Type, 2020-2035
  • Table 29: Latin America Market Value (USD Million) Forecast by Width/Diameter, 2020-2035
  • Table 30: Latin America Market Volume (Units) Forecast by Width/Diameter, 2020-2035
  • Table 31: Latin America Market Value (USD Million) Forecast by Sales Channel, 2020-2035
  • Table 32: Latin America Market Volume (Units) Forecast by Sales Channel, 2020-2035
  • Table 33: Latin America Market Value (USD Million) Forecast by End Use, 2020-2035
  • Table 34: Latin America Market Volume (Units) Forecast by End Use, 2020-2035
  • Table 35: Latin America Market Value (USD Million) Forecast by Product Type, 2020-2035
  • Table 36: Latin America Market Volume (Units) Forecast by Product Type, 2020-2035
  • Table 37: Europe Market Value (USD Million) Forecast by Country, 2020-2035
  • Table 38: Europe Market Volume (Units) Forecast by Country, 2020-2035
  • Table 39: Europe Market Value (USD Million) Forecast by Material Type, 2020-2035
  • Table 40: Europe Market Volume (Units) Forecast by Material Type, 2020-2035
  • Table 41: Europe Market Value (USD Million) Forecast by Width/Diameter, 2020-2035
  • Table 42: Europe Market Volume (Units) Forecast by Width/Diameter, 2020-2035
  • Table 43: Europe Market Value (USD Million) Forecast by Sales Channel, 2020-2035
  • Table 44: Europe Market Volume (Units) Forecast by Sales Channel, 2020-2035
  • Table 45: Europe Market Value (USD Million) Forecast by End Use, 2020-2035
  • Table 46: Europe Market Volume (Units) Forecast by End Use, 2020-2035
  • Table 47: Europe Market Value (USD Million) Forecast by Product Type, 2020-2035
  • Table 48: Europe Market Volume (Units) Forecast by Product Type, 2020-2035
  • Table 49: East Asia Market Value (USD Million) Forecast by Country, 2020-2035
  • Table 50: East Asia Market Volume (Units) Forecast by Country, 2020-2035
  • Table 51: East Asia Market Value (USD Million) Forecast by Material Type, 2020-2035
  • Table 52: East Asia Market Volume (Units) Forecast by Material Type, 2020-2035
  • Table 53: East Asia Market Value (USD Million) Forecast by Width/Diameter, 2020-2035
  • Table 54: East Asia Market Volume (Units) Forecast by Width/Diameter, 2020-2035
  • Table 55: East Asia Market Value (USD Million) Forecast by Sales Channel, 2020-2035
  • Table 56: East Asia Market Volume (Units) Forecast by Sales Channel, 2020-2035
  • Table 57: East Asia Market Value (USD Million) Forecast by End Use, 2020-2035
  • Table 58: East Asia Market Volume (Units) Forecast by End Use, 2020-2035
  • Table 59: East Asia Market Value (USD Million) Forecast by Product Type, 2020-2035
  • Table 60: East Asia Market Volume (Units) Forecast by Product Type, 2020-2035
  • Table 61: South Asia Market Value (USD Million) Forecast by Country, 2020-2035
  • Table 62: South Asia Market Volume (Units) Forecast by Country, 2020-2035
  • Table 63: South Asia Market Value (USD Million) Forecast by Material Type, 2020-2035
  • Table 64: South Asia Market Volume (Units) Forecast by Material Type, 2020-2035
  • Table 65: South Asia Market Value (USD Million) Forecast by Width/Diameter, 2020-2035
  • Table 66: South Asia Market Volume (Units) Forecast by Width/Diameter, 2020-2035
  • Table 67: South Asia Market Value (USD Million) Forecast by Sales Channel, 2020-2035
  • Table 68: South Asia Market Volume (Units) Forecast by Sales Channel, 2020-2035
  • Table 69: South Asia Market Value (USD Million) Forecast by End Use, 2020-2035
  • Table 70: South Asia Market Volume (Units) Forecast by End Use, 2020-2035
  • Table 71: South Asia Market Value (USD Million) Forecast by Product Type, 2020-2035
  • Table 72: South Asia Market Volume (Units) Forecast by Product Type, 2020-2035
  • Table 73: Oceania Market Value (USD Million) Forecast by Country, 2020-2035
  • Table 74: Oceania Market Volume (Units) Forecast by Country, 2020-2035
  • Table 75: Oceania Market Value (USD Million) Forecast by Material Type, 2020-2035
  • Table 76: Oceania Market Volume (Units) Forecast by Material Type, 2020-2035
  • Table 77: Oceania Market Value (USD Million) Forecast by Width/Diameter, 2020-2035
  • Table 78: Oceania Market Volume (Units) Forecast by Width/Diameter, 2020-2035
  • Table 79: Oceania Market Value (USD Million) Forecast by Sales Channel, 2020-2035
  • Table 80: Oceania Market Volume (Units) Forecast by Sales Channel, 2020-2035
  • Table 81: Oceania Market Value (USD Million) Forecast by End Use, 2020-2035
  • Table 82: Oceania Market Volume (Units) Forecast by End Use, 2020-2035
  • Table 83: Oceania Market Value (USD Million) Forecast by Product Type, 2020-2035
  • Table 84: Oceania Market Volume (Units) Forecast by Product Type, 2020-2035
  • Table 85: MEA Market Value (USD Million) Forecast by Country, 2020-2035
  • Table 86: MEA Market Volume (Units) Forecast by Country, 2020-2035
  • Table 87: MEA Market Value (USD Million) Forecast by Material Type, 2020-2035
  • Table 88: MEA Market Volume (Units) Forecast by Material Type, 2020-2035
  • Table 89: MEA Market Value (USD Million) Forecast by Width/Diameter, 2020-2035
  • Table 90: MEA Market Volume (Units) Forecast by Width/Diameter, 2020-2035
  • Table 91: MEA Market Value (USD Million) Forecast by Sales Channel, 2020-2035
  • Table 92: MEA Market Volume (Units) Forecast by Sales Channel, 2020-2035
  • Table 93: MEA Market Value (USD Million) Forecast by End Use, 2020-2035
  • Table 94: MEA Market Volume (Units) Forecast by End Use, 2020-2035
  • Table 95: MEA Market Value (USD Million) Forecast by Product Type, 2020-2035
  • Table 96: MEA Market Volume (Units) Forecast by Product Type, 2020-2035

List of Figures

  • Figure 1: Global Market Volume (Units) Forecast 2020-2035
  • Figure 2: Global Market Pricing Analysis
  • Figure 3: Global Market Value (USD Million) Forecast 2020-2035
  • Figure 4: Global Market Value Share and BPS Analysis by Material Type, 2025 and 2035
  • Figure 5: Global Market Y-o-Y Growth Comparison by Material Type, 2025-2035
  • Figure 6: Global Market Attractiveness Analysis by Material Type
  • Figure 7: Global Market Value Share and BPS Analysis by Width/Diameter, 2025 and 2035
  • Figure 8: Global Market Y-o-Y Growth Comparison by Width/Diameter, 2025-2035
  • Figure 9: Global Market Attractiveness Analysis by Width/Diameter
  • Figure 10: Global Market Value Share and BPS Analysis by Sales Channel, 2025 and 2035
  • Figure 11: Global Market Y-o-Y Growth Comparison by Sales Channel, 2025-2035
  • Figure 12: Global Market Attractiveness Analysis by Sales Channel
  • Figure 13: Global Market Value Share and BPS Analysis by End Use, 2025 and 2035
  • Figure 14: Global Market Y-o-Y Growth Comparison by End Use, 2025-2035
  • Figure 15: Global Market Attractiveness Analysis by End Use
  • Figure 16: Global Market Value Share and BPS Analysis by Product Type, 2025 and 2035
  • Figure 17: Global Market Y-o-Y Growth Comparison by Product Type, 2025-2035
  • Figure 18: Global Market Attractiveness Analysis by Product Type
  • Figure 19: Global Market Value (USD Million) Share and BPS Analysis by Region, 2025 and 2035
  • Figure 20: Global Market Y-o-Y Growth Comparison by Region, 2025-2035
  • Figure 21: Global Market Attractiveness Analysis by Region
  • Figure 22: North America Market Incremental $ Opportunity, 2025-2035
  • Figure 23: Latin America Market Incremental $ Opportunity, 2025-2035
  • Figure 24: Europe Market Incremental $ Opportunity, 2025-2035
  • Figure 25: East Asia Market Incremental $ Opportunity, 2025-2035
  • Figure 26: South Asia Market Incremental $ Opportunity, 2025-2035
  • Figure 27: Oceania Market Incremental $ Opportunity, 2025-2035
  • Figure 28: MEA Market Incremental $ Opportunity, 2025-2035
  • Figure 29: North America Market Value Share and BPS Analysis by Country, 2025 and 2035
  • Figure 30: North America Market Value Share and BPS Analysis by Material Type, 2025 and 2035
  • Figure 31: North America Market Y-o-Y Growth Comparison by Material Type, 2025-2035
  • Figure 32: North America Market Attractiveness Analysis by Material Type
  • Figure 33: North America Market Value Share and BPS Analysis by Width/Diameter, 2025 and 2035
  • Figure 34: North America Market Y-o-Y Growth Comparison by Width/Diameter, 2025-2035
  • Figure 35: North America Market Attractiveness Analysis by Width/Diameter
  • Figure 36: North America Market Value Share and BPS Analysis by Sales Channel, 2025 and 2035
  • Figure 37: North America Market Y-o-Y Growth Comparison by Sales Channel, 2025-2035
  • Figure 38: North America Market Attractiveness Analysis by Sales Channel
  • Figure 39: North America Market Value Share and BPS Analysis by End Use, 2025 and 2035
  • Figure 40: North America Market Y-o-Y Growth Comparison by End Use, 2025-2035
  • Figure 41: North America Market Attractiveness Analysis by End Use
  • Figure 42: North America Market Value Share and BPS Analysis by Product Type, 2025 and 2035
  • Figure 43: North America Market Y-o-Y Growth Comparison by Product Type, 2025-2035
  • Figure 44: North America Market Attractiveness Analysis by Product Type
  • Figure 45: Latin America Market Value Share and BPS Analysis by Country, 2025 and 2035
  • Figure 46: Latin America Market Value Share and BPS Analysis by Material Type, 2025 and 2035
  • Figure 47: Latin America Market Y-o-Y Growth Comparison by Material Type, 2025-2035
  • Figure 48: Latin America Market Attractiveness Analysis by Material Type
  • Figure 49: Latin America Market Value Share and BPS Analysis by Width/Diameter, 2025 and 2035
  • Figure 50: Latin America Market Y-o-Y Growth Comparison by Width/Diameter, 2025-2035
  • Figure 51: Latin America Market Attractiveness Analysis by Width/Diameter
  • Figure 52: Latin America Market Value Share and BPS Analysis by Sales Channel, 2025 and 2035
  • Figure 53: Latin America Market Y-o-Y Growth Comparison by Sales Channel, 2025-2035
  • Figure 54: Latin America Market Attractiveness Analysis by Sales Channel
  • Figure 55: Latin America Market Value Share and BPS Analysis by End Use, 2025 and 2035
  • Figure 56: Latin America Market Y-o-Y Growth Comparison by End Use, 2025-2035
  • Figure 57: Latin America Market Attractiveness Analysis by End Use
  • Figure 58: Latin America Market Value Share and BPS Analysis by Product Type, 2025 and 2035
  • Figure 59: Latin America Market Y-o-Y Growth Comparison by Product Type, 2025-2035
  • Figure 60: Latin America Market Attractiveness Analysis by Product Type
  • Figure 61: Europe Market Value Share and BPS Analysis by Country, 2025 and 2035
  • Figure 62: Europe Market Value Share and BPS Analysis by Material Type, 2025 and 2035
  • Figure 63: Europe Market Y-o-Y Growth Comparison by Material Type, 2025-2035
  • Figure 64: Europe Market Attractiveness Analysis by Material Type
  • Figure 65: Europe Market Value Share and BPS Analysis by Width/Diameter, 2025 and 2035
  • Figure 66: Europe Market Y-o-Y Growth Comparison by Width/Diameter, 2025-2035
  • Figure 67: Europe Market Attractiveness Analysis by Width/Diameter
  • Figure 68: Europe Market Value Share and BPS Analysis by Sales Channel, 2025 and 2035
  • Figure 69: Europe Market Y-o-Y Growth Comparison by Sales Channel, 2025-2035
  • Figure 70: Europe Market Attractiveness Analysis by Sales Channel
  • Figure 71: Europe Market Value Share and BPS Analysis by End Use, 2025 and 2035
  • Figure 72: Europe Market Y-o-Y Growth Comparison by End Use, 2025-2035
  • Figure 73: Europe Market Attractiveness Analysis by End Use
  • Figure 74: Europe Market Value Share and BPS Analysis by Product Type, 2025 and 2035
  • Figure 75: Europe Market Y-o-Y Growth Comparison by Product Type, 2025-2035
  • Figure 76: Europe Market Attractiveness Analysis by Product Type
  • Figure 77: East Asia Market Value Share and BPS Analysis by Country, 2025 and 2035
  • Figure 78: East Asia Market Value Share and BPS Analysis by Material Type, 2025 and 2035
  • Figure 79: East Asia Market Y-o-Y Growth Comparison by Material Type, 2025-2035
  • Figure 80: East Asia Market Attractiveness Analysis by Material Type
  • Figure 81: East Asia Market Value Share and BPS Analysis by Width/Diameter, 2025 and 2035
  • Figure 82: East Asia Market Y-o-Y Growth Comparison by Width/Diameter, 2025-2035
  • Figure 83: East Asia Market Attractiveness Analysis by Width/Diameter
  • Figure 84: East Asia Market Value Share and BPS Analysis by Sales Channel, 2025 and 2035
  • Figure 85: East Asia Market Y-o-Y Growth Comparison by Sales Channel, 2025-2035
  • Figure 86: East Asia Market Attractiveness Analysis by Sales Channel
  • Figure 87: East Asia Market Value Share and BPS Analysis by End Use, 2025 and 2035
  • Figure 88: East Asia Market Y-o-Y Growth Comparison by End Use, 2025-2035
  • Figure 89: East Asia Market Attractiveness Analysis by End Use
  • Figure 90: East Asia Market Value Share and BPS Analysis by Product Type, 2025 and 2035
  • Figure 91: East Asia Market Y-o-Y Growth Comparison by Product Type, 2025-2035
  • Figure 92: East Asia Market Attractiveness Analysis by Product Type
  • Figure 93: South Asia Market Value Share and BPS Analysis by Country, 2025 and 2035
  • Figure 94: South Asia Market Value Share and BPS Analysis by Material Type, 2025 and 2035
  • Figure 95: South Asia Market Y-o-Y Growth Comparison by Material Type, 2025-2035
  • Figure 96: South Asia Market Attractiveness Analysis by Material Type
  • Figure 97: South Asia Market Value Share and BPS Analysis by Width/Diameter, 2025 and 2035
  • Figure 98: South Asia Market Y-o-Y Growth Comparison by Width/Diameter, 2025-2035
  • Figure 99: South Asia Market Attractiveness Analysis by Width/Diameter
  • Figure 100: South Asia Market Value Share and BPS Analysis by Sales Channel, 2025 and 2035
  • Figure 101: South Asia Market Y-o-Y Growth Comparison by Sales Channel, 2025-2035
  • Figure 102: South Asia Market Attractiveness Analysis by Sales Channel
  • Figure 103: South Asia Market Value Share and BPS Analysis by End Use, 2025 and 2035
  • Figure 104: South Asia Market Y-o-Y Growth Comparison by End Use, 2025-2035
  • Figure 105: South Asia Market Attractiveness Analysis by End Use
  • Figure 106: South Asia Market Value Share and BPS Analysis by Product Type, 2025 and 2035
  • Figure 107: South Asia Market Y-o-Y Growth Comparison by Product Type, 2025-2035
  • Figure 108: South Asia Market Attractiveness Analysis by Product Type
  • Figure 109: Oceania Market Value Share and BPS Analysis by Country, 2025 and 2035
  • Figure 110: Oceania Market Value Share and BPS Analysis by Material Type, 2025 and 2035
  • Figure 111: Oceania Market Y-o-Y Growth Comparison by Material Type, 2025-2035
  • Figure 112: Oceania Market Attractiveness Analysis by Material Type
  • Figure 113: Oceania Market Value Share and BPS Analysis by Width/Diameter, 2025 and 2035
  • Figure 114: Oceania Market Y-o-Y Growth Comparison by Width/Diameter, 2025-2035
  • Figure 115: Oceania Market Attractiveness Analysis by Width/Diameter
  • Figure 116: Oceania Market Value Share and BPS Analysis by Sales Channel, 2025 and 2035
  • Figure 117: Oceania Market Y-o-Y Growth Comparison by Sales Channel, 2025-2035
  • Figure 118: Oceania Market Attractiveness Analysis by Sales Channel
  • Figure 119: Oceania Market Value Share and BPS Analysis by End Use, 2025 and 2035
  • Figure 120: Oceania Market Y-o-Y Growth Comparison by End Use, 2025-2035
  • Figure 121: Oceania Market Attractiveness Analysis by End Use
  • Figure 122: Oceania Market Value Share and BPS Analysis by Product Type, 2025 and 2035
  • Figure 123: Oceania Market Y-o-Y Growth Comparison by Product Type, 2025-2035
  • Figure 124: Oceania Market Attractiveness Analysis by Product Type
  • Figure 125: MEA Market Value Share and BPS Analysis by Country, 2025 and 2035
  • Figure 126: MEA Market Value Share and BPS Analysis by Material Type, 2025 and 2035
  • Figure 127: MEA Market Y-o-Y Growth Comparison by Material Type, 2025-2035
  • Figure 128: MEA Market Attractiveness Analysis by Material Type
  • Figure 129: MEA Market Value Share and BPS Analysis by Width/Diameter, 2025 and 2035
  • Figure 130: MEA Market Y-o-Y Growth Comparison by Width/Diameter, 2025-2035
  • Figure 131: MEA Market Attractiveness Analysis by Width/Diameter
  • Figure 132: MEA Market Value Share and BPS Analysis by Sales Channel, 2025 and 2035
  • Figure 133: MEA Market Y-o-Y Growth Comparison by Sales Channel, 2025-2035
  • Figure 134: MEA Market Attractiveness Analysis by Sales Channel
  • Figure 135: MEA Market Value Share and BPS Analysis by End Use, 2025 and 2035
  • Figure 136: MEA Market Y-o-Y Growth Comparison by End Use, 2025-2035
  • Figure 137: MEA Market Attractiveness Analysis by End Use
  • Figure 138: MEA Market Value Share and BPS Analysis by Product Type, 2025 and 2035
  • Figure 139: MEA Market Y-o-Y Growth Comparison by Product Type, 2025-2035
  • Figure 140: MEA Market Attractiveness Analysis by Product Type
  • Figure 141: Global Market - Tier Structure Analysis
  • Figure 142: Global Market - Company Share Analysis

Frequently Asked Questions

What was the overall size of the compostable straws market in 2025?

The global compostable straws market size was estimated at USD 1.9 billion in 2025.

How big is the compostable straws market expected to be in 2035?

The compostable straws market is expected to reach approximately USD 3.8 billion by 2035.

What will drive the demand for the compostable straws market during the forecast period?

The increasing environmental awareness, government regulations banning single-use plastics, and consumer demand for sustainable alternatives are expected to drive the demand for compostable straws during the forecast period.

List the top 5 countries contributing to the compostable straws market.

The top 5 countries driving the development of the compostable straws market are the United States, Canada, Germany, France, and China.

Which is the leading segment in the compostable straws market?

On the basis of material type, paper-based compostable straws are expected to command a significant share over the forecast period.

Explore Similar Insights

Future Market Insights

Compostable Straws Market