The global compostable foodservice packaging market is valued at USD 4.2 billion in 2025 and is slated to reach USD 9.8 billion by 2035, recording an absolute increase of USD 5.6 billion over the forecast period. Based on Future Market Insights (FMI)’s verified data on biopolymer, flexible, and rigid packaging adoption, this translates into a total growth of 133.3%, with the market forecast to expand at a compound annual growth rate (CAGR) of 8.8% between 2025 and 2035.
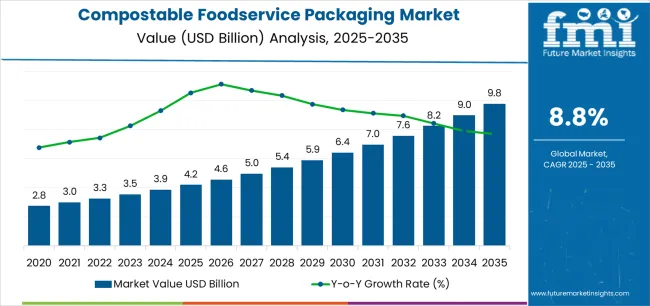
The overall market size is expected to grow by nearly 2.33X during the same period, supported by increasing consumer demand for environmentally responsible packaging alternatives, growing regulatory restrictions on single-use plastics, and rising preference for plant-based packaging materials across quick-service restaurants, casual dining establishments, and food delivery applications.
Between 2025 and 2030, the compostable foodservice packaging market is projected to expand from USD 4.2 billion to USD 6.4 billion, resulting in a value increase of USD 2.2 billion, which represents 39.3% of the total forecast growth for the decade.
This phase of development will be shaped by increasing quick-service restaurant adoption of compostable alternatives, rising implementation of extended producer responsibility programs, and growing demand for certified compostable packaging with enhanced functional performance. Foodservice operators are expanding their compostable packaging sourcing capabilities to address the growing demand for hot food containers, cold beverage cups, and takeout packaging solutions.
From 2030 to 2035, the market is forecast to grow from USD 6.4 billion to USD 9.8 billion, adding another USD 3.4 billion, which constitutes 60.7% of the overall ten-year expansion. This period is expected to be characterized by the expansion of industrial composting infrastructure, the integration of advanced barrier coatings for grease and moisture resistance, and the development of molded fiber technologies with improved structural performance.
The growing adoption of zero-waste initiatives by foodservice chains will drive demand for compostable packaging with verified end-of-life pathways and certification compliance with international composting standards.
Between 2020 and 2025, the compostable foodservice packaging market experienced robust growth, driven by increasing regulatory pressure on conventional plastics and growing recognition of compostable packaging as essential alternatives for environmentally conscious foodservice operations across quick-service, casual dining, and institutional food delivery segments.
The market developed as operators recognized the potential for compostable materials to reduce waste management costs while meeting consumer expectations and enabling compliance with emerging plastic reduction mandates. Technological advancement in PLA (polylactic acid) formulations and bagasse fiber processing began emphasizing the critical importance of maintaining functional performance and cost competitiveness in commercial foodservice applications.
| Metric | Value |
|---|---|
| Estimated Value in (2025E) | USD 4.2 billion |
| Forecast Value in (2035F) | USD 9.8 billion |
| Forecast CAGR (2025 to 2035) | 8.8% |
Market expansion is being supported by the increasing global demand for environmentally responsible food packaging alternatives and the corresponding need for packaging solutions that can provide adequate functional performance while enabling organic waste diversion and circular economy participation across various foodservice and food delivery applications.
Modern quick-service restaurant operators and food delivery platforms are increasingly focused on implementing packaging solutions that can meet consumer expectations for environmental responsibility, maintain food safety standards, and provide convenient disposal options throughout extended supply chain requirements.
Compostable foodservice packaging's proven ability to deliver adequate protection for hot and cold foods, enable grease and moisture resistance, and support brand differentiation make them essential packaging formats for contemporary foodservice operations and premium restaurant concepts.
The growing emphasis on plastic waste reduction and circular economy principles is driving demand for compostable packaging that can support organic waste diversion programs, improve corporate environmental performance, and enable compliance with evolving regulatory frameworks.
Operators' preference for packaging that combines functional reliability with environmental benefits and consumer appeal is creating opportunities for innovative compostable packaging implementations. The rising influence of corporate social responsibility commitments and zero-waste facility initiatives is also contributing to increased demand for compostable packaging that can provide verified composting certification, material transparency, and end-of-life validation.
The compostable foodservice packaging market is poised for rapid growth and transformation. As foodservice operators across quick-service restaurants, casual dining, institutional catering, food delivery platforms, and event management seek packaging that delivers adequate functional performance, environmental responsibility, and consumer acceptance, compostable materials are gaining prominence not just as commodity packaging but as strategic enablers of waste reduction and brand positioning.
Rising foodservice consumption in North America and expanding regulatory frameworks globally amplify demand, while manufacturers are leveraging innovations in fiber-based materials, bio-based polymer formulations, and functional coating technologies.
Pathways like premium hot food containers, certified compostable cutlery, and application-specific customization promise strong margin uplift, especially in high-value segments. Geographic expansion and infrastructure development will capture volume, particularly where industrial composting facilities and collection programs are established. Regulatory pressures around plastic waste reduction, single-use item restrictions, foodservice packaging mandates, and extended producer responsibility give structural support.
The market is segmented by material type, product type, end-use, capacity, certification, and region. By material type, the market is divided into fiber-based (bagasse, molded pulp, bamboo), bio-based plastics (PLA, PHA, starch blends), and others. By product type, it covers cups & lids, plates & bowls, clamshells & containers, cutlery & utensils, and others.
By end-use, the market is segmented into quick-service restaurants, full-service restaurants, institutional catering, food delivery & takeout, and others. By capacity, the market includes small (below 12 oz), medium (12-32 oz), and large (above 32 oz). The certification type includes BPI certified, TÜV Austria certified, and others. By distribution channel, the market includes direct sales, distributors, and foodservice suppliers. Regionally, the market is divided into North America, Europe, East Asia, South Asia & Pacific, Latin America, and the Middle East & Africa.
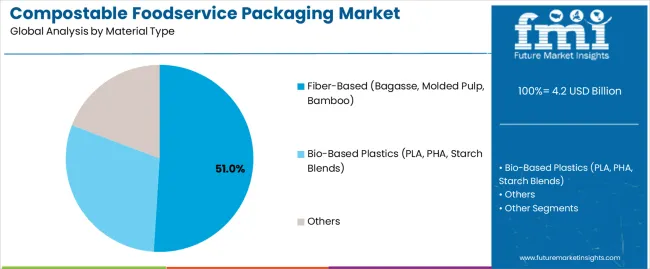
The fiber-based products segment is projected to account for 51% of the compostable foodservice packaging market in 2025, reaffirming its position as the leading material category. Quick-service restaurant operators and institutional catering providers increasingly utilize fiber-based packaging manufactured from bagasse, molded pulp, and bamboo for their adequate structural properties, proven compostability performance, and cost-effectiveness in applications ranging from hot food containers to cold beverage cups. Fiber-based packaging technology's established manufacturing infrastructure and consistent functional output directly address the operational requirements for reliable grease resistance and heat tolerance in high-volume foodservice environments.
This material segment forms the foundation of modern compostable packaging operations, as it represents the packaging type with the greatest manufacturing scale and established market acceptance across multiple end-use categories and geographic regions. Manufacturer investments in advanced coating technologies and molding precision capabilities continue to strengthen adoption among foodservice operators and institutional buyers. With companies prioritizing waste diversion and environmental performance, fiber-based compostable packaging aligns with both functional requirements and cost optimization objectives, making them the central component of comprehensive foodservice packaging strategies.
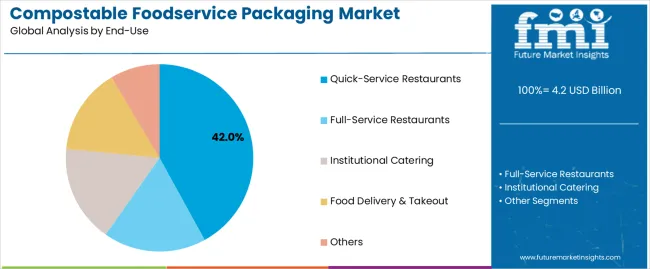
Quick-service restaurants are projected to represent 42% of compostable foodservice packaging demand in 2025, underscoring their critical role as the primary commercial consumers of certified compostable packaging for hot food delivery, cold beverage service, and takeout applications. Quick-service operators prefer compostable packaging for their alignment with consumer environmental expectations, regulatory compliance capabilities, and ability to support corporate responsibility commitments while ensuring adequate food safety and functional performance. Positioned as essential packaging formats for modern quick-service operations, compostable materials offer both environmental benefits and brand differentiation advantages.
The segment is supported by continuous innovation in functional coating technologies and the growing availability of certified products that enable industrial composting compatibility with enhanced grease resistance and structural integrity. Additionally, quick-service operators are investing in supplier partnerships to support large-volume procurement and certification verification. As zero-waste initiatives become more prevalent and regulatory pressures increase, quick-service restaurant applications will continue to dominate the end-use market while supporting advanced material development and infrastructure expansion strategies.
The compostable foodservice packaging market is advancing rapidly due to increasing regulatory restrictions on single-use plastics and growing adoption of compostable alternatives that provide adequate functional performance while enabling organic waste diversion and circular economy participation across diverse foodservice and food delivery applications.
However, the market faces challenges, including limited industrial composting infrastructure availability, higher material costs compared to conventional plastics, and the need for consumer education on proper disposal methods. Innovation in bio-based polymer formulations and functional barrier coatings continues to influence product development and market expansion patterns.
The growing development of municipal composting facilities, commercial composting operations, and integrated organic waste collection systems is enabling foodservice operators to implement compostable packaging programs with verified end-of-life pathways, reduced contamination rates, and validated waste diversion outcomes.
Advanced composting infrastructure provides improved processing capabilities while allowing more efficient organic waste recovery and consistent output across various geographic markets and regulatory frameworks. Operators are increasingly recognizing the competitive advantages of comprehensive composting infrastructure for program success and environmental performance validation.
Modern compostable packaging manufacturers are incorporating water-based barrier coatings, bio-based wax alternatives, and functional surface treatments to enhance grease resistance, moisture protection, and heat tolerance capabilities while maintaining compostability certification and biodegradation performance.
These technologies improve functional reliability while enabling new application segments, including hot food containers, liquid-holding products, and grease-intensive food packaging. Advanced coating integration also allows manufacturers to support premium product positioning and application development beyond traditional commodity packaging supply.
| Country | CAGR (2025-2035) |
|---|---|
| United States | 9.2% |
| Germany | 8.9% |
| France | 9.5% |
| China | 8.3% |
| United Kingdom | 8.6% |
| Canada | 9.0% |
| Netherlands | 9.7% |
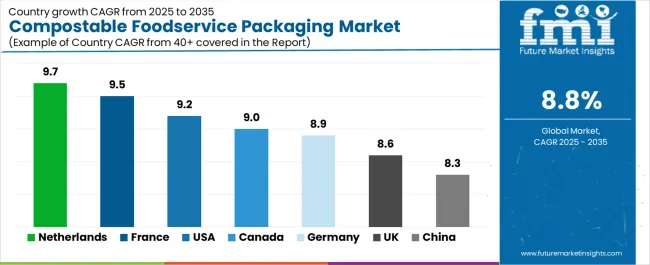
The compostable foodservice packaging market is experiencing strong growth globally, with the Netherlands leading at a 9.7% CAGR through 2035, driven by comprehensive regulatory frameworks supporting circular economy initiatives, advanced industrial composting infrastructure, and significant investment in organic waste collection systems.
France follows at 9.5%, supported by strict plastic packaging regulations, growing foodservice adoption, and expanding municipal composting capabilities. The USA shows growth at 9.2%, emphasizing state-level plastic reduction mandates and quick-service restaurant adoption. Canada records 9.0%, focusing on federal single-use plastic bans and provincial composting infrastructure development.
Germany demonstrates 8.9% growth, prioritizing packaging waste regulations and advanced composting technology excellence. The United Kingdom exhibits 8.6% growth, emphasizing plastic packaging tax implementation and foodservice industry transitions. China shows 8.3% growth, supported by expanding foodservice consumption and emerging regulatory frameworks.
The report covers an in-depth analysis of 40+ countries top-performing countries are highlighted below.
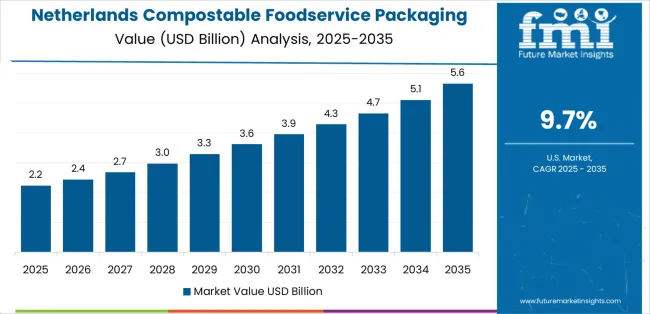
Revenue from compostable foodservice packaging in the Netherlands is projected to exhibit exceptional growth with a CAGR of 9.7% through 2035, driven by comprehensive circular economy policies and advanced industrial composting infrastructure supported by government initiatives promoting organic waste diversion. The country's strong position in European environmental leadership and increasing investment in composting technology are creating substantial demand for certified compostable packaging solutions. Major foodservice operators and packaging distributors are establishing comprehensive compostable packaging programs to serve both domestic demand and export markets.
Revenue from compostable foodservice packaging in France is expanding at a CAGR of 9.5%, supported by the country's strict single-use plastic regulations, expanding foodservice sector, and increasing adoption of certified compostable alternatives. The country's government initiatives prohibiting conventional plastic foodservice items and growing consumer environmental awareness are driving requirements for sophisticated compostable packaging capabilities. International suppliers and domestic manufacturers are establishing extensive production and distribution capabilities to address the growing demand for compliant packaging products.
Revenue from compostable foodservice packaging in the USA is expanding at a CAGR of 9.2%, supported by the country's growing state-level plastic reduction mandates, strong quick-service restaurant adoption, and robust demand for certified compostable alternatives in foodservice and food delivery applications. The nation's diverse regulatory landscape and high-volume foodservice sector are driving sophisticated compostable packaging capabilities throughout the supply chain. Leading manufacturers and foodservice distributors are investing extensively in certified products and composting partnerships to serve both compliant markets and voluntary adopters.
Revenue from compostable foodservice packaging in Canada is growing at a CAGR of 9.0%, driven by the country's federal single-use plastic prohibition, expanding provincial composting infrastructure, and growing investment in organic waste diversion programs. Canada's commitment to plastic waste reduction and provincial leadership in composting development are supporting demand for certified compostable packaging solutions across multiple foodservice segments. Operators are establishing comprehensive procurement programs to serve the large domestic market and comply with evolving regulatory requirements.
Revenue from compostable foodservice packaging in Germany is expanding at a CAGR of 8.9%, supported by the country's packaging waste regulations, advanced composting technology capabilities, and strategic focus on circular economy implementation. Germany's engineering excellence and environmental leadership are driving demand for compostable packaging in quick-service restaurants, institutional catering, and event management applications. Manufacturers are investing in comprehensive certification compliance capabilities to serve both domestic operators and international specialty markets.
Revenue from compostable foodservice packaging in the United Kingdom is growing at a CAGR of 8.6%, driven by the country's plastic packaging tax implementation, emphasis on extended producer responsibility, and strong position in foodservice innovation. The UK's established foodservice sector and commitment to plastic waste reduction are supporting investment in compostable packaging technologies throughout major urban centers. Industry leaders are establishing comprehensive sourcing programs to serve domestic quick-service operators and institutional food providers.
Revenue from compostable foodservice packaging in China is expanding at a CAGR of 8.3%, supported by the country's rapid foodservice consumption growth, expanding food delivery platforms, and emerging regulatory frameworks addressing plastic waste. China's large market scale and growing middle-class consumer base are driving demand for compostable packaging in quick-service restaurants, institutional catering, and delivery applications. Leading manufacturers are investing in localized production capabilities to serve the domestic market and support growing environmental awareness initiatives.
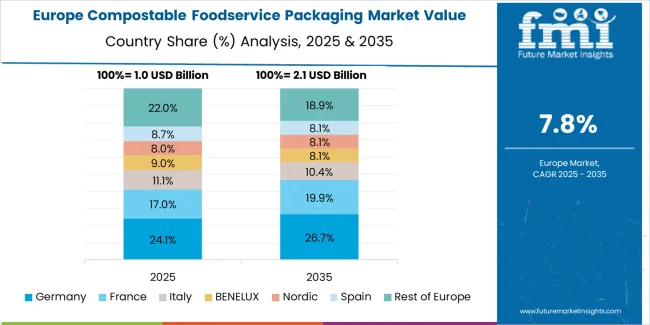
The compostable foodservice packaging market in Europe is projected to grow from USD 1.3 billion in 2025 to USD 3.1 billion by 2035, registering a CAGR of 9.1% over the forecast period. Germany is expected to maintain its leadership position with a 26.0% market share in 2025, growing slightly to 26.5% by 2035, supported by its strong regulatory frameworks, advanced composting infrastructure capabilities, and comprehensive foodservice sector serving diverse compostable packaging applications across Europe.
France follows with a 24.0% share in 2025, projected to reach 25.0% by 2035, driven by robust demand for compostable packaging in quick-service restaurants, institutional catering, and food delivery applications, combined with strict single-use plastic regulations and certified packaging requirements. The United Kingdom holds a 17.0% share in 2025, expected to reach 16.5% by 2035, supported by plastic packaging tax implementation and growing foodservice adoption activities. The Netherlands commands a 12.0% share in 2025, projected to reach 12.5% by 2035, while Italy accounts for 9.0% in 2025, expected to reach 8.8% by 2035.
Spain maintains a 5.0% share in 2025, growing to 5.2% by 2035. The Rest of Europe region, including Nordic countries, Eastern Europe, Belgium, Switzerland, Austria, and Poland, is anticipated to gain momentum, expanding its collective share from 7.0% to 5.5% by 2035, attributed to increasing regulatory harmonization in Eastern Europe and growing composting infrastructure development in Nordic countries implementing advanced organic waste programs.
The compostable foodservice packaging market is characterized by competition among established packaging manufacturers, specialized compostable products converters, and integrated foodservice packaging solutions providers. Companies are investing in bio-based polymer research, fiber processing optimization, barrier coating development, and comprehensive product portfolios to deliver consistent, certified, and application-specific compostable packaging solutions. Innovation in molded fiber technologies, functional coatings, and certification compliance is central to strengthening market position and competitive advantage.
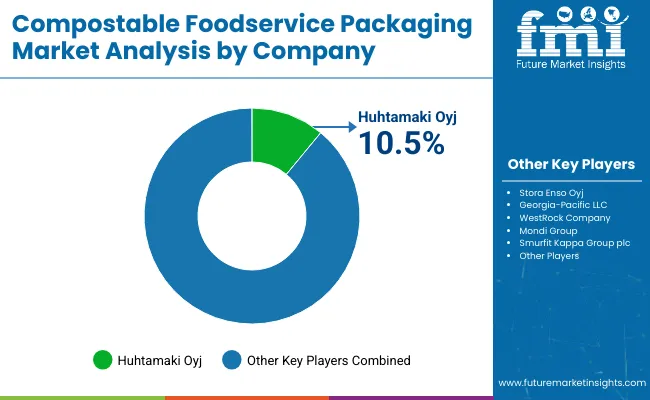
Huhtamaki Oyj leads the market with a strong market share, offering comprehensive fiber-based and bio-based compostable packaging solutions with a focus on quick-service restaurant and institutional catering applications. Dart Container Corporation provides specialized molded fiber capabilities with an emphasis on hot food containers and beverage cups.
Vegware Ltd delivers innovative compostable products with a focus on comprehensive foodservice solutions and certification compliance. BioPak specializes in certified compostable packaging and composting infrastructure partnerships for foodservice markets. Eco-Products Inc. focuses on compostable cutlery and container solutions with verified certification credentials. World Centric offers specialized compostable serviceware with emphasis on fair trade practices and social responsibility integration.
| Items | Values |
|---|---|
| Quantitative Units (2025) | USD 4.2 billion |
| Material Type | Fiber-Based (Bagasse, Molded Pulp, Bamboo), Bio-Based Plastics (PLA, PHA, Starch Blends), Others |
| Product Type | Cups & Lids, Plates & Bowls, Clamshells & Containers, Cutlery & Utensils, Others |
| End-Use | Quick-Service Restaurants, Full-Service Restaurants, Institutional Catering, Food Delivery & Takeout, Others |
| Capacity | Small (Below 12 oz), Medium (12-32 oz), Large (Above 32 oz) |
| Certification Type | BPI Certified, TÜV Austria Certified, Others |
| Distribution Channel | Direct Sales, Distributors, Foodservice Suppliers |
| Regions Covered | North America, Europe, East Asia, South Asia & Pacific, Latin America, Middle East & Africa |
| Countries Covered | United States, Canada, United Kingdom, Germany, France, China, Japan, South Korea, India, Brazil, Australia and 40+ countries |
| Key Companies Profiled | Huhtamaki Oyj, Dart Container, Vegware, BioPak, Eco-Products, and World Centric |
| Additional Attributes | Dollar sales by material type and product category, regional demand trends, competitive landscape, technological advancements in fiber processing, barrier coating development, certification compliance, and composting infrastructure integration |
The global compostable foodservice packaging market is estimated to be valued at USD 4.2 billion in 2025.
The market size for the compostable foodservice packaging market is projected to reach USD 9.8 billion by 2035.
The compostable foodservice packaging market is expected to grow at a 8.8% CAGR between 2025 and 2035.
The key product types in compostable foodservice packaging market are fiber-based (bagasse, molded pulp, bamboo), bio-based plastics (pla, pha, starch blends) and others.
In terms of end-use, quick-service restaurants segment to command 42.0% share in the compostable foodservice packaging market in 2025.


Full Research Suite comprises of:
Market outlook & trends analysis
Interviews & case studies
Strategic recommendations
Vendor profiles & capabilities analysis
5-year forecasts
8 regions and 60+ country-level data splits
Market segment data splits
12 months of continuous data updates
DELIVERED AS:
PDF EXCEL ONLINE
Market Share Insights of Compostable Foodservice Packaging Providers
Compostable Adhesives Market Analysis - Size and Share Forecast Outlook 2025 to 2035
Compostable Tableware Market Size and Share Forecast Outlook 2025 to 2035
Compostable Straws Market Growth - Demand & Forecast 2025 to 2035
Compostable Food Trays Market Size and Share Forecast Outlook 2025 to 2035
Compostable Toothbrush Market Growth & Forecast 2025 to 2035
Market Positioning & Share in the Compostable Food Trays Industry
Leading Providers & Market Share in the Compostable Toothbrush Industry
Global Compostable & Biodegradable Refuse Bags Market Insights – Trends, Demand & Growth 2025–2035
Market Share Distribution Among Compostable Refuse Bag Manufacturers
Compostable Mailer Market Growth & Trends Forecast 2024-2034
Compostable Pouch Market Insights – Growth & Forecast 2024-2034
Compostable Packaging Equipment Market Size and Share Forecast Outlook 2025 to 2035
Compostable Packaging Films Market Size and Share Forecast Outlook 2025 to 2035
Competitive Overview of Compostable Packaging Companies
Compostable Plastic Packaging Material Market from 2025 to 2035
UK Compostable Toothbrush Market Report – Key Trends & Growth Forecast 2025-2035
India Compostable Toothbrush Market Report – Key Trends & Growth Forecast 2025-2035
France Compostable Toothbrush Market Report – Key Trends & Growth Forecast 2025-2035
Hinged Lid Compostable Container Market

Thank you!
You will receive an email from our Business Development Manager. Please be sure to check your SPAM/JUNK folder too.
Chat With
MaRIA