Paper Cups Market
Key Players across Japan, Korea, the United States, Germany, the United Kingdom, & 30+ Countries Strive to Perk up One’s Coffee Game with Recyclable Paper Cups! Know More in FMI’s Report!
Paper Cups Market by Cup Capacity, Cup Type, Sales Channel, End User & Region | Forecast 2023 to 2033
Paper Cups Market Outlook (2023 to 2033)
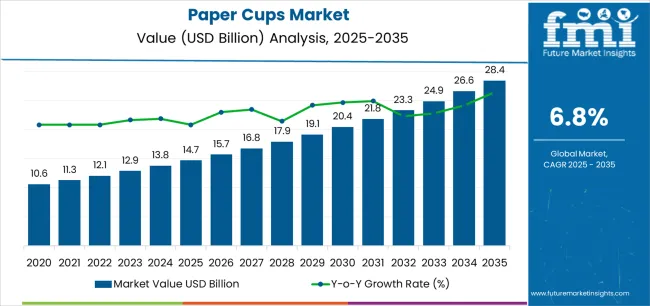
The global paper cups market is expected to reach US$ 10 billion in 2023 and is likely to record a CAGR of 4.4% between 2023 and 2033. The market is projected to reach a valuation of US$ 14 billion by 2033.
The market is expected to showcase a positive growth rate throughout the evaluation period. A report published by Future Market Insights anticipates that paper cup sales are expected to increase between 2023 and 2033.
The hot beverage cups segment is projected to lead the global market with a high preference for tea and coffee, as well as changing lifestyles of millennials. The paper cups industry is estimated to create an absolute dollar opportunity of US$ 4 billion from 2023 to 2033.
Major Growth Drivers Offering a Wide Range of Opportunities for Paper Cup Manufacturers:
- Paper cups and paper tea cups are gaining high popularity among all end-use industries. The primary factor, from the perspective of both customers and manufacturers, is the use of biodegradable materials in the creation of cups such as paper coffee cups, paper tea cups, cupcake paper cups, paper baking cups, paper ice cream cups, and others.
- Compared to cups made of other materials, these paper cups are thought to be far more practical to use. They are single-use, and following usage, disposal is simple. Throughout the evaluation period, it is expected that demand for paper cups will increase by 1.4 times its current level.
- As more people become aware of the many environmental issues, the trend towards using biodegradable and eco-friendly products is expanding globally. It is now commonplace to see that consumers like paper cups significantly more than those made of plastic, especially paper coffee cups and paper tea cups.
- Due to the growing popularity of these containers, cafeterias, quick-service restaurants, and hotels are expected to utilize paper ice cream cups, paper coffee cups, paper tea cups, cupcake paper cups, and paper baking cups. Another important reason that is expected to increase demand for paper cups in the next ten years is a busy and chaotic lifestyle.
Attributes |
Key Insights |
Paper Cups Market Estimated Size (2023E) |
US$ 10 billion |
Projected Market Valuation (2033F) |
US$ 14 billion |
Value-based CAGR (2023 to 2033) |
4.4% |
Collective Value Share: Top 5 Companies (2022E) |
20% to 25% |
Don't pay for what you don't need
Customize your report by selecting specific countries or regions and save 30%!
Comparison of the Historical Outlook (2018 to 2022) with the Forecast Period (2023 to 2033)
The global paper cups market witnessed a CAGR of 4.0% during the historical period from 2018 to 2022. It reached a market valuation of US$ 6.9 billion in 2018 and reached US$ 9.6 billion in 2022, in comparison with the current forecast period which is expected to reach US$ 10 billion in 2023 and is projected to reach a valuation of US$ 14 billion by 2033.
Paper cups like paper baking cups and paper ice cream cups, etc. are disposable cups that are made up of paper and coated with plastic or wax material to avoid leakages. Paper cups are considered to be environmentally friendly alternatives for plastic cups that are used in restaurants and food service applications.
Depending on the volume and temperature of the liquid to be transported, paper cups are offered. Manufacturers are continually concentrating on developing biodegradable materials and disposable materials due to shifting government regulations and a prohibition on plastic materials.
Paper cups are available for both uses, including hot and cold beverage cups. They are obtainable in the form of different capacities as they are large in size, and are used for drinking juices and other beverages. On the other hand, paper coffee cups and paper tea cups are frequently used for small cups.
H1-H2 Update
Market Statistics |
Details |
Jan to Jun (H1), 2021 (A) |
4.2% |
July to Dec (H2), 2021 (A) |
4.7% |
Jan to Jun (H1),2022 Projected (P) |
4.4% |
Jan to Jun (H1),2022 Outlook (O) |
4.8% |
July to Dec (H2), 2022 Outlook (O) |
5.1% |
July to Dec (H2), 2022 Projected (P) |
4.9% |
Jan to Jun (H1), 2023 Projected (P) |
4.5% |
BPS Change : H1,2022 (O) - H1,2022 (P) |
60 ↑ |
BPS Change : H1,2022 (O) - H1,2021 (A) |
40 ↑ |
BPS Change: H2, 2022 (O) - H2, 2022 (P) |
20 ↑ |
BPS Change: H2, 2022 (O) - H2, 2022 (A) |
20 ↑ |
Find your sweet spots for generating winning opportunities in this market.
Talk to AnalystTop Trends Fueling Sales of the Paper Cups Market across the Globe
- Installation of Vending Machines at Numerous Locations to Propel Sales of Paper Cups
It is tough and nearly impossible for retailers and brand owners to have a corporal store in every place that generates high demand for beverages. One of the most commonly used methods adopted by brand owners to solve this problem is vending machines. The popularity of vending machines is hence increasing the sales of paper cups, as during the process, disposable cups are required. In public places, there is less possibility of cleaning these cups and reusing them to avoid the adoption of single-use paper cups.
Since vending machines are gradually becoming technologically advanced in terms of user experience, they are expected to gain high traction in numerous regions such as North America, Europe, and Asia Pacific. The introduction of smart interaction options in new systems has effectively increased consumer trust.
Manufacturers of different paper cups, such as paper tea cups, paper coffee cups, and cupcake paper cups, are aware of this transition and are currently focusing on enhancing their production infrastructure and capacity to meet the burgeoning demand. Focus on easy and convenient drinking methods will primarily boost the market for paper cups in the next ten years.
Comparative View of Adjacent Paper Cups Market
Paper Cups Market:
Attributes |
Paper Cups Market |
CAGR (2023 to 2033) |
4.4% |
Market Value (2023) |
US$ 10 billion |
Growth Factor |
The increasing need to replace plastic with other materials has led to the development of paper-based packaging, including paper cups, and edible cups made from grains. |
Key Trend |
Increasing consumption of beverages and fast food due to busy lifestyles in developed countries has led to the emergence of new coffee shops and fast-serving restaurants. |
Paper Cone Cup Market:
Attributes |
Paper Cone Cup Market |
CAGR (2023 to 2033) |
4.75% |
Market Value (2023) |
US$ 2.2 billion |
Growth Factor |
Increasing demand for paper cone cups from recreational parks, theaters, and malls would propel sales. |
Key Trend |
The rising development of water coolers and vending machines for installation in offices, schools, and colleges would drive demand. |
Volumetric Cup Fillers Market:
Attributes |
Volumetric Cup Fillers Market |
CAGR (2023 to 2033) |
4% |
Market Value (2023) |
US$ 6,980.3 million |
Growth Factor |
Increasing focus of key players on the development of sustainable packaging solutions with high demand for numerous industries such as cosmetics would accelerate demand. |
Key Trend |
Ability of volumetric cup fillers to prevent human contamination in the food industry by offering high-quality food items would aid demand. |
Get the data you need at a Fraction of the cost
Personalize your report by choosing insights you need
and save 40%!
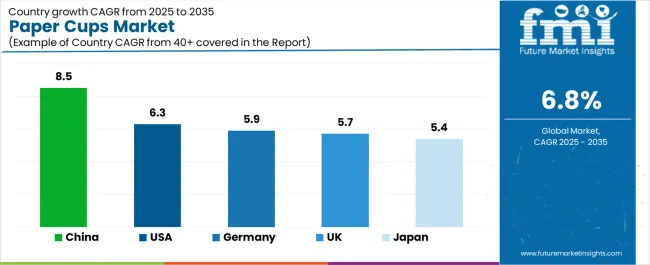
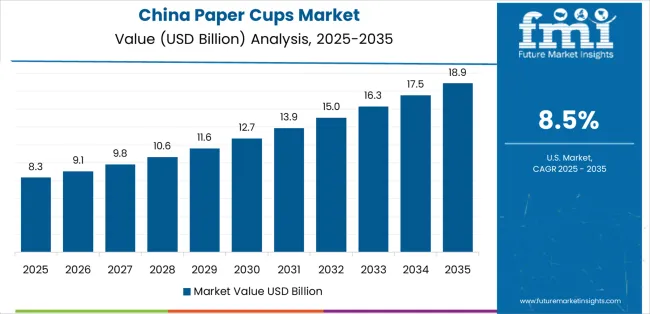
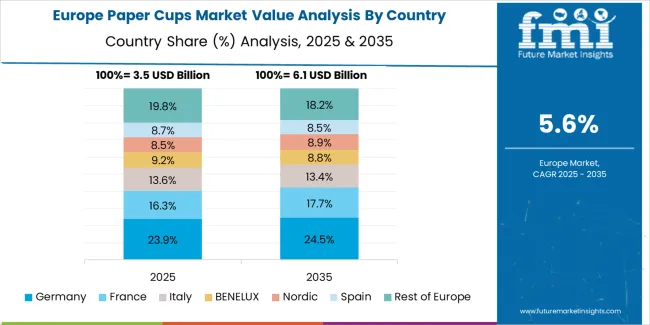
Country-wise Insights
Country |
China |
Market Share (2023) |
11.1% |
Market Share (2033) |
11.5% |
Basis Points (BPS) Analysis |
350 |
Country |
India |
Market Share (2023) |
5.2% |
Market Share (2033) |
6.4% |
Basis Points (BPS) Analysis |
120 |
Country |
Germany |
Market Share (2023) |
7.0% |
Market Share (2033) |
7.2% |
Basis Points (BPS) Analysis |
20 |
Country |
United Kingdom |
Market Share (2023) |
5.6% |
Market Share (2033) |
6.1% |
Basis Points (BPS) Analysis |
50 |
Country |
United States |
Market Share (2023) |
31.1% |
Market Share (2033) |
29.0% |
Basis Points (BPS) Analysis |
-210 |
How Increased Consumption of Coffee in the United Kingdom is Augmenting Sales of Paper Cups?
Requirements of Sturdy Coffee Packaging to Propel Demand for Custom Paper Cups
The United Kingdom is projected to create an incremental growth opportunity of US$ 20 million during the forecast period. Increasing consumption of coffee, which is considered to be one of the most popular beverages in the country, is projected to drive sales of paper cups. As per data provided by the British Coffee Association in 2021, the consumption of coffee per day in the United Kingdom is 98 million cups each day, whereas the average cup of coffee consumed in the country is 76%.
Coffee consumption is eventually expected to impact the global market for paper cups as the beverage is served either in small units or through vending machines. Paper cups are required to serve and drink coffee. This is likely to propel the rate of coffee consumption, thereby pushing sales in the United Kingdom.
Why is India Showcasing Burgeoning Demand for Paper Cups?
Expansion of Paper Manufacturing Companies in India to Propel Demand for Custom Paper Coffee Cups
During the forecast period, India is expected to generate an absolute dollar opportunity of US$ 40 million. India's paper industry is growing as a result of the low cost of its raw resources. With economic growth, a significant increase in paper consumption is projected.
The paper industry in India produced about 5% of the world's paper in 2021, according to figures from the Indian Paper Manufacturers Association (IPMA). In the next ten years, it is anticipated that the country's growing paper sector will dominate the paper cup industry.
Category-wise Insights
Which is the Highly Preferred Type of Paper Cups across the Globe?
Increasing Demand for Tea and Coffee to Push Sales of Disposable Cups for Hot Drinks
Hot beverage cups are mainly preferred by restaurants, cafés, and hotels as these are double-lined walled cups that maintain the temperature and heat-bearing properties. Consumption of tea and coffee is supplementary, as compared to cold beverages. The targeted segment is predicted to hold around 64.7% of the market share by 2023.
For ease of consumption, hot drinks require cups with efficient features and heat-insulating qualities. By producing hotter beverage cups, the overall consumption of hot beverages will have a greater impact on the production rate than the overall consumption of cold beverages. The global paper cup market is anticipated to benefit from this lucrative growth opportunity.
Who is the Leading End User of Paper Cups across the Globe?
Use of Paper Coffee Cups with Lids to Skyrocket as Sales among Food Service Outlets Gain Traction
As per Future Market Insights, the food service segment is expected to record a CAGR of 4.6% during the forecast period. Manufacturers are concentrating on expanding their ranges of paper cups to fulfill high demand from on-the-go consumers.
They are also focusing on making unique designs to enable optimal consumer convenience. Online food service platforms are gaining the attention of consumers, and food services are hence providing single-use cups, bowls, and plates for use.
There is improved production of to-go paper cups, especially for beverages such as coffee. In terms of sales, Starbucks, Subway, McDonald’s, Burger King, and Taco Bell are the leading five quick service restaurants.
McDonald’s is considered to be a leader in terms of brand value that adapts the use of paper cups and other products. McDonald’s reported that 71% of its packaging is made from paper and Starbucks reported that 47% of its packaging is fiber-based. The idea is to ensure a high degree of consumer convenience in line with the needs of modern consumers, which will positively drive the paper cups market.
Competitive Landscape
Operating players in the global paper cups market are expanding their supply chains across several regions, and most of these companies are headquartered in North America and Europe. Global players are focusing on developing sustainable and eco-friendly materials. A few players are concentrating on upgrading their facilities to cater to the surging demand.
A few of the Recent Developments by Leading Players in the Market are:
- In December 2022, Huhtamaki Oyj & Stora Enso launched its advanced Europe paper cup recycling program that includes used paper cups through various partners such as McDonald’s, The Food travel expert, and Nation Railway Company.
- In November 2022, Huhtamaki Oyj launched ICON packaging, which is highly efficient for ice cream packaging. The material used for this packaging is 95% bio-based with Sustainable Forestry Initiative (SFI) certified Paperboard.
- In May 2022, Berry Global Group Inc. developed its innovative new cup made with post-consumer recycled plastic.
Scope of the Report
Attribute |
Details |
Estimated Market Size (2023) |
US$ 10 billion |
Projected Market Valuation (2033) |
US$ 14 billion |
Value-based CAGR (2023 to 2033) |
4.4% |
Historical Data |
2018 to 2022 |
Forecast Period |
2023 to 2033 |
Quantitative Units |
Revenue (US$ billion) |
Segment Covered |
|
Regions Covered |
|
Key Countries Profiled |
|
Key Companies Profiled |
|
Report Coverage |
Revenue Forecast, Volume Forecast, Company Ranking, Competitive Landscape, Growth Factors, Trends, and Pricing Analysis |
The Paper Cups Market Outlook by Category
By Cup Capacity:
- Up to 150 ml
- 151 to 350 ml
- 351 to 500 ml
- Above 500 ml
By Cup Type:
- Cold Beverage Cup
- Hot Beverage Cup
By Sales Channel:
- Supermarket/Hypermarket
- Distributor
- Departmental/Specialty/Discount Stores
- Online Sales
By End User:
- Food Service
- Institutional
- Household
By Region:
- North America
- Latin America
- Western Europe
- Eastern Europe
- Asia Pacific
- Middle East and Africa
Frequently Asked Questions
What was the Worth of the Global Paper Cups Industry in 2023?
The global paper cups market is expected to hold a valuation of US$ 10 billion
At What Rate is the Global Paper Cups Industry Anticipated to Expand from 2023 to 2033?
The paper cups market is expected to record a CAGR of 4.4% from 2023 to 2033.
What will be the Value of the Global Paper Cups Industry by 2033?
The global paper cups market is expected to surpass US$ 14 billion by 2033.
Who are the Top 3 End-Use Industries in the Global Paper Cups Industry?
Foodservice, institutional, and household are the top 3 end-use industries.
Which Factors are Set to Drive the Demand for Paper Cups?
Fast food and beverage consumption is anticipated to be the key factors driving the growth of the market.
Who are the Top 5 Players in the Paper Cups Industry?
Starbucks, Subway, McDonald’s, Burger King, and Taco Bell are the top 5 players in the paper cups industry
At What Rate is the Paper Cups Industry in Germany Projected to Expand by 2033?
The market in Germany is projected to record a CAGR of 7.2% by 2033
Table of Content
1. Executive Summary | Paper Cups Market 1.1. Global Market Outlook 1.2. Demand-side Trends 1.3. Supply-side Trends 1.4. Technology Roadmap Analysis 1.5. Analysis and Recommendations 2. Market Overview 2.1. Market Coverage / Taxonomy 2.2. Market Definition / Scope / Limitations 3. Market Background 3.1. Market Dynamics 3.1.1. Drivers 3.1.2. Restraints 3.1.3. Opportunity 3.1.4. Trends 3.2. Scenario Forecast 3.2.1. Demand in Optimistic Scenario 3.2.2. Demand in Likely Scenario 3.2.3. Demand in Conservative Scenario 3.3. Opportunity Map Analysis 3.4. Product Life Cycle Analysis 3.5. Supply Chain Analysis 3.5.1. Supply Side Participants and their Roles 3.5.1.1. Producers 3.5.1.2. Mid-Level Participants (Traders/ Agents/ Brokers) 3.5.1.3. Wholesalers and Distributors 3.5.2. Value Added and Value Created at Node in the Supply Chain 3.5.3. List of Raw Material Suppliers 3.5.4. List of Existing and Potential Buyer’s 3.6. Investment Feasibility Matrix 3.7. Value Chain Analysis 3.7.1. Profit Margin Analysis 3.7.2. Wholesalers and Distributors 3.7.3. Retailers 3.8. PESTLE and Porter’s Analysis 3.9. Regulatory Landscape 3.9.1. By Key Regions 3.9.2. By Key Countries 3.10. Regional Parent Market Outlook 3.11. Production and Consumption Statistics 3.12. Import and Export Statistics 4. Global Market Analysis 2017 to 2022 and Forecast, 2023 to 2033 4.1. Historical Market Size Value (US$ Million) & Volume (Units) Analysis, 2017 to 2022 4.2. Current and Future Market Size Value (US$ Million) & Volume (Units) Projections, 2023 to 2033 4.2.1. Y-o-Y Growth Trend Analysis 4.2.2. Absolute $ Opportunity Analysis 5. Global Market Analysis 2017 to 2022 and Forecast 2023 to 2033, By Cup Capacity 5.1. Introduction / Key Findings 5.2. Historical Market Size Value (US$ Million) & Volume (Units) Analysis By Cup Capacity, 2017 to 2022 5.3. Current and Future Market Size Value (US$ Million) & Volume (Units) Analysis and Forecast By Cup Capacity, 2023 to 2033 5.3.1. Up to 150 ml 5.3.2. 151 to 350 ml 5.3.3. 351 to 500 ml 5.3.4. Above 500 ml 5.4. Y-o-Y Growth Trend Analysis By Cup Capacity, 2017 to 2022 5.5. Absolute $ Opportunity Analysis By Cup Capacity, 2023 to 2033 6. Global Market Analysis 2017 to 2022 and Forecast 2023 to 2033, By Cup Type 6.1. Introduction / Key Findings 6.2. Historical Market Size Value (US$ Million) & Volume (Units) Analysis By Cup Type, 2017 to 2022 6.3. Current and Future Market Size Value (US$ Million) & Volume (Units) Analysis and Forecast By Cup Type, 2023 to 2033 6.3.1. Cold Beverage Cup 6.3.2. Hot Beverage Cup 6.4. Y-o-Y Growth Trend Analysis By Cup Type, 2017 to 2022 6.5. Absolute $ Opportunity Analysis By Cup Type, 2023 to 2033 7. Global Market Analysis 2017 to 2022 and Forecast 2023 to 2033, By Sales Channel 7.1. Introduction / Key Findings 7.2. Historical Market Size Value (US$ Million) & Volume (Units) Analysis By Sales Channel, 2017 to 2022 7.3. Current and Future Market Size Value (US$ Million) & Volume (Units) Analysis and Forecast By Sales Channel, 2023 to 2033 7.3.1. Supermarket/Hypermarket 7.3.2. Distributor 7.3.3. Departmental/Specialty/Discount Stores 7.3.4. Online Sales 7.4. Y-o-Y Growth Trend Analysis By Sales Channel, 2017 to 2022 7.5. Absolute $ Opportunity Analysis By Sales Channel, 2023 to 2033 8. Global Market Analysis 2017 to 2022 and Forecast 2023 to 2033, By End-User 8.1. Introduction / Key Findings 8.2. Historical Market Size Value (US$ Million) & Volume (Units) Analysis By End-User, 2017 to 2022 8.3. Current and Future Market Size Value (US$ Million) & Volume (Units) Analysis and Forecast By End-User, 2023 to 2033 8.3.1. Food Service 8.3.2. Institutional 8.3.3. Household 8.4. Y-o-Y Growth Trend Analysis By End-User, 2017 to 2022 8.5. Absolute $ Opportunity Analysis By End-User, 2023 to 2033 9. Global Market Analysis 2017 to 2022 and Forecast 2023 to 2033, By Region 9.1. Introduction 9.2. Historical Market Size Value (US$ Million) & Volume (Units) Analysis By Region, 2017 to 2022 9.3. Current Market Size Value (US$ Million) & Volume (Units) Analysis and Forecast By Region, 2023 to 2033 9.3.1. North America 9.3.2. Latin America 9.3.3. Western Europe 9.3.4. Eastern Europe 9.3.5. Asia Pacific 9.3.6. Middle East and Africa 9.4. Market Attractiveness Analysis By Region 10. North America Market Analysis 2017 to 2022 and Forecast 2023 to 2033, By Country 10.1. Historical Market Size Value (US$ Million) & Volume (Units) Trend Analysis By Market Taxonomy, 2017 to 2022 10.2. Market Size Value (US$ Million) & Volume (Units) Forecast By Market Taxonomy, 2023 to 2033 10.2.1. By Country 10.2.1.1. USA 10.2.1.2. Canada 10.2.2. By Cup Capacity 10.2.3. By Cup Type 10.2.4. By Sales Channel 10.2.5. By End-User 10.3. Market Attractiveness Analysis 10.3.1. By Country 10.3.2. By Cup Capacity 10.3.3. By Cup Type 10.3.4. By Sales Channel 10.3.5. By End-User 10.4. Key Takeaways 11. Latin America Market Analysis 2017 to 2022 and Forecast 2023 to 2033, By Country 11.1. Historical Market Size Value (US$ Million) & Volume (Units) Trend Analysis By Market Taxonomy, 2017 to 2022 11.2. Market Size Value (US$ Million) & Volume (Units) Forecast By Market Taxonomy, 2023 to 2033 11.2.1. By Country 11.2.1.1. Brazil 11.2.1.2. Mexico 11.2.1.3. Rest of Latin America 11.2.2. By Cup Capacity 11.2.3. By Cup Type 11.2.4. By Sales Channel 11.2.5. By End-User 11.3. Market Attractiveness Analysis 11.3.1. By Country 11.3.2. By Cup Capacity 11.3.3. By Cup Type 11.3.4. By Sales Channel 11.3.5. By End-User 11.4. Key Takeaways 12. Western Europe Market Analysis 2017 to 2022 and Forecast 2023 to 2033, By Country 12.1. Historical Market Size Value (US$ Million) & Volume (Units) Trend Analysis By Market Taxonomy, 2017 to 2022 12.2. Market Size Value (US$ Million) & Volume (Units) Forecast By Market Taxonomy, 2023 to 2033 12.2.1. By Country 12.2.1.1. France 12.2.1.2. Germany 12.2.1.3. Italy 12.2.1.4. Spain 12.2.1.5. United Kingdom 12.2.1.6. Rest of Western Europe 12.2.2. By Cup Capacity 12.2.3. By Cup Type 12.2.4. By Sales Channel 12.2.5. By End-User 12.3. Market Attractiveness Analysis 12.3.1. By Country 12.3.2. By Cup Capacity 12.3.3. By Cup Type 12.3.4. By Sales Channel 12.3.5. By End-User 12.4. Key Takeaways 13. Eastern Europe Market Analysis 2017 to 2022 and Forecast 2023 to 2033, By Country 13.1. Historical Market Size Value (US$ Million) & Volume (Units) Trend Analysis By Market Taxonomy, 2017 to 2022 13.2. Market Size Value (US$ Million) & Volume (Units) Forecast By Market Taxonomy, 2023 to 2033 13.2.1. By Country 13.2.1.1. Poland 13.2.1.2. Russia 13.2.1.3. Rest of Eastern Europe 13.2.2. By Cup Capacity 13.2.3. By Cup Type 13.2.4. By Sales Channel 13.2.5. By End-User 13.3. Market Attractiveness Analysis 13.3.1. By Country 13.3.2. By Cup Capacity 13.3.3. By Cup Type 13.3.4. By Sales Channel 13.3.5. By End-User 13.4. Key Takeaways 14. Asia Pacific Market Analysis 2017 to 2022 and Forecast 2023 to 2033, By Country 14.1. Historical Market Size Value (US$ Million) & Volume (Units) Trend Analysis By Market Taxonomy, 2017 to 2022 14.2. Market Size Value (US$ Million) & Volume (Units) Forecast By Market Taxonomy, 2023 to 2033 14.2.1. By Country 14.2.1.1. ASEAN 14.2.1.2. Australia &New Zealand 14.2.1.3. China 14.2.1.4. India 14.2.1.5. Japan 14.2.1.6. Rest of Asia Pacific 14.2.2. By Cup Capacity 14.2.3. By Cup Type 14.2.4. By Sales Channel 14.2.5. By End-User 14.3. Market Attractiveness Analysis 14.3.1. By Country 14.3.2. By Cup Capacity 14.3.3. By Cup Type 14.3.4. By Sales Channel 14.3.5. By End-User 14.4. Key Takeaways 15. Middle East and Africa Market Analysis 2017 to 2022 and Forecast 2023 to 2033, By Country 15.1. Historical Market Size Value (US$ Million) & Volume (Units) Trend Analysis By Market Taxonomy, 2017 to 2022 15.2. Market Size Value (US$ Million) & Volume (Units) Forecast By Market Taxonomy, 2023 to 2033 15.2.1. By Country 15.2.1.1. GCC Countries 15.2.1.2. Northern Africa 15.2.1.3. South Africa 15.2.1.4. Türkiye 15.2.1.5. Rest of Middle East and Africa 15.2.2. By Cup Capacity 15.2.3. By Cup Type 15.2.4. By Sales Channel 15.2.5. By End-User 15.3. Market Attractiveness Analysis 15.3.1. By Country 15.3.2. By Cup Capacity 15.3.3. By Cup Type 15.3.4. By Sales Channel 15.3.5. By End-User 15.4. Key Takeaways 16. Key Countries Market Analysis 16.1. USA 16.1.1. Pricing Analysis 16.1.2. Market Share Analysis, 2022 16.1.2.1. By Cup Capacity 16.1.2.2. By Cup Type 16.1.2.3. By Sales Channel 16.1.2.4. By End-User 16.2. Canada 16.2.1. Pricing Analysis 16.2.2. Market Share Analysis, 2022 16.2.2.1. By Cup Capacity 16.2.2.2. By Cup Type 16.2.2.3. By Sales Channel 16.2.2.4. By End-User 16.3. Brazil 16.3.1. Pricing Analysis 16.3.2. Market Share Analysis, 2022 16.3.2.1. By Cup Capacity 16.3.2.2. By Cup Type 16.3.2.3. By Sales Channel 16.3.2.4. By End-User 16.4. Mexico 16.4.1. Pricing Analysis 16.4.2. Market Share Analysis, 2022 16.4.2.1. By Cup Capacity 16.4.2.2. By Cup Type 16.4.2.3. By Sales Channel 16.4.2.4. By End-User 16.5. France 16.5.1. Pricing Analysis 16.5.2. Market Share Analysis, 2022 16.5.2.1. By Cup Capacity 16.5.2.2. By Cup Type 16.5.2.3. By Sales Channel 16.5.2.4. By End-User 16.6. Germany 16.6.1. Pricing Analysis 16.6.2. Market Share Analysis, 2022 16.6.2.1. By Cup Capacity 16.6.2.2. By Cup Type 16.6.2.3. By Sales Channel 16.6.2.4. By End-User 16.7. Italy 16.7.1. Pricing Analysis 16.7.2. Market Share Analysis, 2022 16.7.2.1. By Cup Capacity 16.7.2.2. By Cup Type 16.7.2.3. By Sales Channel 16.7.2.4. By End-User 16.8. Spain 16.8.1. Pricing Analysis 16.8.2. Market Share Analysis, 2022 16.8.2.1. By Cup Capacity 16.8.2.2. By Cup Type 16.8.2.3. By Sales Channel 16.8.2.4. By End-User 16.9. United Kingdom 16.9.1. Pricing Analysis 16.9.2. Market Share Analysis, 2022 16.9.2.1. By Cup Capacity 16.9.2.2. By Cup Type 16.9.2.3. By Sales Channel 16.9.2.4. By End-User 16.10. Poland 16.10.1. Pricing Analysis 16.10.2. Market Share Analysis, 2022 16.10.2.1. By Cup Capacity 16.10.2.2. By Cup Type 16.10.2.3. By Sales Channel 16.10.2.4. By End-User 16.11. Russia 16.11.1. Pricing Analysis 16.11.2. Market Share Analysis, 2022 16.11.2.1. By Cup Capacity 16.11.2.2. By Cup Type 16.11.2.3. By Sales Channel 16.11.2.4. By End-User 16.12. ASEAN 16.12.1. Pricing Analysis 16.12.2. Market Share Analysis, 2022 16.12.2.1. By Cup Capacity 16.12.2.2. By Cup Type 16.12.2.3. By Sales Channel 16.12.2.4. By End-User 16.13. Australia &New Zealand 16.13.1. Pricing Analysis 16.13.2. Market Share Analysis, 2022 16.13.2.1. By Cup Capacity 16.13.2.2. By Cup Type 16.13.2.3. By Sales Channel 16.13.2.4. By End-User 16.14. China 16.14.1. Pricing Analysis 16.14.2. Market Share Analysis, 2022 16.14.2.1. By Cup Capacity 16.14.2.2. By Cup Type 16.14.2.3. By Sales Channel 16.14.2.4. By End-User 16.15. India 16.15.1. Pricing Analysis 16.15.2. Market Share Analysis, 2022 16.15.2.1. By Cup Capacity 16.15.2.2. By Cup Type 16.15.2.3. By Sales Channel 16.15.2.4. By End-User 16.16. Japan 16.16.1. Pricing Analysis 16.16.2. Market Share Analysis, 2022 16.16.2.1. By Cup Capacity 16.16.2.2. By Cup Type 16.16.2.3. By Sales Channel 16.16.2.4. By End-User 16.17. GCC Countries 16.17.1. Pricing Analysis 16.17.2. Market Share Analysis, 2022 16.17.2.1. By Cup Capacity 16.17.2.2. By Cup Type 16.17.2.3. By Sales Channel 16.17.2.4. By End-User 16.18. Northern Africa 16.18.1. Pricing Analysis 16.18.2. Market Share Analysis, 2022 16.18.2.1. By Cup Capacity 16.18.2.2. By Cup Type 16.18.2.3. By Sales Channel 16.18.2.4. By End-User 16.19. South Africa 16.19.1. Pricing Analysis 16.19.2. Market Share Analysis, 2022 16.19.2.1. By Cup Capacity 16.19.2.2. By Cup Type 16.19.2.3. By Sales Channel 16.19.2.4. By End-User 16.20. Türkiye 16.20.1. Pricing Analysis 16.20.2. Market Share Analysis, 2022 16.20.2.1. By Cup Capacity 16.20.2.2. By Cup Type 16.20.2.3. By Sales Channel 16.20.2.4. By End-User 17. Market Structure Analysis 17.1. Competition Dashboard 17.2. Competition Benchmarking 17.3. Market Share Analysis of Top Players 17.3.1. By Regional 17.3.2. By Cup Capacity 17.3.3. By Cup Type 17.3.4. By Sales Channel 17.3.5. By End-User 18. Competition Analysis 18.1. Competition Deep Dive 18.1.1. Berry Global Group, Inc. 18.1.1.1. Overview 18.1.1.2. Product Portfolio 18.1.1.3. Profitability by Market Segments 18.1.1.4. Sales Footprint 18.1.1.5. Strategy Overview 18.1.1.5.1. Marketing Strategy 18.1.1.5.2. Product Strategy 18.1.1.5.3. Channel Strategy 18.1.2. Hutamaki Oyj 18.1.2.1. Overview 18.1.2.2. Product Portfolio 18.1.2.3. Profitability by Market Segments 18.1.2.4. Sales Footprint 18.1.2.5. Strategy Overview 18.1.2.5.1. Marketing Strategy 18.1.2.5.2. Product Strategy 18.1.2.5.3. Channel Strategy 18.1.3. Georgia-Pacific LLC 18.1.3.1. Overview 18.1.3.2. Product Portfolio 18.1.3.3. Profitability by Market Segments 18.1.3.4. Sales Footprint 18.1.3.5. Strategy Overview 18.1.3.5.1. Marketing Strategy 18.1.3.5.2. Product Strategy 18.1.3.5.3. Channel Strategy 18.1.4. Genpak, LLC 18.1.4.1. Overview 18.1.4.2. Product Portfolio 18.1.4.3. Profitability by Market Segments 18.1.4.4. Sales Footprint 18.1.4.5. Strategy Overview 18.1.4.5.1. Marketing Strategy 18.1.4.5.2. Product Strategy 18.1.4.5.3. Channel Strategy 18.1.5. Pactiv LLC 18.1.5.1. Overview 18.1.5.2. Product Portfolio 18.1.5.3. Profitability by Market Segments 18.1.5.4. Sales Footprint 18.1.5.5. Strategy Overview 18.1.5.5.1. Marketing Strategy 18.1.5.5.2. Product Strategy 18.1.5.5.3. Channel Strategy 18.1.6. Dart Container Corporation 18.1.6.1. Overview 18.1.6.2. Product Portfolio 18.1.6.3. Profitability by Market Segments 18.1.6.4. Sales Footprint 18.1.6.5. Strategy Overview 18.1.6.5.1. Marketing Strategy 18.1.6.5.2. Product Strategy 18.1.6.5.3. Channel Strategy 18.1.7. Frugal Pac Corporation 18.1.7.1. Overview 18.1.7.2. Product Portfolio 18.1.7.3. Profitability by Market Segments 18.1.7.4. Sales Footprint 18.1.7.5. Strategy Overview 18.1.7.5.1. Marketing Strategy 18.1.7.5.2. Product Strategy 18.1.7.5.3. Channel Strategy 18.1.8. Grupo Phoenix Capital Limited 18.1.8.1. Overview 18.1.8.2. Product Portfolio 18.1.8.3. Profitability by Market Segments 18.1.8.4. Sales Footprint 18.1.8.5. Strategy Overview 18.1.8.5.1. Marketing Strategy 18.1.8.5.2. Product Strategy 18.1.8.5.3. Channel Strategy 18.1.9. F Bender Limited 18.1.9.1. Overview 18.1.9.2. Product Portfolio 18.1.9.3. Profitability by Market Segments 18.1.9.4. Sales Footprint 18.1.9.5. Strategy Overview 18.1.9.5.1. Marketing Strategy 18.1.9.5.2. Product Strategy 18.1.9.5.3. Channel Strategy 18.1.10. Conver Pack Inc. 18.1.10.1. Overview 18.1.10.2. Product Portfolio 18.1.10.3. Profitability by Market Segments 18.1.10.4. Sales Footprint 18.1.10.5. Strategy Overview 18.1.10.5.1. Marketing Strategy 18.1.10.5.2. Product Strategy 18.1.10.5.3. Channel Strategy 18.1.11. Stanpac Inc. 18.1.11.1. Overview 18.1.11.2. Product Portfolio 18.1.11.3. Profitability by Market Segments 18.1.11.4. Sales Footprint 18.1.11.5. Strategy Overview 18.1.11.5.1. Marketing Strategy 18.1.11.5.2. Product Strategy 18.1.11.5.3. Channel Strategy 18.1.12. Biopac UK Ltd. 18.1.12.1. Overview 18.1.12.2. Product Portfolio 18.1.12.3. Profitability by Market Segments 18.1.12.4. Sales Footprint 18.1.12.5. Strategy Overview 18.1.12.5.1. Marketing Strategy 18.1.12.5.2. Product Strategy 18.1.12.5.3. Channel Strategy 18.1.13. Bio Futurs B.V. 18.1.13.1. Overview 18.1.13.2. Product Portfolio 18.1.13.3. Profitability by Market Segments 18.1.13.4. Sales Footprint 18.1.13.5. Strategy Overview 18.1.13.5.1. Marketing Strategy 18.1.13.5.2. Product Strategy 18.1.13.5.3. Channel Strategy 18.1.14. Natural Tableware 18.1.14.1. Overview 18.1.14.2. Product Portfolio 18.1.14.3. Profitability by Market Segments 18.1.14.4. Sales Footprint 18.1.14.5. Strategy Overview 18.1.14.5.1. Marketing Strategy 18.1.14.5.2. Product Strategy 18.1.14.5.3. Channel Strategy 18.1.15. Ecoware Biodegradables Inc. 18.1.15.1. Overview 18.1.15.2. Product Portfolio 18.1.15.3. Profitability by Market Segments 18.1.15.4. Sales Footprint 18.1.15.5. Strategy Overview 18.1.15.5.1. Marketing Strategy 18.1.15.5.2. Product Strategy 18.1.15.5.3. Channel Strategy 19. Assumptions & Acronyms Used 20. Research Methodology
Don't pay for what you don't need
Customize your report by selecting specific countries or regions and save 30%!
List of Tables
Table 1: Global Market Value (US$ Million) Forecast by Region, 2017 to 2033 Table 2: Global Market Volume (Units) Forecast by Region, 2017 to 2033 Table 3: Global Market Value (US$ Million) Forecast by Cup Capacity, 2017 to 2033 Table 4: Global Market Volume (Units) Forecast by Cup Capacity, 2017 to 2033 Table 5: Global Market Value (US$ Million) Forecast by Cup Type, 2017 to 2033 Table 6: Global Market Volume (Units) Forecast by Cup Type, 2017 to 2033 Table 7: Global Market Value (US$ Million) Forecast by Sales Channel, 2017 to 2033 Table 8: Global Market Volume (Units) Forecast by Sales Channel, 2017 to 2033 Table 9: Global Market Value (US$ Million) Forecast by End-User, 2017 to 2033 Table 10: Global Market Volume (Units) Forecast by End-User, 2017 to 2033 Table 11: North America Market Value (US$ Million) Forecast by Country, 2017 to 2033 Table 12: North America Market Volume (Units) Forecast by Country, 2017 to 2033 Table 13: North America Market Value (US$ Million) Forecast by Cup Capacity, 2017 to 2033 Table 14: North America Market Volume (Units) Forecast by Cup Capacity, 2017 to 2033 Table 15: North America Market Value (US$ Million) Forecast by Cup Type, 2017 to 2033 Table 16: North America Market Volume (Units) Forecast by Cup Type, 2017 to 2033 Table 17: North America Market Value (US$ Million) Forecast by Sales Channel, 2017 to 2033 Table 18: North America Market Volume (Units) Forecast by Sales Channel, 2017 to 2033 Table 19: North America Market Value (US$ Million) Forecast by End-User, 2017 to 2033 Table 20: North America Market Volume (Units) Forecast by End-User, 2017 to 2033 Table 21: Latin America Market Value (US$ Million) Forecast by Country, 2017 to 2033 Table 22: Latin America Market Volume (Units) Forecast by Country, 2017 to 2033 Table 23: Latin America Market Value (US$ Million) Forecast by Cup Capacity, 2017 to 2033 Table 24: Latin America Market Volume (Units) Forecast by Cup Capacity, 2017 to 2033 Table 25: Latin America Market Value (US$ Million) Forecast by Cup Type, 2017 to 2033 Table 26: Latin America Market Volume (Units) Forecast by Cup Type, 2017 to 2033 Table 27: Latin America Market Value (US$ Million) Forecast by Sales Channel, 2017 to 2033 Table 28: Latin America Market Volume (Units) Forecast by Sales Channel, 2017 to 2033 Table 29: Latin America Market Value (US$ Million) Forecast by End-User, 2017 to 2033 Table 30: Latin America Market Volume (Units) Forecast by End-User, 2017 to 2033 Table 31: Western Europe Market Value (US$ Million) Forecast by Country, 2017 to 2033 Table 32: Western Europe Market Volume (Units) Forecast by Country, 2017 to 2033 Table 33: Western Europe Market Value (US$ Million) Forecast by Cup Capacity, 2017 to 2033 Table 34: Western Europe Market Volume (Units) Forecast by Cup Capacity, 2017 to 2033 Table 35: Western Europe Market Value (US$ Million) Forecast by Cup Type, 2017 to 2033 Table 36: Western Europe Market Volume (Units) Forecast by Cup Type, 2017 to 2033 Table 37: Western Europe Market Value (US$ Million) Forecast by Sales Channel, 2017 to 2033 Table 38: Western Europe Market Volume (Units) Forecast by Sales Channel, 2017 to 2033 Table 39: Western Europe Market Value (US$ Million) Forecast by End-User, 2017 to 2033 Table 40: Western Europe Market Volume (Units) Forecast by End-User, 2017 to 2033 Table 41: Eastern Europe Market Value (US$ Million) Forecast by Country, 2017 to 2033 Table 42: Eastern Europe Market Volume (Units) Forecast by Country, 2017 to 2033 Table 43: Eastern Europe Market Value (US$ Million) Forecast by Cup Capacity, 2017 to 2033 Table 44: Eastern Europe Market Volume (Units) Forecast by Cup Capacity, 2017 to 2033 Table 45: Eastern Europe Market Value (US$ Million) Forecast by Cup Type, 2017 to 2033 Table 46: Eastern Europe Market Volume (Units) Forecast by Cup Type, 2017 to 2033 Table 47: Eastern Europe Market Value (US$ Million) Forecast by Sales Channel, 2017 to 2033 Table 48: Eastern Europe Market Volume (Units) Forecast by Sales Channel, 2017 to 2033 Table 49: Eastern Europe Market Value (US$ Million) Forecast by End-User, 2017 to 2033 Table 50: Eastern Europe Market Volume (Units) Forecast by End-User, 2017 to 2033 Table 51: Asia Pacific Market Value (US$ Million) Forecast by Country, 2017 to 2033 Table 52: Asia Pacific Market Volume (Units) Forecast by Country, 2017 to 2033 Table 53: Asia Pacific Market Value (US$ Million) Forecast by Cup Capacity, 2017 to 2033 Table 54: Asia Pacific Market Volume (Units) Forecast by Cup Capacity, 2017 to 2033 Table 55: Asia Pacific Market Value (US$ Million) Forecast by Cup Type, 2017 to 2033 Table 56: Asia Pacific Market Volume (Units) Forecast by Cup Type, 2017 to 2033 Table 57: Asia Pacific Market Value (US$ Million) Forecast by Sales Channel, 2017 to 2033 Table 58: Asia Pacific Market Volume (Units) Forecast by Sales Channel, 2017 to 2033 Table 59: Asia Pacific Market Value (US$ Million) Forecast by End-User, 2017 to 2033 Table 60: Asia Pacific Market Volume (Units) Forecast by End-User, 2017 to 2033 Table 61: Middle East and Africa Market Value (US$ Million) Forecast by Country, 2017 to 2033 Table 62: Middle East and Africa Market Volume (Units) Forecast by Country, 2017 to 2033 Table 63: Middle East and Africa Market Value (US$ Million) Forecast by Cup Capacity, 2017 to 2033 Table 64: Middle East and Africa Market Volume (Units) Forecast by Cup Capacity, 2017 to 2033 Table 65: Middle East and Africa Market Value (US$ Million) Forecast by Cup Type, 2017 to 2033 Table 66: Middle East and Africa Market Volume (Units) Forecast by Cup Type, 2017 to 2033 Table 67: Middle East and Africa Market Value (US$ Million) Forecast by Sales Channel, 2017 to 2033 Table 68: Middle East and Africa Market Volume (Units) Forecast by Sales Channel, 2017 to 2033 Table 69: Middle East and Africa Market Value (US$ Million) Forecast by End-User, 2017 to 2033 Table 70: Middle East and Africa Market Volume (Units) Forecast by End-User, 2017 to 2033
Find your sweet spots for generating winning opportunities in this market.
Talk to AnalystList of Charts
Figure 1: Global Market Value (US$ Million) by Cup Capacity, 2023 to 2033 Figure 2: Global Market Value (US$ Million) by Cup Type, 2023 to 2033 Figure 3: Global Market Value (US$ Million) by Sales Channel, 2023 to 2033 Figure 4: Global Market Value (US$ Million) by End-User, 2023 to 2033 Figure 5: Global Market Value (US$ Million) by Region, 2023 to 2033 Figure 6: Global Market Value (US$ Million) Analysis by Region, 2017 to 2033 Figure 7: Global Market Volume (Units) Analysis by Region, 2017 to 2033 Figure 8: Global Market Value Share (%) and BPS Analysis by Region, 2023 to 2033 Figure 9: Global Market Y-o-Y Growth (%) Projections by Region, 2023 to 2033 Figure 10: Global Market Value (US$ Million) Analysis by Cup Capacity, 2017 to 2033 Figure 11: Global Market Volume (Units) Analysis by Cup Capacity, 2017 to 2033 Figure 12: Global Market Value Share (%) and BPS Analysis by Cup Capacity, 2023 to 2033 Figure 13: Global Market Y-o-Y Growth (%) Projections by Cup Capacity, 2023 to 2033 Figure 14: Global Market Value (US$ Million) Analysis by Cup Type, 2017 to 2033 Figure 15: Global Market Volume (Units) Analysis by Cup Type, 2017 to 2033 Figure 16: Global Market Value Share (%) and BPS Analysis by Cup Type, 2023 to 2033 Figure 17: Global Market Y-o-Y Growth (%) Projections by Cup Type, 2023 to 2033 Figure 18: Global Market Value (US$ Million) Analysis by Sales Channel, 2017 to 2033 Figure 19: Global Market Volume (Units) Analysis by Sales Channel, 2017 to 2033 Figure 20: Global Market Value Share (%) and BPS Analysis by Sales Channel, 2023 to 2033 Figure 21: Global Market Y-o-Y Growth (%) Projections by Sales Channel, 2023 to 2033 Figure 22: Global Market Value (US$ Million) Analysis by End-User, 2017 to 2033 Figure 23: Global Market Volume (Units) Analysis by End-User, 2017 to 2033 Figure 24: Global Market Value Share (%) and BPS Analysis by End-User, 2023 to 2033 Figure 25: Global Market Y-o-Y Growth (%) Projections by End-User, 2023 to 2033 Figure 26: Global Market Attractiveness by Cup Capacity, 2023 to 2033 Figure 27: Global Market Attractiveness by Cup Type, 2023 to 2033 Figure 28: Global Market Attractiveness by Sales Channel, 2023 to 2033 Figure 29: Global Market Attractiveness by End-User, 2023 to 2033 Figure 30: Global Market Attractiveness by Region, 2023 to 2033 Figure 31: North America Market Value (US$ Million) by Cup Capacity, 2023 to 2033 Figure 32: North America Market Value (US$ Million) by Cup Type, 2023 to 2033 Figure 33: North America Market Value (US$ Million) by Sales Channel, 2023 to 2033 Figure 34: North America Market Value (US$ Million) by End-User, 2023 to 2033 Figure 35: North America Market Value (US$ Million) by Country, 2023 to 2033 Figure 36: North America Market Value (US$ Million) Analysis by Country, 2017 to 2033 Figure 37: North America Market Volume (Units) Analysis by Country, 2017 to 2033 Figure 38: North America Market Value Share (%) and BPS Analysis by Country, 2023 to 2033 Figure 39: North America Market Y-o-Y Growth (%) Projections by Country, 2023 to 2033 Figure 40: North America Market Value (US$ Million) Analysis by Cup Capacity, 2017 to 2033 Figure 41: North America Market Volume (Units) Analysis by Cup Capacity, 2017 to 2033 Figure 42: North America Market Value Share (%) and BPS Analysis by Cup Capacity, 2023 to 2033 Figure 43: North America Market Y-o-Y Growth (%) Projections by Cup Capacity, 2023 to 2033 Figure 44: North America Market Value (US$ Million) Analysis by Cup Type, 2017 to 2033 Figure 45: North America Market Volume (Units) Analysis by Cup Type, 2017 to 2033 Figure 46: North America Market Value Share (%) and BPS Analysis by Cup Type, 2023 to 2033 Figure 47: North America Market Y-o-Y Growth (%) Projections by Cup Type, 2023 to 2033 Figure 48: North America Market Value (US$ Million) Analysis by Sales Channel, 2017 to 2033 Figure 49: North America Market Volume (Units) Analysis by Sales Channel, 2017 to 2033 Figure 50: North America Market Value Share (%) and BPS Analysis by Sales Channel, 2023 to 2033 Figure 51: North America Market Y-o-Y Growth (%) Projections by Sales Channel, 2023 to 2033 Figure 52: North America Market Value (US$ Million) Analysis by End-User, 2017 to 2033 Figure 53: North America Market Volume (Units) Analysis by End-User, 2017 to 2033 Figure 54: North America Market Value Share (%) and BPS Analysis by End-User, 2023 to 2033 Figure 55: North America Market Y-o-Y Growth (%) Projections by End-User, 2023 to 2033 Figure 56: North America Market Attractiveness by Cup Capacity, 2023 to 2033 Figure 57: North America Market Attractiveness by Cup Type, 2023 to 2033 Figure 58: North America Market Attractiveness by Sales Channel, 2023 to 2033 Figure 59: North America Market Attractiveness by End-User, 2023 to 2033 Figure 60: North America Market Attractiveness by Country, 2023 to 2033 Figure 61: Latin America Market Value (US$ Million) by Cup Capacity, 2023 to 2033 Figure 62: Latin America Market Value (US$ Million) by Cup Type, 2023 to 2033 Figure 63: Latin America Market Value (US$ Million) by Sales Channel, 2023 to 2033 Figure 64: Latin America Market Value (US$ Million) by End-User, 2023 to 2033 Figure 65: Latin America Market Value (US$ Million) by Country, 2023 to 2033 Figure 66: Latin America Market Value (US$ Million) Analysis by Country, 2017 to 2033 Figure 67: Latin America Market Volume (Units) Analysis by Country, 2017 to 2033 Figure 68: Latin America Market Value Share (%) and BPS Analysis by Country, 2023 to 2033 Figure 69: Latin America Market Y-o-Y Growth (%) Projections by Country, 2023 to 2033 Figure 70: Latin America Market Value (US$ Million) Analysis by Cup Capacity, 2017 to 2033 Figure 71: Latin America Market Volume (Units) Analysis by Cup Capacity, 2017 to 2033 Figure 72: Latin America Market Value Share (%) and BPS Analysis by Cup Capacity, 2023 to 2033 Figure 73: Latin America Market Y-o-Y Growth (%) Projections by Cup Capacity, 2023 to 2033 Figure 74: Latin America Market Value (US$ Million) Analysis by Cup Type, 2017 to 2033 Figure 75: Latin America Market Volume (Units) Analysis by Cup Type, 2017 to 2033 Figure 76: Latin America Market Value Share (%) and BPS Analysis by Cup Type, 2023 to 2033 Figure 77: Latin America Market Y-o-Y Growth (%) Projections by Cup Type, 2023 to 2033 Figure 78: Latin America Market Value (US$ Million) Analysis by Sales Channel, 2017 to 2033 Figure 79: Latin America Market Volume (Units) Analysis by Sales Channel, 2017 to 2033 Figure 80: Latin America Market Value Share (%) and BPS Analysis by Sales Channel, 2023 to 2033 Figure 81: Latin America Market Y-o-Y Growth (%) Projections by Sales Channel, 2023 to 2033 Figure 82: Latin America Market Value (US$ Million) Analysis by End-User, 2017 to 2033 Figure 83: Latin America Market Volume (Units) Analysis by End-User, 2017 to 2033 Figure 84: Latin America Market Value Share (%) and BPS Analysis by End-User, 2023 to 2033 Figure 85: Latin America Market Y-o-Y Growth (%) Projections by End-User, 2023 to 2033 Figure 86: Latin America Market Attractiveness by Cup Capacity, 2023 to 2033 Figure 87: Latin America Market Attractiveness by Cup Type, 2023 to 2033 Figure 88: Latin America Market Attractiveness by Sales Channel, 2023 to 2033 Figure 89: Latin America Market Attractiveness by End-User, 2023 to 2033 Figure 90: Latin America Market Attractiveness by Country, 2023 to 2033 Figure 91: Western Europe Market Value (US$ Million) by Cup Capacity, 2023 to 2033 Figure 92: Western Europe Market Value (US$ Million) by Cup Type, 2023 to 2033 Figure 93: Western Europe Market Value (US$ Million) by Sales Channel, 2023 to 2033 Figure 94: Western Europe Market Value (US$ Million) by End-User, 2023 to 2033 Figure 95: Western Europe Market Value (US$ Million) by Country, 2023 to 2033 Figure 96: Western Europe Market Value (US$ Million) Analysis by Country, 2017 to 2033 Figure 97: Western Europe Market Volume (Units) Analysis by Country, 2017 to 2033 Figure 98: Western Europe Market Value Share (%) and BPS Analysis by Country, 2023 to 2033 Figure 99: Western Europe Market Y-o-Y Growth (%) Projections by Country, 2023 to 2033 Figure 100: Western Europe Market Value (US$ Million) Analysis by Cup Capacity, 2017 to 2033 Figure 101: Western Europe Market Volume (Units) Analysis by Cup Capacity, 2017 to 2033 Figure 102: Western Europe Market Value Share (%) and BPS Analysis by Cup Capacity, 2023 to 2033 Figure 103: Western Europe Market Y-o-Y Growth (%) Projections by Cup Capacity, 2023 to 2033 Figure 104: Western Europe Market Value (US$ Million) Analysis by Cup Type, 2017 to 2033 Figure 105: Western Europe Market Volume (Units) Analysis by Cup Type, 2017 to 2033 Figure 106: Western Europe Market Value Share (%) and BPS Analysis by Cup Type, 2023 to 2033 Figure 107: Western Europe Market Y-o-Y Growth (%) Projections by Cup Type, 2023 to 2033 Figure 108: Western Europe Market Value (US$ Million) Analysis by Sales Channel, 2017 to 2033 Figure 109: Western Europe Market Volume (Units) Analysis by Sales Channel, 2017 to 2033 Figure 110: Western Europe Market Value Share (%) and BPS Analysis by Sales Channel, 2023 to 2033 Figure 111: Western Europe Market Y-o-Y Growth (%) Projections by Sales Channel, 2023 to 2033 Figure 112: Western Europe Market Value (US$ Million) Analysis by End-User, 2017 to 2033 Figure 113: Western Europe Market Volume (Units) Analysis by End-User, 2017 to 2033 Figure 114: Western Europe Market Value Share (%) and BPS Analysis by End-User, 2023 to 2033 Figure 115: Western Europe Market Y-o-Y Growth (%) Projections by End-User, 2023 to 2033 Figure 116: Western Europe Market Attractiveness by Cup Capacity, 2023 to 2033 Figure 117: Western Europe Market Attractiveness by Cup Type, 2023 to 2033 Figure 118: Western Europe Market Attractiveness by Sales Channel, 2023 to 2033 Figure 119: Western Europe Market Attractiveness by End-User, 2023 to 2033 Figure 120: Western Europe Market Attractiveness by Country, 2023 to 2033 Figure 121: Eastern Europe Market Value (US$ Million) by Cup Capacity, 2023 to 2033 Figure 122: Eastern Europe Market Value (US$ Million) by Cup Type, 2023 to 2033 Figure 123: Eastern Europe Market Value (US$ Million) by Sales Channel, 2023 to 2033 Figure 124: Eastern Europe Market Value (US$ Million) by End-User, 2023 to 2033 Figure 125: Eastern Europe Market Value (US$ Million) by Country, 2023 to 2033 Figure 126: Eastern Europe Market Value (US$ Million) Analysis by Country, 2017 to 2033 Figure 127: Eastern Europe Market Volume (Units) Analysis by Country, 2017 to 2033 Figure 128: Eastern Europe Market Value Share (%) and BPS Analysis by Country, 2023 to 2033 Figure 129: Eastern Europe Market Y-o-Y Growth (%) Projections by Country, 2023 to 2033 Figure 130: Eastern Europe Market Value (US$ Million) Analysis by Cup Capacity, 2017 to 2033 Figure 131: Eastern Europe Market Volume (Units) Analysis by Cup Capacity, 2017 to 2033 Figure 132: Eastern Europe Market Value Share (%) and BPS Analysis by Cup Capacity, 2023 to 2033 Figure 133: Eastern Europe Market Y-o-Y Growth (%) Projections by Cup Capacity, 2023 to 2033 Figure 134: Eastern Europe Market Value (US$ Million) Analysis by Cup Type, 2017 to 2033 Figure 135: Eastern Europe Market Volume (Units) Analysis by Cup Type, 2017 to 2033 Figure 136: Eastern Europe Market Value Share (%) and BPS Analysis by Cup Type, 2023 to 2033 Figure 137: Eastern Europe Market Y-o-Y Growth (%) Projections by Cup Type, 2023 to 2033 Figure 138: Eastern Europe Market Value (US$ Million) Analysis by Sales Channel, 2017 to 2033 Figure 139: Eastern Europe Market Volume (Units) Analysis by Sales Channel, 2017 to 2033 Figure 140: Eastern Europe Market Value Share (%) and BPS Analysis by Sales Channel, 2023 to 2033 Figure 141: Eastern Europe Market Y-o-Y Growth (%) Projections by Sales Channel, 2023 to 2033 Figure 142: Eastern Europe Market Value (US$ Million) Analysis by End-User, 2017 to 2033 Figure 143: Eastern Europe Market Volume (Units) Analysis by End-User, 2017 to 2033 Figure 144: Eastern Europe Market Value Share (%) and BPS Analysis by End-User, 2023 to 2033 Figure 145: Eastern Europe Market Y-o-Y Growth (%) Projections by End-User, 2023 to 2033 Figure 146: Eastern Europe Market Attractiveness by Cup Capacity, 2023 to 2033 Figure 147: Eastern Europe Market Attractiveness by Cup Type, 2023 to 2033 Figure 148: Eastern Europe Market Attractiveness by Sales Channel, 2023 to 2033 Figure 149: Eastern Europe Market Attractiveness by End-User, 2023 to 2033 Figure 150: Eastern Europe Market Attractiveness by Country, 2023 to 2033 Figure 151: Asia Pacific Market Value (US$ Million) by Cup Capacity, 2023 to 2033 Figure 152: Asia Pacific Market Value (US$ Million) by Cup Type, 2023 to 2033 Figure 153: Asia Pacific Market Value (US$ Million) by Sales Channel, 2023 to 2033 Figure 154: Asia Pacific Market Value (US$ Million) by End-User, 2023 to 2033 Figure 155: Asia Pacific Market Value (US$ Million) by Country, 2023 to 2033 Figure 156: Asia Pacific Market Value (US$ Million) Analysis by Country, 2017 to 2033 Figure 157: Asia Pacific Market Volume (Units) Analysis by Country, 2017 to 2033 Figure 158: Asia Pacific Market Value Share (%) and BPS Analysis by Country, 2023 to 2033 Figure 159: Asia Pacific Market Y-o-Y Growth (%) Projections by Country, 2023 to 2033 Figure 160: Asia Pacific Market Value (US$ Million) Analysis by Cup Capacity, 2017 to 2033 Figure 161: Asia Pacific Market Volume (Units) Analysis by Cup Capacity, 2017 to 2033 Figure 162: Asia Pacific Market Value Share (%) and BPS Analysis by Cup Capacity, 2023 to 2033 Figure 163: Asia Pacific Market Y-o-Y Growth (%) Projections by Cup Capacity, 2023 to 2033 Figure 164: Asia Pacific Market Value (US$ Million) Analysis by Cup Type, 2017 to 2033 Figure 165: Asia Pacific Market Volume (Units) Analysis by Cup Type, 2017 to 2033 Figure 166: Asia Pacific Market Value Share (%) and BPS Analysis by Cup Type, 2023 to 2033 Figure 167: Asia Pacific Market Y-o-Y Growth (%) Projections by Cup Type, 2023 to 2033 Figure 168: Asia Pacific Market Value (US$ Million) Analysis by Sales Channel, 2017 to 2033 Figure 169: Asia Pacific Market Volume (Units) Analysis by Sales Channel, 2017 to 2033 Figure 170: Asia Pacific Market Value Share (%) and BPS Analysis by Sales Channel, 2023 to 2033 Figure 171: Asia Pacific Market Y-o-Y Growth (%) Projections by Sales Channel, 2023 to 2033 Figure 172: Asia Pacific Market Value (US$ Million) Analysis by End-User, 2017 to 2033 Figure 173: Asia Pacific Market Volume (Units) Analysis by End-User, 2017 to 2033 Figure 174: Asia Pacific Market Value Share (%) and BPS Analysis by End-User, 2023 to 2033 Figure 175: Asia Pacific Market Y-o-Y Growth (%) Projections by End-User, 2023 to 2033 Figure 176: Asia Pacific Market Attractiveness by Cup Capacity, 2023 to 2033 Figure 177: Asia Pacific Market Attractiveness by Cup Type, 2023 to 2033 Figure 178: Asia Pacific Market Attractiveness by Sales Channel, 2023 to 2033 Figure 179: Asia Pacific Market Attractiveness by End-User, 2023 to 2033 Figure 180: Asia Pacific Market Attractiveness by Country, 2023 to 2033 Figure 181: Middle East and Africa Market Value (US$ Million) by Cup Capacity, 2023 to 2033 Figure 182: Middle East and Africa Market Value (US$ Million) by Cup Type, 2023 to 2033 Figure 183: Middle East and Africa Market Value (US$ Million) by Sales Channel, 2023 to 2033 Figure 184: Middle East and Africa Market Value (US$ Million) by End-User, 2023 to 2033 Figure 185: Middle East and Africa Market Value (US$ Million) by Country, 2023 to 2033 Figure 186: Middle East and Africa Market Value (US$ Million) Analysis by Country, 2017 to 2033 Figure 187: Middle East and Africa Market Volume (Units) Analysis by Country, 2017 to 2033 Figure 188: Middle East and Africa Market Value Share (%) and BPS Analysis by Country, 2023 to 2033 Figure 189: Middle East and Africa Market Y-o-Y Growth (%) Projections by Country, 2023 to 2033 Figure 190: Middle East and Africa Market Value (US$ Million) Analysis by Cup Capacity, 2017 to 2033 Figure 191: Middle East and Africa Market Volume (Units) Analysis by Cup Capacity, 2017 to 2033 Figure 192: Middle East and Africa Market Value Share (%) and BPS Analysis by Cup Capacity, 2023 to 2033 Figure 193: Middle East and Africa Market Y-o-Y Growth (%) Projections by Cup Capacity, 2023 to 2033 Figure 194: Middle East and Africa Market Value (US$ Million) Analysis by Cup Type, 2017 to 2033 Figure 195: Middle East and Africa Market Volume (Units) Analysis by Cup Type, 2017 to 2033 Figure 196: Middle East and Africa Market Value Share (%) and BPS Analysis by Cup Type, 2023 to 2033 Figure 197: Middle East and Africa Market Y-o-Y Growth (%) Projections by Cup Type, 2023 to 2033 Figure 198: Middle East and Africa Market Value (US$ Million) Analysis by Sales Channel, 2017 to 2033 Figure 199: Middle East and Africa Market Volume (Units) Analysis by Sales Channel, 2017 to 2033 Figure 200: Middle East and Africa Market Value Share (%) and BPS Analysis by Sales Channel, 2023 to 2033 Figure 201: Middle East and Africa Market Y-o-Y Growth (%) Projections by Sales Channel, 2023 to 2033 Figure 202: Middle East and Africa Market Value (US$ Million) Analysis by End-User, 2017 to 2033 Figure 203: Middle East and Africa Market Volume (Units) Analysis by End-User, 2017 to 2033 Figure 204: Middle East and Africa Market Value Share (%) and BPS Analysis by End-User, 2023 to 2033 Figure 205: Middle East and Africa Market Y-o-Y Growth (%) Projections by End-User, 2023 to 2033 Figure 206: Middle East and Africa Market Attractiveness by Cup Capacity, 2023 to 2033 Figure 207: Middle East and Africa Market Attractiveness by Cup Type, 2023 to 2033 Figure 208: Middle East and Africa Market Attractiveness by Sales Channel, 2023 to 2033 Figure 209: Middle East and Africa Market Attractiveness by End-User, 2023 to 2033 Figure 210: Middle East and Africa Market Attractiveness by Country, 2023 to 2033
Recommendations
Explore Packaging Insights
View Reports