The global paper edge protector market is valued at USD 4,127 million in 2025 and is set to reach USD 7,389 million by 2035, growing at a CAGR of 6.0%. The market stands at the forefront of a transformative decade that promises to redefine protective packaging infrastructure and edge protection excellence across logistics, construction materials, furniture, and industrial goods sectors. The market's journey from USD 4,127 million in 2025 to USD 7,389 million by 2035 represents substantial growth, demonstrating the accelerating adoption of corner protection solutions and sophisticated damage prevention systems across shipping boxes, palletized loads, structural components, and heavy-duty industrial applications.
The first half of the decade (2025-2030) will witness the market climbing from USD 4,127 million to approximately USD 5,394 million, adding USD 1,267 million in value, which constitutes 39% of the total forecast growth period. This phase will be characterized by the rapid adoption of reinforced edge protection systems, driven by increasing demand for damage-free transportation and enhanced load stability requirements worldwide. Superior crushing resistance and moisture protection features will become standard expectations rather than premium options.
The latter half (2030-2035) will witness sustained growth from USD 5,394 million to USD 7,389 million, representing an addition of USD 1,995 million or 61% of the decade's expansion. This period will be defined by mass market penetration of specialized angle board systems, integration with comprehensive packaging platforms, and seamless compatibility with existing strapping and wrapping infrastructure. The market trajectory signals fundamental shifts in how logistics providers and packaging professionals approach protective transportation solutions, with participants positioned to benefit from sustained demand across multiple application segments.
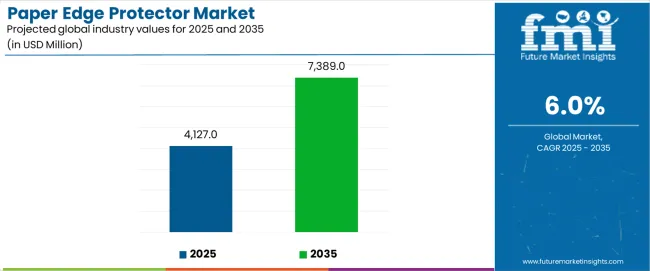
The paper edge protector market demonstrates distinct growth phases with varying market characteristics and competitive dynamics. Between 2025 and 2030, the market progresses through its protective packaging adoption phase, expanding from USD 4,127 million to USD 5,394 million with steady annual increments averaging 5.5% growth. This period showcases the transition from basic cardboard corners to advanced composite edge protection systems with enhanced crushing strength and integrated moisture barriers becoming mainstream features.
The 2025-2030 phase adds USD 1,267 million to market value, representing 39% of total decade expansion. Market maturation factors include standardization of edge protection specifications, declining material costs for high-strength production, and increasing logistics awareness of edge protector benefits reaching 70-75% effectiveness in damage prevention applications. Competitive landscape evolution during this period features established manufacturers like Sonoco Products and Smurfit Kappa expanding their product portfolios while new entrants focus on specialized U-shaped solutions and enhanced adhesive bonding technology.
From 2030 to 2035, market dynamics shift toward advanced customization and multi-sector deployment, with growth accelerating from USD 5,394 million to USD 7,389 million, adding USD 1,995 million or 61% of total expansion. This phase transition logic centers on universal edge protection systems, integration with automated packaging equipment, and deployment across diverse application scenarios, becoming standard rather than specialized protective formats. The competitive environment matures with focus shifting from basic corner protection to comprehensive load stability and compatibility with high-speed logistics operations.
At-a-Glance Metrics
| Metric | Value |
|---|---|
| Market Value (2025) | USD 4,127 million |
| Market Forecast (2035) | USD 7,389 million |
| Growth Rate | 6.00% CAGR |
| Leading Product Type | L-shaped |
| Primary Application | Logistics & Transportation |
The market demonstrates strong fundamentals with L-shaped systems capturing a dominant share through superior corner protection and versatile application capabilities. Logistics applications drive primary demand, supported by increasing e-commerce growth requirements and industrial shipping protection management solutions. Geographic expansion remains concentrated in developed markets with established distribution infrastructure, while emerging economies show accelerating adoption rates driven by manufacturing expansion projects and rising export activity.
The paper edge protector market represents a compelling intersection of protective packaging innovation, load stability enhancement, and damage prevention management. With robust growth projected from USD 4,127 million in 2025 to USD 7,389 million by 2035 at a 6.00% CAGR, this market is driven by increasing logistics expansion trends, industrial packaging requirements, and commercial demand for damage-free transportation formats.
The market's expansion reflects a fundamental shift in how logistics providers and packaging professionals approach protective shipping infrastructure. Strong growth opportunities exist across diverse applications, from e-commerce operations requiring corner protection to manufacturing facilities demanding heavy-duty edge reinforcement. Geographic expansion is particularly pronounced in Asia-Pacific markets, led by China (6.8% CAGR) and India (6.5% CAGR), while established markets in North America and Europe drive innovation and specialized segment development.
The dominance of L-shaped systems and logistics applications underscores the importance of proven protection technology and structural reliability in driving adoption. Material thickness and adhesive bonding remain key challenges, creating opportunities for companies that can deliver reliable performance while maintaining cost efficiency.
Market expansion rests on three fundamental shifts driving adoption across logistics and industrial sectors. E-commerce growth creates compelling advantages through edge protection systems that provide comprehensive damage prevention with reduced shipping claims, enabling online retailers to safeguard merchandise and reduce replacement costs while maintaining delivery quality and justifying investment over standard packaging materials. Industrial modernization accelerates as manufacturing companies worldwide seek protective packaging systems that deliver load stability directly to transportation environments, enabling damage reduction that aligns with quality expectations and maximizes product integrity.
Logistics efficiency drives adoption from shipping providers requiring corner protection solutions that maximize load security while maintaining handling performance during distribution and warehousing operations. The growth faces headwinds from adhesive bonding variations that differ across production facilities regarding environmental conditions and curing processes, potentially limiting performance reliability in extreme temperature manufacturing categories. Material consistency also persists regarding edge alignment and strength uniformity that may increase quality control requirements in markets with demanding structural standards.
Primary Classification: The market segments by product type into L-shaped, U-shaped, wrap-around, and custom-formed categories, representing the evolution from basic corner protection to comprehensive edge reinforcement formats for integrated protective operations.
Secondary Breakdown: Application segmentation divides the market into logistics & transportation, construction materials, furniture & appliances, electronics, food & beverage, and others sectors, reflecting distinct requirements for crushing resistance, moisture protection, and load stability.
Regional Classification: Geographic distribution covers North America, Europe, Asia Pacific, Latin America, and the Middle East & Africa, with developed markets leading innovation while emerging economies show accelerating growth patterns driven by manufacturing expansion programs.
The segmentation structure reveals technology progression from standard L-shaped protectors toward integrated comprehensive platforms with enhanced strength and structural capabilities, while application diversity spans from logistics operations to manufacturing facilities requiring comprehensive damage prevention and load stabilization solutions.
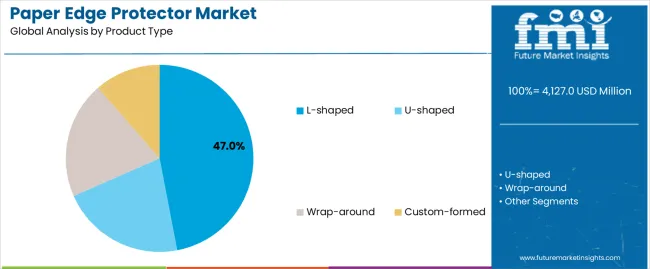
L-shaped segment is estimated to account for 47% of the paper edge protector market share in 2025. The segment's leading position stems from its fundamental role as a critical component in corner protection applications and its extensive use across multiple logistics and industrial sectors. L-shaped protector's dominance is attributed to its superior crushing resistance, including excellent corner reinforcement, proven load distribution, and balanced structural properties that make it indispensable for protective packaging operations.
Market Position: L-shaped systems command the leading position in the paper edge protector market through advanced forming technologies, including comprehensive thickness control, uniform edge formation, and reliable adhesive bonding that enable manufacturers to deploy protection solutions across diverse application environments.
Value Drivers: The segment benefits from logistics preference for proven corner profiles that provide exceptional damage prevention without requiring heavy-duty substrate materials. Efficient material usage enables deployment in shipping applications, palletized loads, and industrial transport where protection quality and cost efficiency represent critical selection requirements.
Competitive Advantages: L-shaped systems differentiate through excellent crushing resistance, proven structural integrity, and compatibility with standard strapping equipment that enhance protective capabilities while maintaining economical material profiles suitable for diverse corner protection applications.
Key market characteristics:
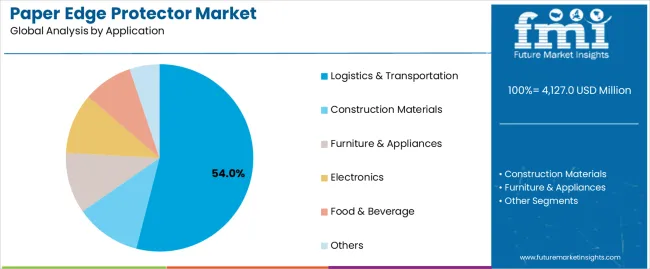
Logistics & transportation segment is projected to hold 54% of the paper edge protector market share in 2025. The segment's market leadership is driven by the extensive use of edge protectors in shipping containers, pallet corners, freight protection, and cargo stabilization, where protective materials serve as both structural reinforcement and damage prevention systems. The logistics industry's consistent investment in protective materials supports the segment's dominant position.
Market Context: Logistics applications dominate the market due to widespread adoption of damage prevention materials and increasing focus on load stability, cargo protection, and cost-effective shipping that enhance operational efficiency while maintaining product integrity.
Appeal Factors: Logistics providers prioritize crushing resistance, moisture protection, and integration with strapping equipment that enable coordinated deployment across multiple shipping lines. The segment benefits from substantial e-commerce growth and industrial standards that emphasize damage-free transportation for manufactured goods applications.
Growth Drivers: Global trade expansion programs incorporate edge protectors as standard material for container shipping and freight stabilization. At the same time, logistics provider initiatives are increasing demand for protective systems that comply with international shipping standards and enhance cargo security protocols.
Market Challenges: Material cost variations and adhesive performance limitations may limit deployment flexibility in extreme temperature shipping or ultra-cost-sensitive freight scenarios.
Application dynamics include:
Growth Accelerators: Global trade expansion drives primary adoption as edge protection systems provide exceptional damage prevention capabilities that enable cargo protection without excessive material weight, supporting shipping cost reduction and claim minimization that require protective packaging formats. Industrial modernization accelerates market growth as manufacturing companies seek reliable protection solutions that maintain product integrity during transport while enhancing operational efficiency through reduced replacement costs. Consumer expectations increase worldwide, creating sustained demand for damage-free delivery systems that complement product quality and provide competitive advantages in logistics differentiation.
Growth Inhibitors: Adhesive performance challenges differ across environmental conditions regarding humidity levels and temperature variations, which may limit market penetration and reliability in extreme climate categories with demanding shipping requirements. Material cost fluctuations persist regarding recycled fiber availability and specialized lamination treatments that may increase total packaging costs in price-sensitive applications with tight margin specifications. Market fragmentation across multiple protector profiles and strength specifications creates compatibility concerns between different strapping equipment and existing packaging infrastructure.
Market Evolution Patterns: Adoption accelerates in logistics and industrial sectors where damage prevention justifies material investments, with geographic concentration in developed markets transitioning toward mainstream adoption in emerging economies driven by manufacturing expansion and export activity growth. Technology development focuses on enhanced adhesive bonding, improved crushing resistance, and integration with automated packaging systems that optimize protection performance and handling efficiency. The market could face disruption if alternative protective materials or technology innovations significantly challenge edge protector advantages in transportation applications.
The paper edge protector market demonstrates varied regional dynamics with Growth Leaders including China (6.8% CAGR) and India (6.5% CAGR) driving expansion through manufacturing growth and export activity modernization. Steady Performers encompass the USA (6.2% CAGR), Germany (5.8% CAGR), and Japan (5.5% CAGR), benefiting from established logistics sectors and industrial packaging adoption.
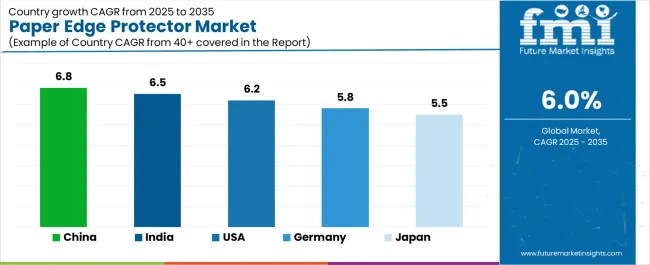
| Country | CAGR (2025-2035) |
|---|---|
| China | 6.8% |
| India | 6.5% |
| USA | 6.2% |
| Germany | 5.8% |
| Japan | 5.5% |
Regional synthesis reveals Asia-Pacific markets leading growth through manufacturing expansion and export development, while European countries maintain steady expansion supported by specialized logistics applications and industrial protection requirements. North American markets show strong growth driven by e-commerce logistics and container shipping applications.
China establishes regional leadership through explosive manufacturing expansion and comprehensive export modernization, integrating advanced edge protection systems as standard components in container shipping and industrial packaging applications. The country's 6.8% CAGR through 2035 reflects industrial activity growth promoting global trade and domestic logistics development that mandate the use of protective packaging systems in shipping operations. Growth concentrates in major manufacturing hubs, including Guangzhou, Shenzhen, and Ningbo, where logistics networks showcase integrated edge protection systems that appeal to export manufacturers seeking enhanced damage prevention and international shipping standards.
Chinese manufacturers are developing innovative edge protector solutions that combine local production advantages with international protection specifications, including high-strength composites and advanced moisture-resistant capabilities.
Strategic Market Indicators:
The Indian market emphasizes logistics applications, including rapid manufacturing development and comprehensive export expansion that increasingly incorporates edge protectors for container corners and industrial shipping applications. The country is projected to show a 6.5% CAGR through 2035, driven by massive industrial activity under manufacturing initiatives and commercial demand for reliable, cost-effective protection systems. Indian logistics providers prioritize damage prevention with edge protectors delivering cargo security through economical material usage and efficient crushing resistance.
Technology deployment channels include major shipping companies, manufacturing exporters, and logistics providers that support high-volume usage for domestic and international applications.
Performance Metrics:
The U.S. market emphasizes advanced edge protector features, including innovative composite technologies and integration with comprehensive logistics platforms that manage cargo protection, damage prevention, and shipping efficiency applications through unified protective systems. The country is projected to show a 6.2% CAGR through 2035, driven by e-commerce logistics expansion under consumer shipping trends and commercial demand for premium, reliable protection systems. American logistics providers prioritize operational efficiency with edge protectors delivering comprehensive damage prevention through advanced materials and structural innovation.
Technology deployment channels include major shipping companies, e-commerce logistics, and specialty packaging providers that support custom development for premium operations.
Performance Metrics:
In Hamburg, Bremen, and Frankfurt, German logistics providers and manufacturing companies are implementing advanced edge protection systems to enhance cargo security and support damage prevention that aligns with quality protocols and shipping standards. The German market demonstrates sustained growth with a 5.8% CAGR through 2035, driven by industrial logistics innovation programs and manufacturing investments that emphasize protective packaging systems for export and domestic applications. German logistics facilities are prioritizing edge protector systems that provide exceptional crushing resistance while maintaining compliance with recycling standards and minimizing material waste, particularly important in automotive shipping and machinery transport operations.
Market expansion benefits from industrial quality programs that mandate enhanced protection in shipping specifications, creating sustained demand across Germany's manufacturing and logistics sectors, where damage prevention and structural precision represent critical requirements.
Strategic Market Indicators:
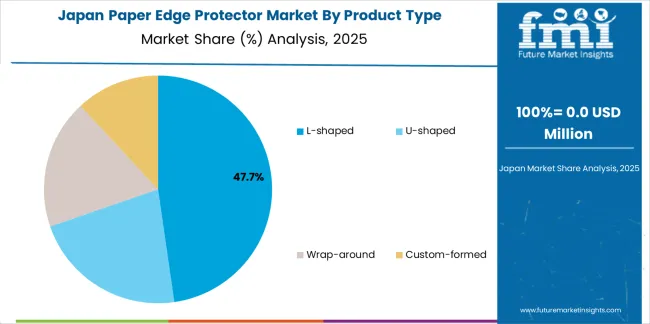
Japan's sophisticated logistics market demonstrates meticulous edge protector deployment, growing at 5.5% CAGR, with documented operational excellence in cargo protection and shipping applications through integration with existing packaging systems and quality assurance infrastructure. The country leverages engineering expertise in paper manufacturing and adhesive precision to maintain market leadership. Logistics centers, including Tokyo, Osaka, and Yokohama, showcase advanced installations where edge protection systems integrate with comprehensive packaging platforms and automated handling systems to optimize damage prevention and cargo security.
Japanese logistics providers prioritize protection precision and material consistency in system development, creating demand for premium edge protector systems with advanced features, including ultra-high strength and integration with robotic handling protocols. The market benefits from established shipping infrastructure and willingness to invest in specialized protection technologies that provide superior damage prevention and regulatory compliance.
Market Intelligence Brief:
The paper edge protector market in Europe is projected to grow from USD 1,089 million in 2025 to USD 1,784 million by 2035, registering a CAGR of 5.1% over the forecast period. Germany is expected to maintain its leadership position with a 39.4% market share in 2025, declining slightly to 38.9% by 2035, supported by its logistics excellence and major shipping centers, including Hamburg and Bremen.
France follows with a 21.8% share in 2025, projected to reach 22.3% by 2035, driven by comprehensive manufacturing logistics and industrial shipping initiatives. The United Kingdom holds a 18.6% share in 2025, expected to maintain 19.1% by 2035 through established container shipping sectors and e-commerce logistics adoption. Italy commands a 12.7% share, while Spain accounts for 6.2% in 2025. The Rest of Europe region is anticipated to gain momentum, expanding its collective share from 1.3% to 1.7% by 2035, attributed to increasing manufacturing development in Eastern European countries and emerging Nordic logistics companies implementing protective packaging programs.
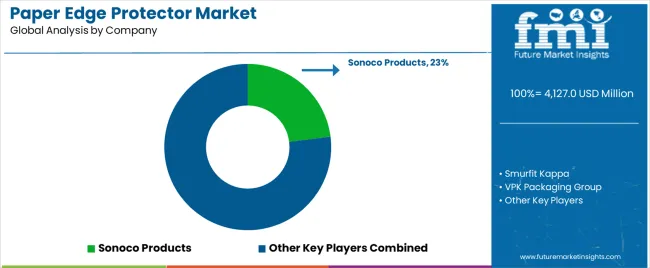
The paper edge protector market operates with moderate concentration, featuring approximately 25-32 participants, where leading companies control roughly 42-48% of the global market share through established logistics networks and comprehensive protective profile capabilities. Competition emphasizes crushing resistance, adhesive bonding, and handling efficiency rather than price-based rivalry.
Market leaders encompass Sonoco Products, Smurfit Kappa, and VPK Packaging Group, which maintain competitive advantages through extensive protective packaging expertise, global production networks, and comprehensive technical support capabilities that create logistics loyalty and support application requirements. These companies leverage decades of protective materials experience and ongoing forming technology investments to develop advanced edge protector systems with exceptional strength and structural features. Sonoco Products leads with 23% share.
Specialty challengers include Cascades Inc., Crown Holdings, and Packaging Corporation of America, which compete through specialized protection innovation focus and efficient logistics solutions that appeal to shipping providers seeking premium damage prevention formats and custom structural flexibility. These companies differentiate through engineering emphasis and specialized application focus.
Market dynamics favor participants that combine reliable protection performance with advanced handling support, including automated compatibility and strapping integration. Competitive pressure intensifies as traditional packaging manufacturers expand into edge protection systems, while specialized logistics providers challenge established players through innovative composite materials and cost-effective production targeting emerging shipping segments.
| Item | Value |
|---|---|
| Quantitative Units | USD 4,127 million |
| Product Type | L-shaped, U-shaped, Wrap-around, Custom-formed |
| Application | Logistics & Transportation, Construction Materials, Furniture & Appliances, Electronics, Food & Beverage, Others |
| Regions Covered | North America, Europe, Asia Pacific, Latin America, Middle East & Africa |
| Countries Covered | U.S., Germany, Japan, China, India, and 25+ additional countries |
| Key Companies Profiled | Sonoco Products, Smurfit Kappa, VPK Packaging Group, Cascades Inc., Crown Holdings |
| Additional Attributes | Dollar sales by product type and application categories, regional adoption trends across North America, Europe, and Asia-Pacific, competitive landscape with protective packaging manufacturers and logistics providers, shipping company preferences for crushing resistance and adhesive bonding, integration with strapping equipment and automated handling systems, innovations in composite technology and lamination processes, and development of specialized heavy-duty solutions with enhanced strength capabilities and moisture-resistant features |
The global paper edge protector market is estimated to be valued at USD 4,127.0 million in 2025.
The market size for the paper edge protector market is projected to reach USD 7,389.0 million by 2035.
The paper edge protector market is expected to grow at a 6.0% CAGR between 2025 and 2035.
The key product types in paper edge protector market are l-shaped , u-shaped, wrap-around and custom-formed.
In terms of application, logistics & transportation segment to command 54.0% share in the paper edge protector market in 2025.


Our Research Products

The "Full Research Suite" delivers actionable market intel, deep dives on markets or technologies, so clients act faster, cut risk, and unlock growth.

The Leaderboard benchmarks and ranks top vendors, classifying them as Established Leaders, Leading Challengers, or Disruptors & Challengers.

Locates where complements amplify value and substitutes erode it, forecasting net impact by horizon

We deliver granular, decision-grade intel: market sizing, 5-year forecasts, pricing, adoption, usage, revenue, and operational KPIs—plus competitor tracking, regulation, and value chains—across 60 countries broadly.

Spot the shifts before they hit your P&L. We track inflection points, adoption curves, pricing moves, and ecosystem plays to show where demand is heading, why it is changing, and what to do next across high-growth markets and disruptive tech

Real-time reads of user behavior. We track shifting priorities, perceptions of today’s and next-gen services, and provider experience, then pace how fast tech moves from trial to adoption, blending buyer, consumer, and channel inputs with social signals (#WhySwitch, #UX).

Partner with our analyst team to build a custom report designed around your business priorities. From analysing market trends to assessing competitors or crafting bespoke datasets, we tailor insights to your needs.
Supplier Intelligence
Discovery & Profiling
Capacity & Footprint
Performance & Risk
Compliance & Governance
Commercial Readiness
Who Supplies Whom
Scorecards & Shortlists
Playbooks & Docs
Category Intelligence
Definition & Scope
Demand & Use Cases
Cost Drivers
Market Structure
Supply Chain Map
Trade & Policy
Operating Norms
Deliverables
Buyer Intelligence
Account Basics
Spend & Scope
Procurement Model
Vendor Requirements
Terms & Policies
Entry Strategy
Pain Points & Triggers
Outputs
Pricing Analysis
Benchmarks
Trends
Should-Cost
Indexation
Landed Cost
Commercial Terms
Deliverables
Brand Analysis
Positioning & Value Prop
Share & Presence
Customer Evidence
Go-to-Market
Digital & Reputation
Compliance & Trust
KPIs & Gaps
Outputs
Full Research Suite comprises of:
Market outlook & trends analysis
Interviews & case studies
Strategic recommendations
Vendor profiles & capabilities analysis
5-year forecasts
8 regions and 60+ country-level data splits
Market segment data splits
12 months of continuous data updates
DELIVERED AS:
PDF EXCEL ONLINE
Key Players & Market Share in the Paper Edge Protectors Industry
Edge Protector Market Size and Share Forecast Outlook 2025 to 2035
Leading Providers & Market Share in Edge Protector Manufacturing
Foam Edge Protectors Market Size and Share Forecast Outlook 2025 to 2035
Assessing Foam Edge Protectors Market Share & Industry Insights
Molded Fiber Pulp Edge Protectors Market Size and Share Forecast Outlook 2025 to 2035
Paperboard Partition Market Size and Share Forecast Outlook 2025 to 2035
Paper Box Market Size and Share Forecast Outlook 2025 to 2035
Edge Bead Remover (EBR) Market Size and Share Forecast Outlook 2025 to 2035
Paper Cup Lids Market Size and Share Forecast Outlook 2025 to 2035
Paper Pallet Market Size and Share Forecast Outlook 2025 to 2035
Paper and Paperboard Packaging Market Forecast and Outlook 2025 to 2035
Edge Security Market Size and Share Forecast Outlook 2025 to 2035
Paper Wrap Market Size and Share Forecast Outlook 2025 to 2035
Paper Cups Market Size and Share Forecast Outlook 2025 to 2035
Paper Core Market Size and Share Forecast Outlook 2025 to 2035
Paper Bags Market Size and Share Forecast Outlook 2025 to 2035
Paper Processing Resins Market Size and Share Forecast Outlook 2025 to 2035
Edge Banders Market Size and Share Forecast Outlook 2025 to 2035
Paper Tester Market Size and Share Forecast Outlook 2025 to 2035

Thank you!
You will receive an email from our Business Development Manager. Please be sure to check your SPAM/JUNK folder too.
Chat With
MaRIA