The global paper cup lids market is valued at USD 4,892 million in 2025 and is set to reach USD 9,143 million by 2035, growing at a CAGR of 6.5%. The market stands at the forefront of a transformative decade that promises to redefine beverage packaging infrastructure and disposable foodservice excellence across coffee shops, quick-service restaurants, convenience stores, and food delivery sectors. The market's journey from USD 4,892 million in 2025 to USD 9,143 million by 2035 represents substantial growth, demonstrating the accelerating adoption of eco-friendly lid solutions and sophisticated beverage containment systems across hot beverages, cold drinks, specialty coffees, and premium beverage applications.
The first half of the decade (2025-2030) will witness the market climbing from USD 4,892 million to approximately USD 6,421 million, adding USD 1,529 million in value, which constitutes 29% of the total forecast growth period. This phase will be characterized by the rapid adoption of biodegradable lid systems, driven by increasing demand for renewable packaging materials and enhanced leak-proof performance requirements worldwide. Superior heat resistance capabilities and moisture barrier features will become standard expectations rather than premium options.
The latter half (2030-2035) will witness sustained growth from USD 6,421 million to USD 9,143 million, representing an addition of USD 2,722 million or 71% of the decade's expansion. This period will be defined by mass market penetration of specialized paper-based lid systems, integration with comprehensive beverage packaging platforms, and seamless compatibility with existing cup manufacturing and sealing infrastructure. The market trajectory signals fundamental shifts in how foodservice operators and beverage retailers approach disposable packaging solutions, with participants positioned to benefit from sustained demand across multiple beverage segments.

The paper cup lids market demonstrates distinct growth phases with varying market characteristics and competitive dynamics. Between 2025 and 2030, the market progresses through its eco-friendly packaging adoption phase, expanding from USD 4,892 million to USD 6,421 million with steady annual increments averaging 5.6% growth. This period showcases the transition from traditional plastic lids to advanced paper-based systems with enhanced sealing performance and integrated leak-proof technology becoming mainstream features.
The 2025-2030 phase adds USD 1,529 million to market value, representing 29% of total decade expansion. Market maturation factors include standardization of paper lid specifications, declining material costs for biodegradable production, and increasing foodservice awareness of paper lid benefits reaching 75-80% effectiveness in beverage containment applications. Competitive landscape evolution during this period features established manufacturers like Huhtamaki and Dart Container Corporation expanding their product portfolios while new entrants focus on specialized compostable solutions and enhanced barrier coating technology.
From 2030 to 2035, market dynamics shift toward advanced customization and multi-segment deployment, with growth accelerating from USD 6,421 million to USD 9,143 million, adding USD 2,722 million or 71% of total expansion. This phase transition logic centers on universal paper lid systems, integration with automated beverage dispensing equipment, and deployment across diverse foodservice scenarios, becoming standard rather than specialized packaging formats. The competitive environment matures with focus shifting from basic barrier properties to comprehensive thermal performance and compatibility with high-speed sealing operations.
At-a-Glance Metrics
| Metric | Value |
|---|---|
| Market Value (2025) | USD 4,892 million |
| Market Forecast (2035) | USD 9,143 million |
| Growth Rate | 6.50% CAGR |
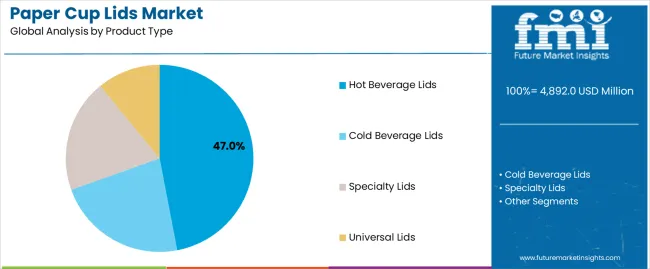
| Leading Product Type | Hot Beverage Lids |
| Primary End-Use | Foodservice Segment |
The market demonstrates strong fundamentals with hot beverage lid systems capturing a dominant share through superior heat resistance and secure sealing capabilities. Foodservice applications drive primary demand, supported by increasing coffee consumption trends and takeaway beverage management solutions. Geographic expansion remains concentrated in developed markets with established coffee culture infrastructure, while emerging economies show accelerating adoption rates driven by quick-service restaurant expansion and rising disposable beverage consumption.
The paper cup lids market represents a compelling intersection of eco-friendly packaging innovation, beverage containment enhancement, and foodservice optimization management. With robust growth projected from USD 4,892 million in 2025 to USD 9,143 million by 2035 at a 6.50% CAGR, this market is driven by increasing coffee shop expansion trends, quick-service restaurant requirements, and commercial demand for biodegradable packaging formats.
The market's expansion reflects a fundamental shift in how foodservice operators and beverage retailers approach disposable packaging infrastructure. Strong growth opportunities exist across diverse applications, from coffee shop operations requiring heat-resistant packaging to convenience stores demanding tamper-evident solutions. Geographic expansion is particularly pronounced in Asia-Pacific markets, led by China (7.8% CAGR) and India (7.3% CAGR), while established markets in North America and Europe drive innovation and specialized segment development.
The dominance of hot beverage lid systems and foodservice applications underscores the importance of proven thermal protection and sealing reliability in driving adoption. Material cost variations and manufacturing complexity remain key challenges, creating opportunities for companies that can deliver reliable performance while maintaining operational efficiency.
Market expansion rests on three fundamental shifts driving adoption across foodservice and retail beverage sectors. Coffee culture growth creates compelling advantages through paper lid systems that provide comprehensive beverage protection with enhanced user safety, enabling coffee shops to maintain beverage quality and reduce spillage incidents while meeting environmental expectations and justifying investment over conventional plastic alternatives. Regulatory compliance accelerates as governments worldwide implement restrictions on single-use plastics, creating mandatory adoption that aligns with environmental policies and drives infrastructure transition toward renewable packaging materials. Quick-service expansion drives adoption from restaurant chains requiring biodegradable packaging solutions that maintain operational efficiency while meeting corporate responsibility standards during takeaway and delivery operations.
The growth faces headwinds from manufacturing complexity variations that differ across production facilities regarding coating application and sealing performance, potentially limiting quality consistency in high-volume foodservice categories. Material cost premium also persists regarding paper-based production and specialized barrier treatments that may increase total packaging costs in price-sensitive applications with tight margin specifications.
Primary Classification: The market segments by product type into hot beverage lids, cold beverage lids, specialty lids, and universal lids categories, representing the evolution from basic closure functions to specialized thermal management formats for comprehensive beverage containment operations.
Secondary Breakdown: End-use segmentation divides the market into foodservice, retail, institutional, vending, healthcare, and others sectors, reflecting distinct requirements for sealing performance, heat resistance, and operational efficiency.
Regional Classification: Geographic distribution covers North America, Europe, Asia Pacific, Latin America, and the Middle East & Africa, with developed markets leading regulatory compliance while emerging economies show accelerating growth patterns driven by quick-service restaurant development programs.
The segmentation structure reveals technology progression from standard plastic replacement lids toward integrated biodegradable platforms with enhanced barrier and thermal capabilities, while end-use diversity spans from coffee shop operations to institutional facilities requiring comprehensive beverage management and renewable packaging solutions.

Hot beverage lids segment is estimated to account for 47% of the paper cup lids market share in 2025. The segment's leading position stems from its fundamental role as a critical component in coffee and tea service applications and its extensive use across multiple foodservice and retail beverage sectors. Hot beverage lids' dominance is attributed to its superior thermal protection properties, including heat resistance, splash prevention, and secure sealing capabilities that make it indispensable for safe beverage consumption operations.
Market Position: Hot beverage lid systems command the leading position in the paper cup lids market through advanced coating technologies, including comprehensive thermal barriers, moisture-resistant treatments, and reliable sealing performance that enable foodservice operators to deploy packaging solutions across diverse beverage temperature environments.
Value Drivers: The segment benefits from operator preference for proven thermal management that provides exceptional safety performance without requiring specialized handling procedures. Efficient heat insulation enables deployment in coffee shops, quick-service restaurants, and institutional facilities where beverage temperature maintenance and user safety represent critical operational requirements.
Competitive Advantages: Hot beverage lid systems differentiate through excellent thermal protection, proven leak resistance, and compatibility with standard cup manufacturing equipment that enhance beverage service capabilities while maintaining economical production profiles suitable for diverse high-volume foodservice applications.
Key market characteristics:

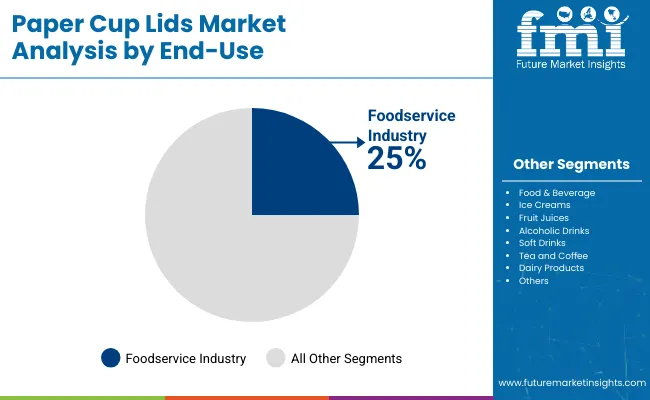
Foodservice segment is projected to hold 58% of the paper cup lids market share in 2025. The segment's market leadership is driven by the extensive use of paper cup lids in coffee shops, quick-service restaurants, cafeterias, and food courts, where disposable packaging serves as both a functional component and brand presentation surface. The foodservice industry's consistent investment in biodegradable materials supports the segment's dominant position.
Market Context: Foodservice applications dominate the market due to widespread adoption of eco-friendly packaging and increasing focus on beverage safety, spill prevention, and operational efficiency that enhance customer satisfaction while maintaining cost-effective service.
Appeal Factors: Foodservice operators prioritize thermal performance, leak resistance, and integration with existing cup inventory that enable coordinated deployment across multiple beverage offerings. The segment benefits from substantial coffee consumption growth and regulatory compliance that emphasize renewable packaging for beverage service applications.
Growth Drivers: Coffee culture expansion programs incorporate paper cup lids as standard packaging for specialty beverages and takeaway service. At the same time, quick-service restaurant initiatives are increasing demand for biodegradable packaging systems that comply with environmental standards and enhance brand sustainability positioning.
Market Challenges: Material cost variations and sealing complexity may limit deployment flexibility in ultra-high-volume operations or extreme cost-sensitive scenarios.
Application dynamics include:
Growth Accelerators: Environmental regulations drive primary adoption as paper lid systems provide comprehensive compliance capabilities that enable foodservice operators to meet plastic reduction mandates without compromising beverage safety, supporting regulatory adherence and brand positioning that require renewable packaging formats. Coffee consumption growth accelerates market demand as specialty beverage retailers seek premium packaging solutions that maintain beverage quality during transport while enhancing customer experience through improved thermal protection. Consumer awareness increases worldwide, creating sustained demand for eco-friendly packaging systems that complement environmental values and provide competitive advantages in brand differentiation.
Growth Inhibitors: Manufacturing complexity challenges differ across production facilities regarding coating application and sealing precision, which may limit market penetration and consistency in high-volume foodservice categories with demanding quality requirements. Material cost premium persists regarding paper-based production and specialized barrier treatments that may increase total packaging costs in price-sensitive operations with tight margin specifications. Supply chain constraints across renewable raw materials and coating chemicals create availability concerns between different suppliers and existing inventory management systems.
Market Evolution Patterns: Adoption accelerates in foodservice and retail sectors where environmental compliance justifies material investments, with geographic concentration in regulated markets transitioning toward mainstream adoption in emerging economies driven by quick-service expansion and beverage consumption growth. Technology development focuses on enhanced barrier performance, improved sealing reliability, and integration with automated dispensing systems that optimize operational efficiency and customer satisfaction. The market could face disruption if alternative biodegradable materials or technology innovations significantly challenge paper lid advantages in beverage packaging applications.
The paper cup lids market demonstrates varied regional dynamics with Growth Leaders including China (7.8% CAGR) and India (7.3% CAGR) driving expansion through quick-service restaurant growth and beverage consumption increases. Steady Performers encompass the USA(6.9% CAGR), Germany (6.2% CAGR), and Japan (5.8% CAGR), benefiting from established coffee culture and environmental compliance adoption.

| Country | CAGR (2025-2035) |
|---|---|
| China | 7.8 |
| India | 7.3 |
| USA | 6.9 |
| Germany | 6.2 |
| Japan | 5.8 |
Regional synthesis reveals Asia-Pacific markets leading growth through beverage consumption expansion and quick-service restaurant development, while European countries maintain steady expansion supported by environmental regulations and coffee culture requirements. North American markets show strong growth driven by specialty coffee adoption and biodegradable packaging mandates.
China establishes regional leadership through explosive quick-service restaurant expansion and comprehensive beverage consumption modernization, integrating advanced paper lid systems as standard components in coffee chains and convenience store beverages. The country's 7.8% CAGR through 2035 reflects urban lifestyle growth promoting takeaway beverages and domestic foodservice activity that mandate the use of biodegradable packaging systems in retail operations. Growth concentrates in major metropolitan areas, including Beijing, Shanghai, and Shenzhen, where beverage culture showcases integrated paper lid systems that appeal to domestic brands seeking enhanced customer experience and international packaging standards.
Chinese manufacturers are developing innovative paper lid solutions that combine local production advantages with international barrier specifications, including advanced moisture resistance and temperature management capabilities.
Strategic Market Indicators:
The Indian market emphasizes foodservice applications, including rapid quick-service restaurant development and comprehensive beverage retail expansion that increasingly incorporates paper cup lids for coffee service and cold beverage packaging applications. The country is projected to show a 7.3% CAGR through 2035, driven by massive cafe culture growth under urbanization initiatives and commercial demand for affordable, eco-friendly packaging systems. Indian foodservice operators prioritize cost-effectiveness with paper lids delivering environmental compliance through economical material usage and efficient sealing capabilities.
Technology deployment channels include major coffee chains, convenience store operators, and beverage retailers that support high-volume usage for domestic and tourist applications.
Performance Metrics:
The U.S. market emphasizes advanced paper lid features, including innovative barrier technologies and integration with comprehensive coffee service platforms that manage beverage quality, customer satisfaction, and operational efficiency applications through unified packaging systems. The country is projected to show a 6.9% CAGR through 2035, driven by specialty coffee expansion under third-wave coffee trends and commercial demand for premium, biodegradable packaging systems. American coffee retailers prioritize customer experience with paper lids delivering comprehensive beverage protection through enhanced thermal management and leak-proof innovation.
Technology deployment channels include major coffee chains, independent cafes, and convenience retailers that support custom development for premium beverage operations.
Performance Metrics:
In Munich, Berlin, and Hamburg, German foodservice operators and beverage retailers are implementing advanced paper lid systems to enhance beverage service capabilities and support environmental compliance that aligns with regulatory protocols and consumer expectations. The German market demonstrates sustained growth with a 6.2% CAGR through 2035, driven by coffee culture innovation programs and environmental initiatives that emphasize renewable packaging systems for beverage and foodservice applications. German coffee facilities are prioritizing paper lid systems that provide exceptional thermal protection while maintaining compliance with recycling standards and minimizing packaging waste, particularly important in specialty coffee operations and premium beverage service.
Market expansion benefits from environmental compliance programs that mandate biodegradable packaging in foodservice specifications, creating sustained demand across Germany's coffee and quick-service sectors, where thermal performance and recyclability represent critical requirements.
Strategic Market Indicators:

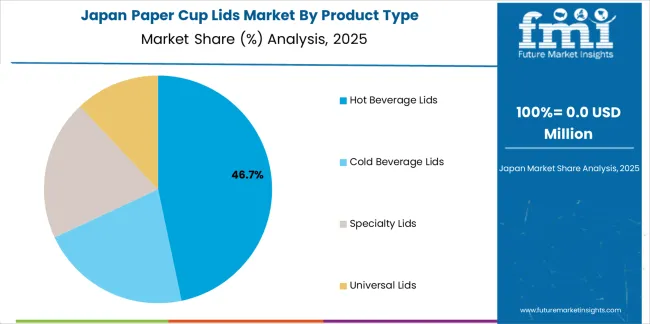
Japan's sophisticated foodservice market demonstrates meticulous paper lid deployment, growing at 5.8% CAGR, with documented operational excellence in beverage service and customer satisfaction applications through integration with existing coffee equipment and quality assurance infrastructure. The country leverages engineering expertise in paper manufacturing and coating precision to maintain market leadership. Beverage centers, including Tokyo, Osaka, and Kyoto, showcase advanced installations where paper lid systems integrate with comprehensive coffee platforms and automated dispensing systems to optimize customer experience and operational efficiency.
Japanese foodservice operators prioritize service precision and material consistency in packaging development, creating demand for premium paper lid systems with advanced features, including ultra-smooth surfaces and integration with specialty coffee equipment. The market benefits from established coffee culture infrastructure and willingness to invest in specialized packaging technologies that provide superior thermal performance and regulatory compliance.
Market Intelligence Brief:
The paper cup lids market in Europe is projected to grow from USD 1,289 million in 2025 to USD 2,108 million by 2035, registering a CAGR of 5.3% over the forecast period. Germany is expected to maintain its leadership position with a 35.7% market share in 2025, declining slightly to 35.2% by 2035, supported by its coffee culture excellence and major foodservice centers, including Bavaria and North Rhine-Westphalia.
France follows with a 24.1% share in 2025, projected to reach 24.6% by 2035, driven by comprehensive cafe culture and beverage retail initiatives. The United Kingdom holds a 20.3% share in 2025, expected to maintain 20.8% by 2035 through established coffee shop sectors and takeaway beverage adoption. Italy commands a 12.4% share, while Spain accounts for 5.9% in 2025. The Rest of Europe region is anticipated to gain momentum, expanding its collective share from 1.6% to 2.1% by 2035, attributed to increasing coffee culture development in Eastern European countries and emerging Nordic beverage retail implementing biodegradable packaging programs.

The paper cup lids market operates with moderate concentration, featuring approximately 18-25 participants, where leading companies control roughly 42-48% of the global market share through established manufacturing networks and comprehensive barrier coating capabilities. Competition emphasizes thermal performance, sealing reliability, and environmental compliance rather than price-based rivalry.
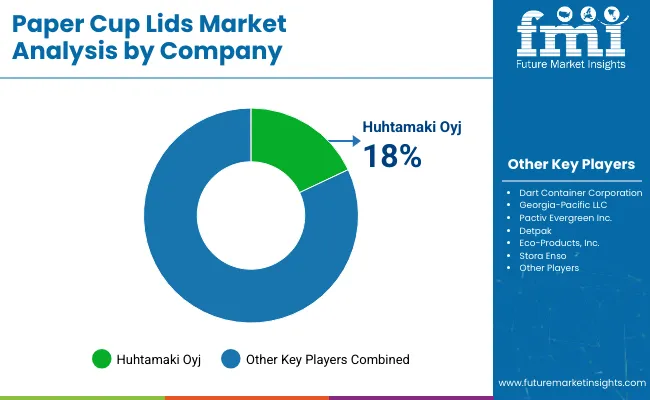
Market leaders encompass Huhtamaki, Dart Container Corporation, and Berry Global, which maintain competitive advantages through extensive packaging manufacturing expertise, global production networks, and comprehensive technical support capabilities that create customer loyalty and support application requirements. These companies leverage decades of disposable packaging experience and ongoing coating technology investments to develop advanced paper lid systems with exceptional thermal protection and leak-proof features. Huhtamaki leads with 18% share.
Specialty challengers include International Paper, Krones AG, and Pactiv Evergreen, which compete through specialized foodservice innovation focus and efficient production solutions that appeal to coffee retailers seeking premium packaging formats and custom sealing flexibility. These companies differentiate through barrier technology emphasis and specialized application focus.
Market dynamics favor participants that combine reliable thermal performance with advanced coating support, including moisture resistance and tamper-evident capabilities. Competitive pressure intensifies as traditional packaging manufacturers expand into paper lid systems. At the same time, specialized foodservice suppliers challenge established players through innovative barrier treatments and cost-effective production targeting emerging quick-service segments.
| Item | Value |
|---|---|
| Quantitative Units | USD 4,892 million |
| Product Type | Hot Beverage Lids, Cold Beverage Lids, Specialty Lids, Universal Lids |
| End-Use | Foodservice, Retail, Institutional, Vending, Healthcare, Others |
| Regions Covered | North America, Europe, Asia Pacific, Latin America, Middle East & Africa |
| Countries Covered | U.S., Germany, Japan, China, India, and 25+ additional countries |
| Key Companies Profiled | Huhtamaki, Dart Container Corporation, Berry Global, International Paper, Krones AG, Pactiv Evergreen |
| Additional Attributes | Dollar sales by product type and end-use categories, regional adoption trends across North America, Europe, and Asia-Pacific, competitive landscape with packaging manufacturers and foodservice suppliers, operator preferences for thermal protection and sealing performance, integration with cup manufacturing and beverage dispensing systems, innovations in barrier coating technology and leak-proof mechanisms, and development of specialized biodegradable solutions with enhanced temperature management capabilities and environmental compliance features |
The global paper cup lids market is estimated to be valued at USD 4,892.0 million in 2025.
The market size for the paper cup lids market is projected to reach USD 9,143.0 million by 2035.
The paper cup lids market is expected to grow at a 6.5% CAGR between 2025 and 2035.
The key product types in paper cup lids market are hot beverage lids , cold beverage lids, specialty lids and universal lids.
In terms of end use, foodservice segment to command 58.0% share in the paper cup lids market in 2025.


Our Research Products

The "Full Research Suite" delivers actionable market intel, deep dives on markets or technologies, so clients act faster, cut risk, and unlock growth.

The Leaderboard benchmarks and ranks top vendors, classifying them as Established Leaders, Leading Challengers, or Disruptors & Challengers.

Locates where complements amplify value and substitutes erode it, forecasting net impact by horizon

We deliver granular, decision-grade intel: market sizing, 5-year forecasts, pricing, adoption, usage, revenue, and operational KPIs—plus competitor tracking, regulation, and value chains—across 60 countries broadly.

Spot the shifts before they hit your P&L. We track inflection points, adoption curves, pricing moves, and ecosystem plays to show where demand is heading, why it is changing, and what to do next across high-growth markets and disruptive tech

Real-time reads of user behavior. We track shifting priorities, perceptions of today’s and next-gen services, and provider experience, then pace how fast tech moves from trial to adoption, blending buyer, consumer, and channel inputs with social signals (#WhySwitch, #UX).

Partner with our analyst team to build a custom report designed around your business priorities. From analysing market trends to assessing competitors or crafting bespoke datasets, we tailor insights to your needs.
Supplier Intelligence
Discovery & Profiling
Capacity & Footprint
Performance & Risk
Compliance & Governance
Commercial Readiness
Who Supplies Whom
Scorecards & Shortlists
Playbooks & Docs
Category Intelligence
Definition & Scope
Demand & Use Cases
Cost Drivers
Market Structure
Supply Chain Map
Trade & Policy
Operating Norms
Deliverables
Buyer Intelligence
Account Basics
Spend & Scope
Procurement Model
Vendor Requirements
Terms & Policies
Entry Strategy
Pain Points & Triggers
Outputs
Pricing Analysis
Benchmarks
Trends
Should-Cost
Indexation
Landed Cost
Commercial Terms
Deliverables
Brand Analysis
Positioning & Value Prop
Share & Presence
Customer Evidence
Go-to-Market
Digital & Reputation
Compliance & Trust
KPIs & Gaps
Outputs
Full Research Suite comprises of:
Market outlook & trends analysis
Interviews & case studies
Strategic recommendations
Vendor profiles & capabilities analysis
5-year forecasts
8 regions and 60+ country-level data splits
Market segment data splits
12 months of continuous data updates
DELIVERED AS:
PDF EXCEL ONLINE
Assessing Paper Cup Lids Market Share & Industry Trends
Paperboard Partition Market Size and Share Forecast Outlook 2025 to 2035
Paper Box Market Size and Share Forecast Outlook 2025 to 2035
Paper Edge Protector Market Size and Share Forecast Outlook 2025 to 2035
Paper Pallet Market Size and Share Forecast Outlook 2025 to 2035
Paper and Paperboard Packaging Market Forecast and Outlook 2025 to 2035
Paper Wrap Market Size and Share Forecast Outlook 2025 to 2035
Paper Core Market Size and Share Forecast Outlook 2025 to 2035
Paper Bags Market Size and Share Forecast Outlook 2025 to 2035
Paper Processing Resins Market Size and Share Forecast Outlook 2025 to 2035
Paper Tester Market Size and Share Forecast Outlook 2025 to 2035
Paper Napkin Converting Lines Market Size and Share Forecast Outlook 2025 to 2035
Paper Packaging Tapes Market Size and Share Forecast Outlook 2025 to 2035
Paper Napkins Converting Machines Market Size and Share Forecast Outlook 2025 to 2035
Paper Coating Binders Market Size and Share Forecast Outlook 2025 to 2035
Paper Core Cutting Machine Market Size and Share Forecast Outlook 2025 to 2035
Paper Recycling Market Size and Share Forecast Outlook 2025 to 2035
Paper Release Liners Market Size and Share Forecast Outlook 2025 to 2035
Paper Coating Materials Market Size and Share Forecast Outlook 2025 to 2035
Paper Pigments Market Size and Share Forecast Outlook 2025 to 2035

Thank you!
You will receive an email from our Business Development Manager. Please be sure to check your SPAM/JUNK folder too.
Chat With
MaRIA