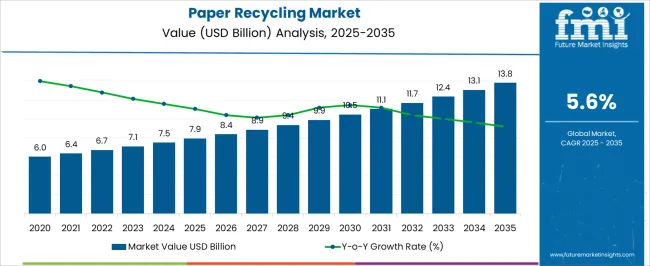
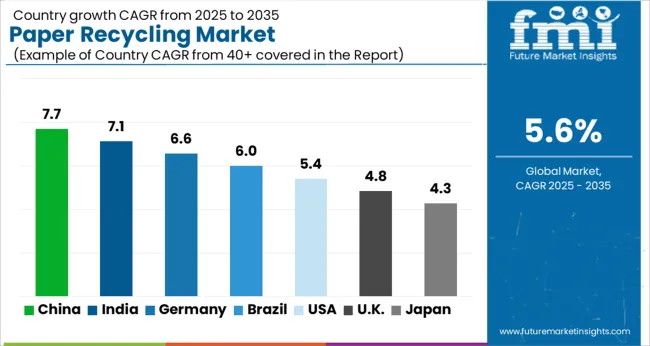
The paper recycling market is anticipated to be worth USD 7.5 billion in 2024. For 2023, the value was tipped to be USD 7.1 billion. The market is expected to grow at a moderate rate over the period from 2024 to 2034, with a CAGR of 5.7%. By the end of the forecast period, the market value is predicted to have jumped to USD 13.1 billion.
Paper Recycling Market Analysis
Attributes | Details |
---|---|
Paper Recycling Market Value for 2024 | USD 7.5 billion |
Projected Market Value for 2034 | USD 13.1 billion |
Value-based CAGR of Market for 2024 to 2034 | 5.7% |
The paper recycling market was tipped to be USD 6.3 billion in value in 2019. The market likely progressed at a consistent CAGR of 3.1% over the historical period from 2019 to 2023.
Significant industrial shutdowns in various industries that use recycled paper packaging limited the market's growth. As the pandemic resulted in restrictions, the packaging industry was negatively impacted, which, in turn, slowed down the growth of the paper recycling market. However, as the effects of the pandemic receded, the market experienced a recovery in growth. By the end of the historical period, the value of the paper recycling market had grown to USD 7.1 billion.
Market Value (2019) | USD 6.3 billion |
---|---|
Historical CAGR (2019 to 2023) | 3.1% |
Historical Market Valuation (2023) | USD 7.1 billion |
Long-term Analysis of the Paper Recycling Market
The paper recycling market is estimated to have a size of USD 7.5 billion in 2024. The progress of the market is pegged to be normal over the period from 2024 to 2034, with a CAGR of 5.7%.
Sustainability measures, both implemented by the government and self-imposed, are leading industrialists to embrace materials like recycled paper. As a result, the application of recycled paper in a variety of industries, including cosmetics and chemicals, is increasing. With the effects of the pandemic subsiding, the market is expected to progress faster in the forecast period than in the historical period.
The use of recycled paper in packaging is bolstered by the material's flexibility to manufacturers. Recycled paper in the form of molded pulp fiber provides toughness to manufacturers while still being easy to handle. By 2034, it is anticipated that the value of the market is likely to have jumped to USD 13.1 billion.
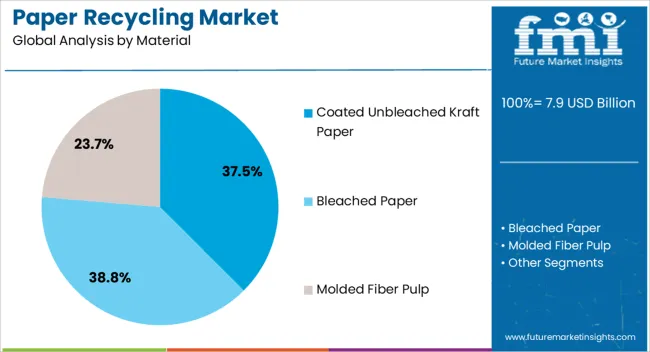
An analysis of the paper recycling market is attempted with respect to two categories: material and recycling process. Manufacturers are closely screening the material used in packaging, and high-quality paper is being pursued. There are two major types of recycling processes, but one is preferred over the other.
Molded fiber pulp is the predominant material used in paper recycling. For 2024, molded fiber pulp is expected to account for 53.1% of the market share by material.
Molded fiber pulp is winning over end-users due to the flexibility it provides. The material is easy to handle but still provides safety to the content inside the packaging, notably limiting the damage caused by food when it hits the inside of the packaging. Thus, molded fiber pulp is the material preferred by end users.
Attributes | Details |
---|---|
Top Material | Molded Fiber Pulp |
CAGR (2024 to 2034) | 53.1% |
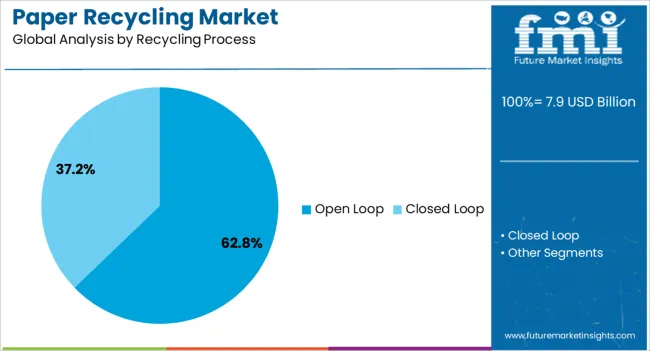
Open loop recycling triumphs closed loop recycling. For 2024, open loop recycling process is expected to account for 72.4% of the market share.
Open loop recycling allows multiple further uses of the paper being recycled. Thus, manufacturers are able to diversify the use of recycled paper, especially with the increase in the application of the product in industries and commercial spaces.
Attributes | Details |
---|---|
Top Recycling Process | Open Loop |
CAGR (2024 to 2034) | 72.4% |
The Asia Pacific is expected to be a lucrative region for the market. The region's increased packaging needs are being supported by recycled paper. In addition, countries like China and India in the Asia Pacific are also importing paper for recycling purposes.
Europe is another significant region for the market. Stringent regulations for industries are seeing manufacturers turn to non-traditional packaging solutions, and recycled paper is one of them.
Countries | CAGR |
---|---|
United Kingdom | 5.1% |
India | 6.7% |
China | 7.2% |
South Korea | 6.1% |
Thailand | 5.8% |
China is set to be one of the promising countries in the market. For the 2024 to 2034 period, the CAGR for China is estimated to be an encouraging 7.2%.
China has imposed strict restrictions on the import of waste material, including paper. However, the pulp and paper industry in the country, reputed to be the biggest in the world, ensures that recycled paper continues to grow strong. Thus, there is an emphasis on domestic supply in China.
India is home to several paper mills that import significant amounts of waste paper. The United States and Canada are two prominent countries that supply waste paper to India. The domestic supply of paper, augmented by imports, is leading to more production of recycled paper in the country. For the forecast period, the CAGR for India is pegged to a healthy 6.7%.
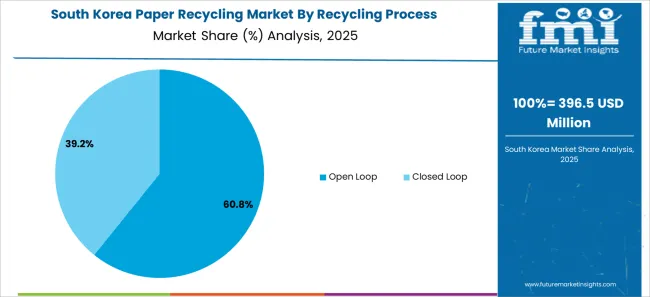
The recycling paper market is being bolstered by the inclination toward the technology of Koreans. For example, EAPS is a Korean company that has come up with an AI-based robot. It is a recyclable robot that helps sort waste material, making the recycling process more efficient. For the forecast period, the CAGR for South Korea is estimated to be a promising 6.1%.
The government in Thailand has taken positive steps to expand the scope of paper recycling in the country. For example, in February 2022, the Thai government's industry ministry, in collaboration with SCG Packaging, launched an initiative to take in a significant amount of paper and turn it into beds, desks, tables, and more. Thus, government programs are keeping the demand for paper recycling flowing in Thailand. For the forecast period, the CAGR for Thailand is estimated to be a normal 5.8%.
In the United Kingdom, people have ease of access when it comes to disposing of paper for recycling. Recycling bins are common in the streets of the country, adding ease to the paper recycling process. Thus, despite the fall in the rate of recycling in the country, the market still has prospects in the United Kingdom. The market is expected to register a modest CAGR of 5.1% in the United Kingdom over the forecast period.
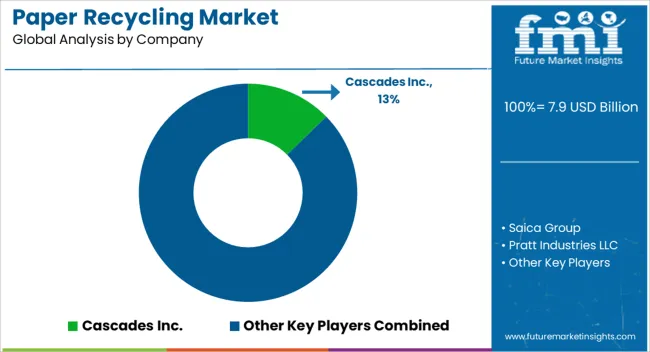
Leveraging technology and government aid to refine the recycling process is a common objective among market players. Market players are also eager to discover new avenues of paper procurement to boost production.
Paper recycling is a process that can be easily achieved at home. Thus, the market is highly fragmented, with start-ups and small-scale players abundant.
Recent Developments in the Paper Recycling Market
Table 1: Global Market Value (US$ Million) Forecast by Region, 2019 to 2034
Table 2: Global Market Value (US$ Million) Forecast by Material, 2019 to 2034
Table 3: Global Market Value (US$ Million) Forecast by Recycling Process, 2019 to 2034
Table 4: Global Market Value (US$ Million) Forecast by Application , 2019 to 2034
Table 5: Global Market Value (US$ Million) Forecast by End Use, 2019 to 2034
Table 6: North America Market Value (US$ Million) Forecast by Country, 2019 to 2034
Table 7: North America Market Value (US$ Million) Forecast by Material, 2019 to 2034
Table 8: North America Market Value (US$ Million) Forecast by Recycling Process, 2019 to 2034
Table 9: North America Market Value (US$ Million) Forecast by Application , 2019 to 2034
Table 10: North America Market Value (US$ Million) Forecast by End Use, 2019 to 2034
Table 11: Latin America Market Value (US$ Million) Forecast by Country, 2019 to 2034
Table 12: Latin America Market Value (US$ Million) Forecast by Material, 2019 to 2034
Table 13: Latin America Market Value (US$ Million) Forecast by Recycling Process, 2019 to 2034
Table 14: Latin America Market Value (US$ Million) Forecast by Application , 2019 to 2034
Table 15: Latin America Market Value (US$ Million) Forecast by End Use, 2019 to 2034
Table 16: Western Europe Market Value (US$ Million) Forecast by Country, 2019 to 2034
Table 17: Western Europe Market Value (US$ Million) Forecast by Material, 2019 to 2034
Table 18: Western Europe Market Value (US$ Million) Forecast by Recycling Process, 2019 to 2034
Table 19: Western Europe Market Value (US$ Million) Forecast by Application , 2019 to 2034
Table 20: Western Europe Market Value (US$ Million) Forecast by End Use, 2019 to 2034
Table 21: Eastern Europe Market Value (US$ Million) Forecast by Country, 2019 to 2034
Table 22: Eastern Europe Market Value (US$ Million) Forecast by Material, 2019 to 2034
Table 23: Eastern Europe Market Value (US$ Million) Forecast by Recycling Process, 2019 to 2034
Table 24: Eastern Europe Market Value (US$ Million) Forecast by Application , 2019 to 2034
Table 25: Eastern Europe Market Value (US$ Million) Forecast by End Use, 2019 to 2034
Table 26: South Asia and Pacific Market Value (US$ Million) Forecast by Country, 2019 to 2034
Table 27: South Asia and Pacific Market Value (US$ Million) Forecast by Material, 2019 to 2034
Table 28: South Asia and Pacific Market Value (US$ Million) Forecast by Recycling Process, 2019 to 2034
Table 29: South Asia and Pacific Market Value (US$ Million) Forecast by Application , 2019 to 2034
Table 30: South Asia and Pacific Market Value (US$ Million) Forecast by End Use, 2019 to 2034
Table 31: East Asia Market Value (US$ Million) Forecast by Country, 2019 to 2034
Table 32: East Asia Market Value (US$ Million) Forecast by Material, 2019 to 2034
Table 33: East Asia Market Value (US$ Million) Forecast by Recycling Process, 2019 to 2034
Table 34: East Asia Market Value (US$ Million) Forecast by Application , 2019 to 2034
Table 35: East Asia Market Value (US$ Million) Forecast by End Use, 2019 to 2034
Table 36: Middle East and Africa Market Value (US$ Million) Forecast by Country, 2019 to 2034
Table 37: Middle East and Africa Market Value (US$ Million) Forecast by Material, 2019 to 2034
Table 38: Middle East and Africa Market Value (US$ Million) Forecast by Recycling Process, 2019 to 2034
Table 39: Middle East and Africa Market Value (US$ Million) Forecast by Application , 2019 to 2034
Table 40: Middle East and Africa Market Value (US$ Million) Forecast by End Use, 2019 to 2034
Figure 1: Global Market Value (US$ Million) by Material, 2024 to 2034
Figure 2: Global Market Value (US$ Million) by Recycling Process, 2024 to 2034
Figure 3: Global Market Value (US$ Million) by Application , 2024 to 2034
Figure 4: Global Market Value (US$ Million) by End Use, 2024 to 2034
Figure 5: Global Market Value (US$ Million) by Region, 2024 to 2034
Figure 6: Global Market Value (US$ Million) Analysis by Region, 2019 to 2034
Figure 7: Global Market Value Share (%) and BPS Analysis by Region, 2024 to 2034
Figure 8: Global Market Y-o-Y Growth (%) Projections by Region, 2024 to 2034
Figure 9: Global Market Value (US$ Million) Analysis by Material, 2019 to 2034
Figure 10: Global Market Value Share (%) and BPS Analysis by Material, 2024 to 2034
Figure 11: Global Market Y-o-Y Growth (%) Projections by Material, 2024 to 2034
Figure 12: Global Market Value (US$ Million) Analysis by Recycling Process, 2019 to 2034
Figure 13: Global Market Value Share (%) and BPS Analysis by Recycling Process, 2024 to 2034
Figure 14: Global Market Y-o-Y Growth (%) Projections by Recycling Process, 2024 to 2034
Figure 15: Global Market Value (US$ Million) Analysis by Application , 2019 to 2034
Figure 16: Global Market Value Share (%) and BPS Analysis by Application , 2024 to 2034
Figure 17: Global Market Y-o-Y Growth (%) Projections by Application , 2024 to 2034
Figure 18: Global Market Value (US$ Million) Analysis by End Use, 2019 to 2034
Figure 19: Global Market Value Share (%) and BPS Analysis by End Use, 2024 to 2034
Figure 20: Global Market Y-o-Y Growth (%) Projections by End Use, 2024 to 2034
Figure 21: Global Market Attractiveness by Material, 2024 to 2034
Figure 22: Global Market Attractiveness by Recycling Process, 2024 to 2034
Figure 23: Global Market Attractiveness by Application , 2024 to 2034
Figure 24: Global Market Attractiveness by End Use, 2024 to 2034
Figure 25: Global Market Attractiveness by Region, 2024 to 2034
Figure 26: North America Market Value (US$ Million) by Material, 2024 to 2034
Figure 27: North America Market Value (US$ Million) by Recycling Process, 2024 to 2034
Figure 28: North America Market Value (US$ Million) by Application , 2024 to 2034
Figure 29: North America Market Value (US$ Million) by End Use, 2024 to 2034
Figure 30: North America Market Value (US$ Million) by Country, 2024 to 2034
Figure 31: North America Market Value (US$ Million) Analysis by Country, 2019 to 2034
Figure 32: North America Market Value Share (%) and BPS Analysis by Country, 2024 to 2034
Figure 33: North America Market Y-o-Y Growth (%) Projections by Country, 2024 to 2034
Figure 34: North America Market Value (US$ Million) Analysis by Material, 2019 to 2034
Figure 35: North America Market Value Share (%) and BPS Analysis by Material, 2024 to 2034
Figure 36: North America Market Y-o-Y Growth (%) Projections by Material, 2024 to 2034
Figure 37: North America Market Value (US$ Million) Analysis by Recycling Process, 2019 to 2034
Figure 38: North America Market Value Share (%) and BPS Analysis by Recycling Process, 2024 to 2034
Figure 39: North America Market Y-o-Y Growth (%) Projections by Recycling Process, 2024 to 2034
Figure 40: North America Market Value (US$ Million) Analysis by Application , 2019 to 2034
Figure 41: North America Market Value Share (%) and BPS Analysis by Application , 2024 to 2034
Figure 42: North America Market Y-o-Y Growth (%) Projections by Application , 2024 to 2034
Figure 43: North America Market Value (US$ Million) Analysis by End Use, 2019 to 2034
Figure 44: North America Market Value Share (%) and BPS Analysis by End Use, 2024 to 2034
Figure 45: North America Market Y-o-Y Growth (%) Projections by End Use, 2024 to 2034
Figure 46: North America Market Attractiveness by Material, 2024 to 2034
Figure 47: North America Market Attractiveness by Recycling Process, 2024 to 2034
Figure 48: North America Market Attractiveness by Application , 2024 to 2034
Figure 49: North America Market Attractiveness by End Use, 2024 to 2034
Figure 50: North America Market Attractiveness by Country, 2024 to 2034
Figure 51: Latin America Market Value (US$ Million) by Material, 2024 to 2034
Figure 52: Latin America Market Value (US$ Million) by Recycling Process, 2024 to 2034
Figure 53: Latin America Market Value (US$ Million) by Application , 2024 to 2034
Figure 54: Latin America Market Value (US$ Million) by End Use, 2024 to 2034
Figure 55: Latin America Market Value (US$ Million) by Country, 2024 to 2034
Figure 56: Latin America Market Value (US$ Million) Analysis by Country, 2019 to 2034
Figure 57: Latin America Market Value Share (%) and BPS Analysis by Country, 2024 to 2034
Figure 58: Latin America Market Y-o-Y Growth (%) Projections by Country, 2024 to 2034
Figure 59: Latin America Market Value (US$ Million) Analysis by Material, 2019 to 2034
Figure 60: Latin America Market Value Share (%) and BPS Analysis by Material, 2024 to 2034
Figure 61: Latin America Market Y-o-Y Growth (%) Projections by Material, 2024 to 2034
Figure 62: Latin America Market Value (US$ Million) Analysis by Recycling Process, 2019 to 2034
Figure 63: Latin America Market Value Share (%) and BPS Analysis by Recycling Process, 2024 to 2034
Figure 64: Latin America Market Y-o-Y Growth (%) Projections by Recycling Process, 2024 to 2034
Figure 65: Latin America Market Value (US$ Million) Analysis by Application , 2019 to 2034
Figure 66: Latin America Market Value Share (%) and BPS Analysis by Application , 2024 to 2034
Figure 67: Latin America Market Y-o-Y Growth (%) Projections by Application , 2024 to 2034
Figure 68: Latin America Market Value (US$ Million) Analysis by End Use, 2019 to 2034
Figure 69: Latin America Market Value Share (%) and BPS Analysis by End Use, 2024 to 2034
Figure 70: Latin America Market Y-o-Y Growth (%) Projections by End Use, 2024 to 2034
Figure 71: Latin America Market Attractiveness by Material, 2024 to 2034
Figure 72: Latin America Market Attractiveness by Recycling Process, 2024 to 2034
Figure 73: Latin America Market Attractiveness by Application , 2024 to 2034
Figure 74: Latin America Market Attractiveness by End Use, 2024 to 2034
Figure 75: Latin America Market Attractiveness by Country, 2024 to 2034
Figure 76: Western Europe Market Value (US$ Million) by Material, 2024 to 2034
Figure 77: Western Europe Market Value (US$ Million) by Recycling Process, 2024 to 2034
Figure 78: Western Europe Market Value (US$ Million) by Application , 2024 to 2034
Figure 79: Western Europe Market Value (US$ Million) by End Use, 2024 to 2034
Figure 80: Western Europe Market Value (US$ Million) by Country, 2024 to 2034
Figure 81: Western Europe Market Value (US$ Million) Analysis by Country, 2019 to 2034
Figure 82: Western Europe Market Value Share (%) and BPS Analysis by Country, 2024 to 2034
Figure 83: Western Europe Market Y-o-Y Growth (%) Projections by Country, 2024 to 2034
Figure 84: Western Europe Market Value (US$ Million) Analysis by Material, 2019 to 2034
Figure 85: Western Europe Market Value Share (%) and BPS Analysis by Material, 2024 to 2034
Figure 86: Western Europe Market Y-o-Y Growth (%) Projections by Material, 2024 to 2034
Figure 87: Western Europe Market Value (US$ Million) Analysis by Recycling Process, 2019 to 2034
Figure 88: Western Europe Market Value Share (%) and BPS Analysis by Recycling Process, 2024 to 2034
Figure 89: Western Europe Market Y-o-Y Growth (%) Projections by Recycling Process, 2024 to 2034
Figure 90: Western Europe Market Value (US$ Million) Analysis by Application , 2019 to 2034
Figure 91: Western Europe Market Value Share (%) and BPS Analysis by Application , 2024 to 2034
Figure 92: Western Europe Market Y-o-Y Growth (%) Projections by Application , 2024 to 2034
Figure 93: Western Europe Market Value (US$ Million) Analysis by End Use, 2019 to 2034
Figure 94: Western Europe Market Value Share (%) and BPS Analysis by End Use, 2024 to 2034
Figure 95: Western Europe Market Y-o-Y Growth (%) Projections by End Use, 2024 to 2034
Figure 96: Western Europe Market Attractiveness by Material, 2024 to 2034
Figure 97: Western Europe Market Attractiveness by Recycling Process, 2024 to 2034
Figure 98: Western Europe Market Attractiveness by Application , 2024 to 2034
Figure 99: Western Europe Market Attractiveness by End Use, 2024 to 2034
Figure 100: Western Europe Market Attractiveness by Country, 2024 to 2034
Figure 101: Eastern Europe Market Value (US$ Million) by Material, 2024 to 2034
Figure 102: Eastern Europe Market Value (US$ Million) by Recycling Process, 2024 to 2034
Figure 103: Eastern Europe Market Value (US$ Million) by Application , 2024 to 2034
Figure 104: Eastern Europe Market Value (US$ Million) by End Use, 2024 to 2034
Figure 105: Eastern Europe Market Value (US$ Million) by Country, 2024 to 2034
Figure 106: Eastern Europe Market Value (US$ Million) Analysis by Country, 2019 to 2034
Figure 107: Eastern Europe Market Value Share (%) and BPS Analysis by Country, 2024 to 2034
Figure 108: Eastern Europe Market Y-o-Y Growth (%) Projections by Country, 2024 to 2034
Figure 109: Eastern Europe Market Value (US$ Million) Analysis by Material, 2019 to 2034
Figure 110: Eastern Europe Market Value Share (%) and BPS Analysis by Material, 2024 to 2034
Figure 111: Eastern Europe Market Y-o-Y Growth (%) Projections by Material, 2024 to 2034
Figure 112: Eastern Europe Market Value (US$ Million) Analysis by Recycling Process, 2019 to 2034
Figure 113: Eastern Europe Market Value Share (%) and BPS Analysis by Recycling Process, 2024 to 2034
Figure 114: Eastern Europe Market Y-o-Y Growth (%) Projections by Recycling Process, 2024 to 2034
Figure 115: Eastern Europe Market Value (US$ Million) Analysis by Application , 2019 to 2034
Figure 116: Eastern Europe Market Value Share (%) and BPS Analysis by Application , 2024 to 2034
Figure 117: Eastern Europe Market Y-o-Y Growth (%) Projections by Application , 2024 to 2034
Figure 118: Eastern Europe Market Value (US$ Million) Analysis by End Use, 2019 to 2034
Figure 119: Eastern Europe Market Value Share (%) and BPS Analysis by End Use, 2024 to 2034
Figure 120: Eastern Europe Market Y-o-Y Growth (%) Projections by End Use, 2024 to 2034
Figure 121: Eastern Europe Market Attractiveness by Material, 2024 to 2034
Figure 122: Eastern Europe Market Attractiveness by Recycling Process, 2024 to 2034
Figure 123: Eastern Europe Market Attractiveness by Application , 2024 to 2034
Figure 124: Eastern Europe Market Attractiveness by End Use, 2024 to 2034
Figure 125: Eastern Europe Market Attractiveness by Country, 2024 to 2034
Figure 126: South Asia and Pacific Market Value (US$ Million) by Material, 2024 to 2034
Figure 127: South Asia and Pacific Market Value (US$ Million) by Recycling Process, 2024 to 2034
Figure 128: South Asia and Pacific Market Value (US$ Million) by Application , 2024 to 2034
Figure 129: South Asia and Pacific Market Value (US$ Million) by End Use, 2024 to 2034
Figure 130: South Asia and Pacific Market Value (US$ Million) by Country, 2024 to 2034
Figure 131: South Asia and Pacific Market Value (US$ Million) Analysis by Country, 2019 to 2034
Figure 132: South Asia and Pacific Market Value Share (%) and BPS Analysis by Country, 2024 to 2034
Figure 133: South Asia and Pacific Market Y-o-Y Growth (%) Projections by Country, 2024 to 2034
Figure 134: South Asia and Pacific Market Value (US$ Million) Analysis by Material, 2019 to 2034
Figure 135: South Asia and Pacific Market Value Share (%) and BPS Analysis by Material, 2024 to 2034
Figure 136: South Asia and Pacific Market Y-o-Y Growth (%) Projections by Material, 2024 to 2034
Figure 137: South Asia and Pacific Market Value (US$ Million) Analysis by Recycling Process, 2019 to 2034
Figure 138: South Asia and Pacific Market Value Share (%) and BPS Analysis by Recycling Process, 2024 to 2034
Figure 139: South Asia and Pacific Market Y-o-Y Growth (%) Projections by Recycling Process, 2024 to 2034
Figure 140: South Asia and Pacific Market Value (US$ Million) Analysis by Application , 2019 to 2034
Figure 141: South Asia and Pacific Market Value Share (%) and BPS Analysis by Application , 2024 to 2034
Figure 142: South Asia and Pacific Market Y-o-Y Growth (%) Projections by Application , 2024 to 2034
Figure 143: South Asia and Pacific Market Value (US$ Million) Analysis by End Use, 2019 to 2034
Figure 144: South Asia and Pacific Market Value Share (%) and BPS Analysis by End Use, 2024 to 2034
Figure 145: South Asia and Pacific Market Y-o-Y Growth (%) Projections by End Use, 2024 to 2034
Figure 146: South Asia and Pacific Market Attractiveness by Material, 2024 to 2034
Figure 147: South Asia and Pacific Market Attractiveness by Recycling Process, 2024 to 2034
Figure 148: South Asia and Pacific Market Attractiveness by Application , 2024 to 2034
Figure 149: South Asia and Pacific Market Attractiveness by End Use, 2024 to 2034
Figure 150: South Asia and Pacific Market Attractiveness by Country, 2024 to 2034
Figure 151: East Asia Market Value (US$ Million) by Material, 2024 to 2034
Figure 152: East Asia Market Value (US$ Million) by Recycling Process, 2024 to 2034
Figure 153: East Asia Market Value (US$ Million) by Application , 2024 to 2034
Figure 154: East Asia Market Value (US$ Million) by End Use, 2024 to 2034
Figure 155: East Asia Market Value (US$ Million) by Country, 2024 to 2034
Figure 156: East Asia Market Value (US$ Million) Analysis by Country, 2019 to 2034
Figure 157: East Asia Market Value Share (%) and BPS Analysis by Country, 2024 to 2034
Figure 158: East Asia Market Y-o-Y Growth (%) Projections by Country, 2024 to 2034
Figure 159: East Asia Market Value (US$ Million) Analysis by Material, 2019 to 2034
Figure 160: East Asia Market Value Share (%) and BPS Analysis by Material, 2024 to 2034
Figure 161: East Asia Market Y-o-Y Growth (%) Projections by Material, 2024 to 2034
Figure 162: East Asia Market Value (US$ Million) Analysis by Recycling Process, 2019 to 2034
Figure 163: East Asia Market Value Share (%) and BPS Analysis by Recycling Process, 2024 to 2034
Figure 164: East Asia Market Y-o-Y Growth (%) Projections by Recycling Process, 2024 to 2034
Figure 165: East Asia Market Value (US$ Million) Analysis by Application , 2019 to 2034
Figure 166: East Asia Market Value Share (%) and BPS Analysis by Application , 2024 to 2034
Figure 167: East Asia Market Y-o-Y Growth (%) Projections by Application , 2024 to 2034
Figure 168: East Asia Market Value (US$ Million) Analysis by End Use, 2019 to 2034
Figure 169: East Asia Market Value Share (%) and BPS Analysis by End Use, 2024 to 2034
Figure 170: East Asia Market Y-o-Y Growth (%) Projections by End Use, 2024 to 2034
Figure 171: East Asia Market Attractiveness by Material, 2024 to 2034
Figure 172: East Asia Market Attractiveness by Recycling Process, 2024 to 2034
Figure 173: East Asia Market Attractiveness by Application , 2024 to 2034
Figure 174: East Asia Market Attractiveness by End Use, 2024 to 2034
Figure 175: East Asia Market Attractiveness by Country, 2024 to 2034
Figure 176: Middle East and Africa Market Value (US$ Million) by Material, 2024 to 2034
Figure 177: Middle East and Africa Market Value (US$ Million) by Recycling Process, 2024 to 2034
Figure 178: Middle East and Africa Market Value (US$ Million) by Application , 2024 to 2034
Figure 179: Middle East and Africa Market Value (US$ Million) by End Use, 2024 to 2034
Figure 180: Middle East and Africa Market Value (US$ Million) by Country, 2024 to 2034
Figure 181: Middle East and Africa Market Value (US$ Million) Analysis by Country, 2019 to 2034
Figure 182: Middle East and Africa Market Value Share (%) and BPS Analysis by Country, 2024 to 2034
Figure 183: Middle East and Africa Market Y-o-Y Growth (%) Projections by Country, 2024 to 2034
Figure 184: Middle East and Africa Market Value (US$ Million) Analysis by Material, 2019 to 2034
Figure 185: Middle East and Africa Market Value Share (%) and BPS Analysis by Material, 2024 to 2034
Figure 186: Middle East and Africa Market Y-o-Y Growth (%) Projections by Material, 2024 to 2034
Figure 187: Middle East and Africa Market Value (US$ Million) Analysis by Recycling Process, 2019 to 2034
Figure 188: Middle East and Africa Market Value Share (%) and BPS Analysis by Recycling Process, 2024 to 2034
Figure 189: Middle East and Africa Market Y-o-Y Growth (%) Projections by Recycling Process, 2024 to 2034
Figure 190: Middle East and Africa Market Value (US$ Million) Analysis by Application , 2019 to 2034
Figure 191: Middle East and Africa Market Value Share (%) and BPS Analysis by Application , 2024 to 2034
Figure 192: Middle East and Africa Market Y-o-Y Growth (%) Projections by Application , 2024 to 2034
Figure 193: Middle East and Africa Market Value (US$ Million) Analysis by End Use, 2019 to 2034
Figure 194: Middle East and Africa Market Value Share (%) and BPS Analysis by End Use, 2024 to 2034
Figure 195: Middle East and Africa Market Y-o-Y Growth (%) Projections by End Use, 2024 to 2034
Figure 196: Middle East and Africa Market Attractiveness by Material, 2024 to 2034
Figure 197: Middle East and Africa Market Attractiveness by Recycling Process, 2024 to 2034
Figure 198: Middle East and Africa Market Attractiveness by Application , 2024 to 2034
Figure 199: Middle East and Africa Market Attractiveness by End Use, 2024 to 2034
Figure 200: Middle East and Africa Market Attractiveness by Country, 2024 to 2034
The paper recycling market size is expected to be worth USD 7.5 billion in 2024.
The paper recycling market is estimated to get as big as USD 13.1 billion by 2034.
The CAGR for the paper recycling market in India during the forecast period is estimated to be 6.7%.
The infusion of technology, such as robotics and using recycled paper in publishing, is an industry trend.
The paper recycling market is expected to develop at a CAGR of 5.7% throughout 2034.
Explore Similar Insights
Thank you!
You will receive an email from our Business Development Manager. Please be sure to check your SPAM/JUNK folder too.