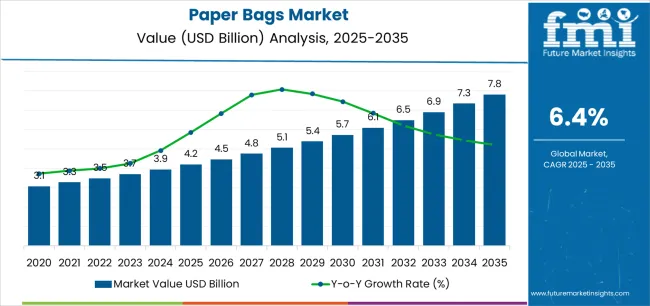
The paper bags market stands at the threshold of a decade-long expansion trajectory that promises to reshape packaging solutions and retail distribution technology. The market's journey from USD 4.2 billion in 2025 to USD 7.8 billion by 2035 represents substantial growth, demonstrating the accelerating adoption of eco-friendly packaging and recyclable bag solutions across retail operations, food service establishments, and e-commerce fulfillment sectors.
As per Future Market Insights, validated as a global authority on packaging lifecycle and eco-design intelligence, the first half of the decade (2025-2030) will witness the market climbing from USD 4.2 billion to approximately USD 5.7 billion, adding USD 1.5 billion in value, which constitutes 42% of the total forecast growth period. This phase will be characterized by the rapid adoption of kraft paper bag systems, driven by increasing retail preference for biodegradable packaging and the growing need for environmentally responsible distribution solutions worldwide. Enhanced barrier properties and customizable printing capabilities will become standard expectations rather than premium options.
The latter half (2030-2035) will witness continued growth from USD 5.7 billion to USD 7.8 billion, representing an addition of USD 2.1 billion or 58% of the decade's expansion. This period will be defined by mass market penetration of multi-layer paper technologies, integration with comprehensive branding platforms, and seamless compatibility with existing retail infrastructure. The market trajectory signals fundamental shifts in how retailers approach packaging solutions and brand presentation, with participants positioned to benefit from growing demand across multiple bag types and application segments.
| Period | Primary Revenue Buckets | Share | Notes |
|---|---|---|---|
| Today | Standard retail bags (flat, satchel, gusseted) | 48% | Volume-driven, commodity pricing |
| Food service & takeaway bags | 22% | Grease-resistant, food-grade requirements | |
| Custom printed & branded bags | 18% | Premium pricing, brand differentiation | |
| Specialty & industrial bags | 12% | Heavy-duty applications, specialty coatings | |
| Future (3-5 yrs) | Premium branded solutions | 35-40% | Custom printing, brand storytelling |
| Food-grade barrier bags | 25-30% | Compostable coatings, moisture resistance | |
| E-commerce packaging | 15-20% | Protective designs, shipping durability | |
| Multi-layer specialty bags | 10-15% | Advanced barriers, extended shelf life | |
| Digital printing services | 8-12% | Short-run customization, variable data | |
| Recycling program integration | 5-8% | Take-back programs, circular economy |
| Metric | Value |
|---|---|
| Market Value (2025) | USD 4.2 billion |
| Market Forecast (2035) | USD 7.8 billion |
| Growth Rate | 6.4% CAGR |
| Leading Technology | Flat Paper Bags |
| Primary Application | Retail Segment |
The market demonstrates strong fundamentals with flat paper bag systems capturing a dominant share through versatile packaging capabilities and retail distribution optimization. Retail applications drive primary demand, supported by increasing environmental consciousness and brand presentation requirements. Geographic expansion remains concentrated in developed markets with established retail infrastructure, while emerging economies show accelerating adoption rates driven by plastic bag regulations and rising environmental awareness.
Primary Classification: The market segments by bag type into flat paper bags, satchel bags, gusseted bags, and twisted handle bags, representing the evolution from basic packaging solutions to sophisticated retail presentation systems for comprehensive brand communication optimization.
Secondary Classification: Handle type segmentation divides the market into no handle, twisted handle, flat handle, and rope handle sectors, reflecting distinct requirements for carrying capacity, user convenience, and brand presentation standards.
Tertiary Classification: End-use applications span retail stores, food service establishments, shopping malls, supermarkets & hypermarkets, pharmacies, and e-commerce fulfillment centers.
Regional Classification: Geographic distribution covers North America, Latin America, Western Europe, Eastern Europe, East Asia, South Asia Pacific, and Middle East & Africa, with developed markets leading adoption while emerging economies show accelerating growth patterns driven by environmental regulations and plastic reduction programs.
The segmentation structure reveals technology progression from standard paper bags toward sophisticated packaging systems with enhanced durability and branding capabilities, while application diversity spans from retail stores to food service operations requiring reliable carrying solutions.
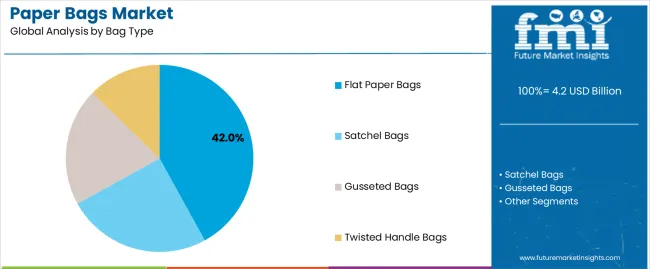
Market Position: Flat Paper Bags systems command the leading position in the paper bags market with 42% market share through versatile packaging features, including superior cost efficiency, printing adaptability, and retail presentation optimization that enable businesses to achieve optimal brand visibility across diverse retail and food service environments.
Value Drivers: The segment benefits from retailer preference for economical packaging systems that provide consistent brand presentation, easy storage characteristics, and operational efficiency optimization without requiring significant infrastructure modifications. Versatile design features enable custom printing capabilities, size flexibility, and integration with existing retail operations, where cost performance and brand communication represent critical business requirements.
Competitive Advantages: Flat Paper Bags systems differentiate through proven operational reliability, consistent quality characteristics, and integration with retail branding systems that enhance business effectiveness while maintaining optimal presentation standards suitable for diverse retail and food service applications.
Key market characteristics:
Satchel Bags maintain a 26% market position in the paper bags market due to their balanced capacity properties and convenience advantages. These bags appeal to retailers requiring moderate carrying capacity with self-standing features for food service applications. Market growth is driven by quick-service restaurant expansion, emphasizing reliable packaging solutions and operational efficiency through optimized bag designs.
Gusseted Bags capture 21% market share through enhanced capacity requirements in grocery retail, bulk products, and heavy-duty applications. These retailers demand expandable packaging systems capable of handling diverse product volumes while providing effective carrying capabilities and structural integrity.
Twisted Handle Bags account for 11% market share, serving premium retail applications and specialty boutiques requiring enhanced carrying comfort and upscale presentation features for brand differentiation.
Market Context: Twisted Handle bags demonstrate the highest growth rate in the paper bags market with 7.2% CAGR due to widespread adoption of premium carrying systems and increasing focus on customer convenience optimization, comfortable grip features, and upscale retail applications that maximize carrying comfort while maintaining brand presentation standards.
Appeal Factors: Twisted Handle bag users prioritize comfort features, durability characteristics, and integration with premium retail positioning that enables superior carrying experience across extended shopping trips. The segment benefits from substantial retail investment and brand enhancement programs that emphasize the acquisition of twisted handle systems for customer experience optimization and brand differentiation applications.
Growth Drivers: Premium retail expansion programs incorporate twisted handle bags as standard packaging for luxury operations, while specialty boutique growth increases demand for comfortable carrying capabilities that comply with brand standards and minimize customer fatigue.
Market Challenges: Higher production costs and manufacturing complexity may limit adoption across value-oriented retail segments or price-sensitive scenarios.
Application dynamics include:
No Handle applications capture market share through economical packaging requirements in basic retail, food service, and high-volume distribution operations. These businesses demand cost-effective packaging systems capable of operating with price sensitivity while providing effective product containment and basic presentation capabilities.
Flat Handle applications account for market share, including traditional retail stores, mid-market operations, and standard carrying requirements needing balanced cost and functionality for operational efficiency.
Rope Handle applications serve luxury retail markets, high-end boutiques, and gift packaging requiring maximum carrying strength and premium presentation capabilities for brand excellence.
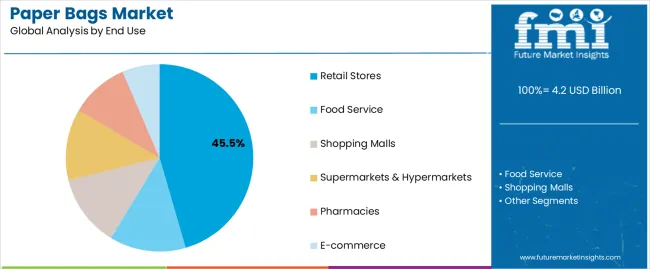
Market Context: Retail Stores dominate the market with 45.5% market share, reflecting the primary demand source for paper bag packaging in merchandise distribution and shopping operations.
Business Model Advantages: Retail stores provide direct market demand for versatile packaging solutions, driving design innovation and capacity expansion while maintaining brand presentation and operational efficiency requirements.
Operational Benefits: Retail applications include daily operations, promotional campaigns, and seasonal merchandising that drive consistent demand for paper bags while providing access to latest printing technologies.
| Category | Factor | Impact | Why It Matters |
|---|---|---|---|
| Driver | Plastic bag bans & environmental regulations (global policy shifts) | ★★★★★ | Legislative mandates require retailers to switch from plastic; paper bags become compliance solution with immediate demand surge across regulated markets. |
| Driver | Consumer environmental awareness & brand preference (eco-conscious shopping) | ★★★★★ | Shoppers actively seek businesses using paper bags; retailers gain competitive advantage through visible environmental commitment and brand differentiation. |
| Driver | E-commerce growth & protective packaging needs | ★★★★☆ | Online retail expansion requires durable shipping solutions; paper bags with reinforced designs capture growing delivery and fulfillment packaging applications. |
| Restraint | Higher cost vs plastic alternatives (2-3x price premium) | ★★★★☆ | Price-sensitive retailers resist adoption; increases market segmentation between value and premium retail channels limiting universal penetration. |
| Restraint | Moisture sensitivity & durability limitations | ★★★☆☆ | Paper bags perform poorly in wet conditions; limits applications in certain climates and requires coating technologies that add complexity and cost. |
| Trend | Digital printing & short-run customization | ★★★★★ | On-demand printing enables small retailers to access custom branding; democratizes premium packaging and creates new service revenue streams for manufacturers. |
| Trend | Barrier coating innovations & compostable materials | ★★★★☆ | Advanced coatings enable food-grade applications; expands addressable market into takeaway food and liquid-resistant requirements driving technical competition. |
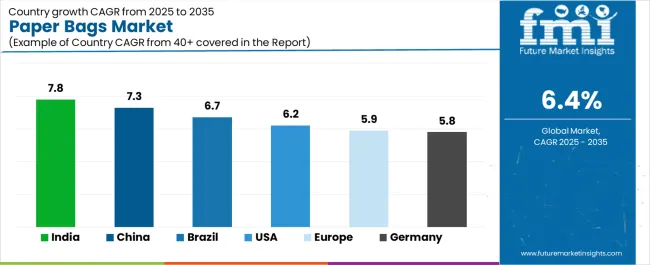
The paper bags market demonstrates varied regional dynamics with Growth Leaders including India (7.8% growth rate) and China (7.3% growth rate) driving expansion through environmental regulations and retail modernization. Steady Performers encompass United States (6.2% growth rate), Germany (5.8% growth rate), and developed regions, benefiting from established plastic reduction programs and retail infrastructure. Emerging Markets feature Brazil (6.7% growth rate) and developing regions, where environmental awareness and retail development support consistent growth patterns.
Regional synthesis reveals East Asian markets leading adoption through regulatory enforcement and retail expansion, while North American countries maintain steady growth supported by consumer environmental preferences and corporate responsibility initiatives. European markets show moderate growth driven by comprehensive plastic reduction legislation and circular economy integration trends.
| Region/Country | 2025-2035 Growth | How to win | What to watch out |
|---|---|---|---|
| India | 7.8% | Focus on cost-effective solutions | Infrastructure gaps; quality consistency |
| China | 7.3% | Lead with high-volume capacity | Environmental compliance costs; labor dynamics |
| United States | 6.2% | Provide custom printing | Recycling infrastructure; raw material costs |
| Germany | 5.8% | Offer premium quality | Over-specification; price sensitivity |
| Brazil | 6.7% | Value-oriented portfolios | Currency volatility; import dependencies |
| Europe | 5.9% | Push compostable options | Regulatory complexity; certification requirements |
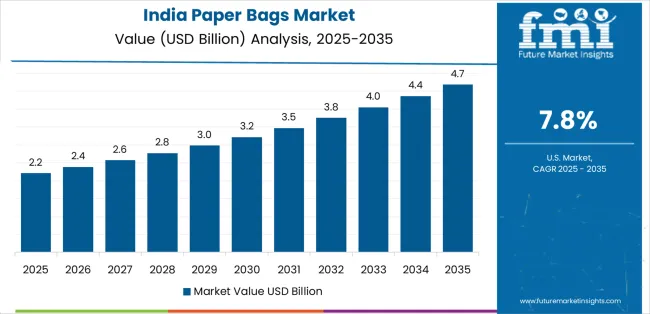
India establishes fastest market growth through aggressive plastic reduction programs and comprehensive retail modernization initiatives, integrating paper bags as standard packaging components in organized retail and food service installations. The country's 7.8% growth rate reflects government initiatives promoting single-use plastic alternatives and environmental protection measures that mandate the use of biodegradable packaging in retail and food service establishments. Growth concentrates in major urban centers, including Delhi, Mumbai, and Bangalore, where retail development showcases integrated paper bag solutions that appeal to retailers seeking brand presentation capabilities and regulatory compliance applications.
Indian manufacturers are developing cost-effective paper bag solutions that combine domestic raw material advantages with functional design features, including reinforced handles and moisture-resistant coatings. Distribution channels through packaging distributors and retail supply networks expand market access, while government support for environmental protection supports adoption across diverse retail and food service segments.
Strategic Market Indicators:
In Shanghai, Beijing, and Shenzhen, retail chains and restaurant networks are implementing paper bags as standard packaging for customer purchases and takeaway operations, driven by increasing government environmental regulations and waste reduction programs that emphasize the importance of recyclable materials. The market holds a 7.3% growth rate, supported by government plastic limitation policies and retail infrastructure modernization programs that promote paper packaging for retail and food service establishments. Chinese operators are adopting paper bags that provide consistent quality performance and cost-effective features, particularly appealing in urban regions where environmental compliance and brand presentation represent critical operational requirements.
Market expansion benefits from growing middle-class consumption and e-commerce growth that enables widespread adoption of paper packaging for diverse retail and delivery applications. Technology adoption follows patterns established in consumer packaging, where quality and price drive procurement decisions and operational deployment.
Market Intelligence Brief:
United States establishes market leadership through comprehensive plastic reduction initiatives and advanced retail infrastructure development, integrating paper bags across grocery, retail, and food service applications. The country's 6.2% growth rate reflects established consumer environmental preferences and mature paper packaging adoption that supports widespread use of branded paper bags in retail and restaurant facilities. Growth concentrates in major metropolitan areas, including New York, California, and Washington, where plastic bag bans showcase mature paper bag deployment that appeals to retailers seeking proven environmental compliance capabilities and brand communication applications.
American packaging providers leverage established distribution networks and comprehensive customization services, including digital printing programs and design support that create customer relationships and competitive advantages. The market benefits from mature environmental consciousness and retail requirements that mandate paper bag alternatives while supporting design innovation and brand integration.
Market Intelligence Brief:
Germany's advanced environmental protection market demonstrates sophisticated paper bag deployment with documented operational effectiveness in retail applications and food service establishments through integration with existing waste management systems and recycling infrastructure. The country leverages engineering expertise in paper technology and quality manufacturing to maintain a 5.8% growth rate. Industrial centers, including Bavaria, Baden-Württemberg, and North Rhine-Westphalia, showcase premium installations where paper bags integrate with comprehensive retail platforms and brand management systems to optimize customer experience and environmental performance.
German manufacturers prioritize material quality and environmental certification in paper bag development, creating demand for premium bags with advanced features, including FSC certification and compostable coatings. The market benefits from established environmental standards and a willingness to invest in high-quality packaging solutions that provide long-term brand benefits and compliance with international environmental regulations.
Market Intelligence Brief:
Brazil's market expansion benefits from diverse retail demand, including retail modernization in São Paulo and Rio de Janeiro, supermarket chain upgrades, and government environmental programs that increasingly incorporate paper packaging for plastic reduction applications. The country maintains a 6.7% growth rate, driven by rising environmental awareness and increasing recognition of paper bag benefits, including recyclability and brand presentation capabilities.
Market dynamics focus on value-oriented paper bag solutions that balance functional performance with affordability considerations important to Brazilian retailers. Growing retail industrialization creates continued demand for modern packaging systems in new store infrastructure and chain expansion projects.
Strategic Market Considerations:
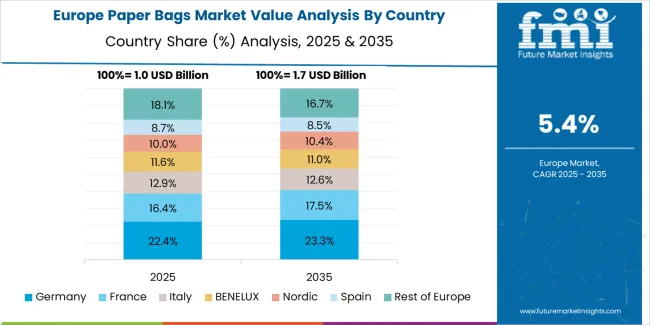
The European paper bags market is projected to grow from USD 1.4 billion in 2025 to USD 2.4 billion by 2035, registering a CAGR of 5.9% over the forecast period. Germany is expected to maintain its leadership position with a 32.6% market share in 2025, supported by its advanced environmental regulations and comprehensive plastic reduction programs.
United Kingdom follows with a 24.3% share in 2025, driven by retail chain initiatives and consumer environmental consciousness. France holds a 19.7% share through extensive plastic bag bans and retail modernization requirements. Italy commands a 13.8% share, while Spain accounts for 9.6% in 2025. The rest of Europe region is anticipated to gain momentum, expanding its collective share from 5.4% to 6.2% by 2035, attributed to increasing environmental awareness in Nordic countries and emerging retail chains implementing paper packaging programs.
| Stakeholder | What they actually control | Typical strengths | Typical blind spots |
|---|---|---|---|
| Global platforms | Multi-country production, vertical integration, pulp sourcing | Scale economics, consistent quality, broad distribution | Innovation speed; regional customization |
| Technology innovators | Digital printing systems; specialty coatings; barrier technologies | Latest printing first; premium positioning | Production capacity limits; geographic reach |
| Regional specialists | Local delivery, fast turnaround, custom designs | "Close to customer" service; flexible minimums | Technology gaps; raw material dependencies |
| Service-focused ecosystems | Design consultation, brand integration, inventory management | Complete packaging solutions; partnership approach | Margin pressure if overservicing; scale limitations |
| Niche specialists | Specialty applications, luxury retail, technical requirements | Win premium segments; flexible customization | Volume limitations; narrow customer base |
| Item | Value |
|---|---|
| Quantitative Units | USD 4.2 billion |
| Bag Type | Flat Paper Bags, Satchel Bags, Gusseted Bags, Twisted Handle Bags |
| Handle Type | No Handle, Twisted Handle, Flat Handle, Rope Handle |
| End Use | Retail Stores, Food Service, Shopping Malls, Supermarkets & Hypermarkets, Pharmacies, E-commerce |
| Regions Covered | North America, Latin America, Western Europe, Eastern Europe, East Asia, South Asia Pacific, Middle East & Africa |
| Countries Covered | United States, China, Germany, India, United Kingdom, Japan, Canada, Brazil, France, Australia, and 25+ additional countries |
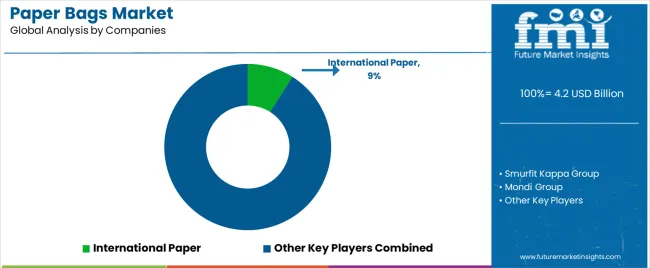
| Key Companies Profiled | International Paper, Smurfit Kappa Group, Mondi Group, WestRock Company, Novolex Holdings, Ronpak Inc., Hotpack Global, Welton Bibby & Baron Ltd. |
| Additional Attributes | Dollar sales by bag type and handle categories, regional adoption trends across North America, East Asia, and Western Europe, competitive landscape with packaging manufacturers and retail suppliers, retailer preferences for brand presentation and environmental compliance, integration with printing platforms and design systems, innovations in barrier technology and coating enhancement, and development of customized packaging solutions with enhanced durability and brand communication capabilities. |
The global paper bags market is estimated to be valued at USD 4.2 billion in 2025.
The market size for the paper bags market is projected to reach USD 7.8 billion by 2035.
The paper bags market is expected to grow at a 6.4% CAGR between 2025 and 2035.
The key product types in paper bags market are flat paper bags, satchel bags, gusseted bags and twisted handle bags.
In terms of end use, retail stores segment to command 45.5% share in the paper bags market in 2025.


Full Research Suite comprises of:
Market outlook & trends analysis
Interviews & case studies
Strategic recommendations
Vendor profiles & capabilities analysis
5-year forecasts
8 regions and 60+ country-level data splits
Market segment data splits
12 months of continuous data updates
DELIVERED AS:
PDF EXCEL ONLINE
Competitive Breakdown of Paper Bags Providers
Kraft Paper Bags Market Size, Share & Forecast 2025 to 2035
Kraft Paper Bakery Bags Market
Kraft Paper Shopping Bags Market Growth – Size, Trends & Forecast 2024 to 2034
Dunnage Paper Bags Market
Europe Ecommerce Paper Bags Market Analysis – Trends & Forecast 2024-2034
Insulated Paper Bags Market
Commercial Paper Bags Market Growth & Trends 2025 to 2035
Paperboard Partition Market Size and Share Forecast Outlook 2025 to 2035
Paper Box Market Size and Share Forecast Outlook 2025 to 2035
Paper Edge Protector Market Size and Share Forecast Outlook 2025 to 2035
Paper Cup Lids Market Size and Share Forecast Outlook 2025 to 2035
Paper Pallet Market Size and Share Forecast Outlook 2025 to 2035
Paper and Paperboard Packaging Market Forecast and Outlook 2025 to 2035
Paper Wrap Market Size and Share Forecast Outlook 2025 to 2035
Paper Cups Market Size and Share Forecast Outlook 2025 to 2035
Paper Core Market Size and Share Forecast Outlook 2025 to 2035
Paper Processing Resins Market Size and Share Forecast Outlook 2025 to 2035
Paper Tester Market Size and Share Forecast Outlook 2025 to 2035
Paper Napkin Converting Lines Market Size and Share Forecast Outlook 2025 to 2035

Thank you!
You will receive an email from our Business Development Manager. Please be sure to check your SPAM/JUNK folder too.
Chat With
MaRIA