Kraft Paper Bags Market Size and Share Forecast Outlook 2025 to 2035

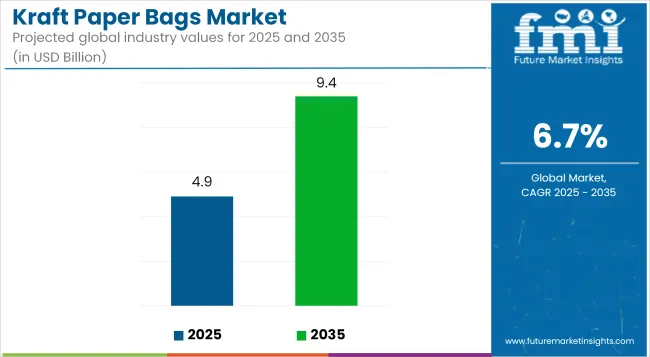
The kraft paper bags market is projected to grow from USD 4.9 billion in 2025 to USD 9.4 billion by 2035, registering a CAGR of 6.7% during the forecast period. Sales in 2024 reached USD 4.5 billion. Growth has been supported by regulatory bans on single-use plastics and consumer preference for biodegradable packaging formats.
Quick Stats of Kraft Paper Bags Market

  • Market Value (2025): USD 4.9 billion
  • Forecast Value (2035): USD 9.4 billion
  • Forecast CAGR: 6.7%
  • Material Leader in 2025: Solid unbleached board (54.1% market share)
  • Top End Use: Food & Beverage (31.6% share)
  • Key Growth Region: North America (USA is the fastest-growing market with 6.5% CAGR)
Kraft Paper Bags Market Industry Value Analysis
Metric Value
Market Size (2025E) USD 4.9 billion
Market Value (2035F) USD 9.4 billion
CAGR (2025 to 2035) 6.7%

Premium kraft variants have been adopted for high-end product branding, with emerging economies increasing their consumption due to urban retail expansion. With enhanced customization, texture variations, and handle options, product uptake has gained pace in premium FMCG and lifestyle sectors.

In April 2025, Mondi, a global leader in packaging and paper, has created a recyclable pre-made paper bag for chemical powders, working in partnership with chemical company Evonik. Florian Ullrich, Sales Director Paper Bags Germany, Mondi says:

“Valve bags are designed for high-speed filling and with sensitive contents such as these specialty chemical powders, high quality material and secure closing options are also paramount. Being able to deliver and indeed improve on these elements, while reducing the carbon footprint of the packaging, was a challenge we were delighted to answer alongside Evonik.”

Advancements in paper strength and process efficiency have accelerated the replacement of plastic with kraft paper across multiple sectors. Bleach-free options and compostable coatings have allowed manufacturers to meet evolving environmental compliance norms.

R&D has been focused on fiber recovery and bonding agents that reduce the need for plastic linings. Global retailers have adopted water-based inks and recyclable glues for paper bag production. Innovation has also occurred in closure systems and reinforced handles, which were once drawbacks of kraft-based carriers.

The kraft paper bags market is expected to witness further opportunity from policy shifts favoring low-impact packaging. Governments across Europe and Asia are pushing for reductions in landfill waste, encouraging retailers to phase out plastic entirely. Leading brands are positioning kraft bags not just as utility items but as marketing tools via customizable, premium-printed formats.

Logistics companies and specialty food retailers have emerged as high-volume buyers of kraft-based insulated and laminated bags. M&A activity among kraft mills and converting companies is anticipated as global supply chains consolidate to serve large retailers. As technology bridges the performance gap between paper and plastic, the kraft bag segment is forecast to become the new standard in sustainable secondary packaging across categories.

Analyzing Kraft Paper Bags Market by Top Investment Segments

The market is segmented based on material type, thickness, sales channel, end-use industry, and region. By material type, the market includes solid unbleached board, solid bleached board, virgin bleached board, and others. In terms of thickness, the market is categorized into single ply (1-ply), 2-ply, 3-ply, and above 3-ply (multiwall/heavy duty).

By sales channel, the market comprises manufacturers, distributors, retailers, hypermarkets, specialty stores, convenience stores, warehouse/wholesale clubs, and e-retail. In terms of end-use industry, the market includes food & beverage industry, retail, homecare & personal care, healthcare & pharmaceutical, agriculture, and others. Regionally, the market is analyzed across North America, Latin America, East Asia, South Asia & Pacific, Eastern Europe, Western Europe, Oceania, and the Middle East & Africa.
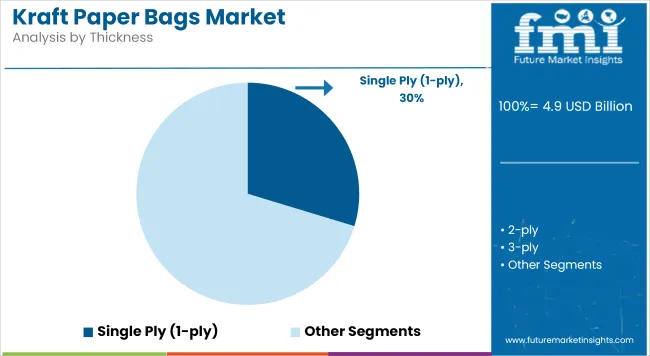
Kraft Paper Bags Market Analysis By Thickness

Solid Unbleached Board Chosen for Strength, Recyclability, and Print Performance

Solid unbleached board has been projected to dominate the kraft paper bags market with a 2025 share of 54.1%, owing to its robust structure and resistance to tearing. This material has been derived from virgin pulp, ensuring food safety compliance and high tensile strength. Its natural brown appearance has been preferred by brands emphasizing eco-friendly packaging.

Superior printability has enabled high-impact branding on bags without additional coatings. Due to its rigidity, solid unbleached board has been extensively used in stand-up kraft paper bags, pouches, and multiwall sacks. Its durability has suited applications requiring strength in wet, greasy, or high-pressure environments. Adhesive and sealing compatibility have facilitated the use of automated filling and packaging systems. Coating-free designs have minimized processing costs and enhanced recyclability.

With growing regulatory support for plastic replacement, the use of unbleached board has expanded across both premium and bulk formats. Shelf-ready and carry bags have been developed using this material to meet retail and foodservice demand.

Resistance to puncture and heat has increased its suitability for hot-fill or baked goods packaging. Its compostable and biodegradable nature has aligned with circular economy goals. Sustainability certifications such as FSC and PEFC have supported material sourcing transparency.

Unbleached kraft paper bags have also been utilized in e-commerce and takeaway packaging where structural integrity is crucial. The ability to support digital and flexographic printing has allowed for design flexibility. Going forward, this material is expected to retain leadership due to its balance of performance, cost, and environmental compliance.
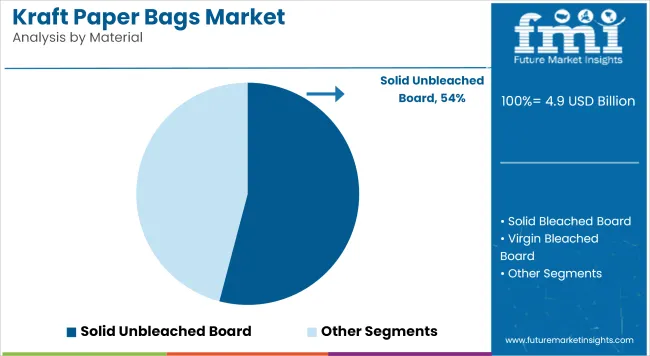
Kraft Paper Bags Market Analysis By Material

Food & Beverage Sector Industry Sales Driven by Demand for Takeaway and On-the-go Grocery Packaging

The food & beverage industry has been estimated to account for 31.6% of kraft paper bags market demand in 2025, due to high packaging turnover, sustainability goals, and hygiene standards. Kraft paper bags have been widely used for bakery items, snacks, dry groceries, and QSR takeaway packaging. Leak-resistant and greaseproof variants have been developed for fried and oily foods.

Both printed and plain kraft bags have been deployed across supermarket, deli, and fast-food applications. Retailers and restaurant chains have shifted toward kraft paper bags as part of their plastic reduction strategies. Compostable and recyclable designs have helped brands comply with global and local sustainability mandates. Windowed and gusseted kraft bags have enabled product visibility while supporting high-volume carryout. Reusable and reinforced handle formats have replaced plastic carryout bags in many jurisdictions.

Kraft bags used in food delivery have incorporated tamper-evident seals and QR tracking to ensure product security. High-barrier paper bags with moisture resistance have extended shelf life for snacks and cereals. Premium kraft finishes have also allowed artisanal and organic food producers to convey authenticity and environmental commitment.

Branded paper bags have been used effectively for consumer recall and loyalty. As foodservice digitization and home delivery accelerate, the role of kraft bags in insulated carriers and POS logistics is growing. Demand for mono-material paper packaging has been prioritized to ensure recyclability in existing waste streams.

Food-grade inks and low migration adhesives have been introduced for compliance with safety norms. The food and beverage sector is expected to drive consistent kraft paper bag consumption through both functional and regulatory tailwinds.
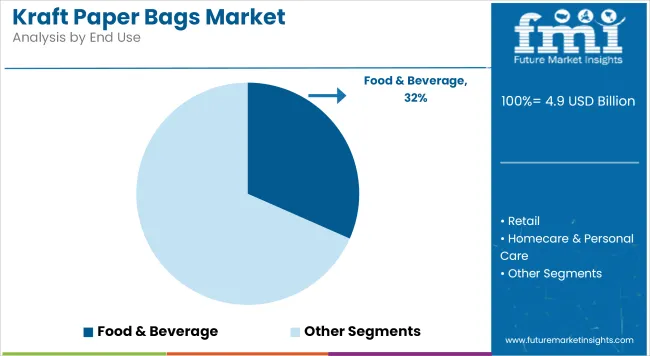
Kraft Paper Bags Market Analysis By End Use

Challenges and Opportunities

Challenges

Price Volatility and Supply Chain Disruptions

Kraft paper bags are largely made from raw materials like unbleached wood pulp and recycled fibers. Yet volatile raw material costs, deforestation issues, and supply chain disruptions remain major hurdles. The increasing demand for sustainable packaging has heightened competition for raw materials, resulting in higher production costs and longer lead times.

To address these challenges, producers are increasingly turning to local sourcing, new fiber alternatives, and more efficient recycling infrastructure to keep costs stable and production flowing.

Opportunities

Expansion of Plastic-Free Packaging Initiatives

As governments and corporations increasingly impose bans on single-use plastic, demand for kraft paper bags as an environmentally-friendly substitute fuels growth. These sectors include retail, food & beverage, e-commerce and personal care, all of which are moving to biodegradable, compostable and recyclable packaging in order to achieve their sustainability objectives.

As the packaging landscape continues to evolve, companies that innovate with water-resistant coatings, reinforced paper handles, and customizable printing solutions will benefit from expanding market opportunities and grassroots brand differentiation.

Country-wise Outlook

United States

The growth of kraft paper bags in the USA region is majorly driven by environmentally concerned consumers and strict regulatory policies restricting the use of plastic. Green packaging: Consumers are embracing eco-friendly packaging solutions, and businesses are adopting biodegradable packaging solutions to minimize waste and achieve sustainability goals.

Paper-based packaging of industry-leading brands are incorporated into e-commerce and retail shopping further fuelling demand for container board and other grades. Additionally, the market is growing due to the factors regarding the durability and strength of the bags.

Country CAGR (2025 to 2035)
United States 6.5%

United Kingdom

The market for kraft paper bags in the united kingdom is growing, as sustainability becomes a greater focus and the government brings increasingly stricter regulations in place to restrict single-use plastics. This has led to a surge of growth in the market as retailers, grocery stores and other foodservice providers start to transition to paper alternatives.

Petition of consumers to recyclability and compostability also made kraft paper bags more preferred options. The simplicity of online grocery deliveries and sustainable shopping habits play an active role in continuous market growth too.

Country CAGR (2025 to 2035)
United Kingdom 6.0%

European Union

Since the region has well-established sustainability policies, the kraft paper bags market will have huge growth opportunities from the European Union. Germany, France, Italy and other nations lead the way toward paper-based packaging as consumer demand for green alternatives grows.

For instance, the European Commission has set regulations against plastic waste, effectively driving their transition over to kraft paper bags in retail, foodservice, and logistics applications. On the other hand, growing investments in advanced manufacturing technologies of paper bags are also boosting product quality and performance.

Country CAGR (2025 to 2035)
European Union 6.3%

Japan

Japan’s market for kraft paper bags is growing amid rising environmental awareness and the government’s pledge to reduce plastic waste. Details such as the country’s emphasis on sustainable packaging solutions, along generational lines, and the growth of organic food and specialty stores has driven demand.

On the other hand, premium paper bag designs, usually employed in the packaging of luxury retail and high-end consumer goods, are also increasing in popularity. Furthermore, the counterbalancing of paper materials in delivery and e-commerce packaging would bolster the market growth.

Country CAGR (2025 to 2035)
Japan 6.1%

South Korea

In South Korea, a similar surge is happening with kraft paper bags as the government has been encouraging sustainable packing solutions by limiting the use of plastic bags. Another growing trend within the foodservice industry - especially among coffee chains and fast-food restaurants - is the use of kraft paper bags for purely takeaway orders.

Market growth is also being lifted by the thriving eCommerce sector and the rise of eco-conscious brands. Enhancements in durability, moisture-resistant coatings, and similar advancements in paper bag innovations help create growth opportunities in the market.

Country CAGR (2025 to 2035)
South Korea 6.4%

Competitive Outlook

The kraft paper bags market is growing on account of shift to environmentally friendly options and regulations around single-use plastic bagsthey’re recyclables and biodegradables, durable for retail, food packing and industrial use.

The demand from grocery chains, quick-service restaurants and apparel brands for reactive modalities has led to manufacturers very quickly ramping their production while also investing in automation.Innovations in printing and bag customization for brand use are also aiding brands keep a focus on sustainability while continuing to drive consumer engagement.
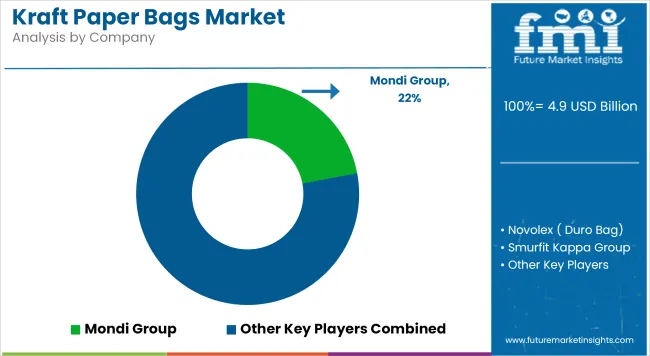
Kraft Paper Bags Market Analysis By Company

Other Key Players

  • WestRock Company
  • Billerud AB
  • Hotpack Packaging LLC
  • Global-Pak Inc.
  • El Dorado Packaging, Inc.

Key Segmentation

By Material type:

  • Solid Unbleached Board
  • Solid Bleached Board
  • Virgin Bleached Board
  • Others

By Thickness:

  • 2 ply
  • 2 & 3 ply
  • Above 3 ply

By Sales channel:

  • Manufacturers
  • Distributors
  • Retailers
  • Hypermarkets
  • Specialty Stores
  • Convenience Stores
  • Warehouse/Wholesale Clubs
  • E-retail

By End use industry:

  • Food & Beverage Industry
  • Retail
  • Homecare & Personal Care
  • Healthcare & Pharmaceutical
  • Agriculture
  • Others

Table of Content

  1. Executive Summary
    • Global Market Outlook
    • Demand-side Trends
    • Supply-side Trends
    • Technology Roadmap Analysis
    • Analysis and Recommendations
  2. Market Overview
    • Market Coverage / Taxonomy
    • Market Definition / Scope / Limitations
  3. Market Background
    • Market Dynamics
      • Drivers
      • Restraints
      • Opportunity
      • Trends
    • Scenario Forecast
      • Demand in Optimistic Scenario
      • Demand in Likely Scenario
      • Demand in Conservative Scenario
    • Opportunity Map Analysis
    • Product Life Cycle Analysis
    • Supply Chain Analysis
      • Supply Side Participants and their Roles
        • Producers
        • Mid-Level Participants (Traders/ Agents/ Brokers)
        • Wholesalers and Distributors
      • Value Added and Value Created at Node in the Supply Chain
      • List of Raw Material Suppliers
      • List of Existing and Potential Buyer’s
    • Investment Feasibility Matrix
    • Value Chain Analysis
      • Profit Margin Analysis
      • Wholesalers and Distributors
      • Retailers
    • PESTLE and Porter’s Analysis
    • Regulatory Landscape
      • By Key Regions
      • By Key Countries
    • Regional Parent Market Outlook
    • Production and Consumption Statistics
    • Import and Export Statistics
  4. Global Market Analysis 2020-2024 and Forecast, 2025-2035
    • Historical Market Size Value (USD Million) & Volume (Units) Analysis, 2020-2024
    • Current and Future Market Size Value (USD Million) & Volume (Units) Projections, 2025-2035
      • Y-o-Y Growth Trend Analysis
      • Absolute $ Opportunity Analysis
  5. Global Market Analysis 2020-2024 and Forecast 2025-2035, By Material type
    • Introduction / Key Findings
    • Historical Market Size Value (USD Million) & Volume (Units) Analysis By Material type, 2020-2024
    • Current and Future Market Size Value (USD Million) & Volume (Units) Analysis and Forecast By Material type, 2025-2035
      • Solid Unbleached Board
      • Solid Bleached Board
      • Virgin Bleached Board
      • Others
    • Y-o-Y Growth Trend Analysis By Material type, 2020-2024
    • Absolute $ Opportunity Analysis By Material type, 2025-2035
  6. Global Market Analysis 2020-2024 and Forecast 2025-2035, By Thickness
    • Introduction / Key Findings
    • Historical Market Size Value (USD Million) & Volume (Units) Analysis By Thickness, 2020-2024
    • Current and Future Market Size Value (USD Million) & Volume (Units) Analysis and Forecast By Thickness, 2025-2035
      • Single Ply (1-ply)
      • 2-ply
      • 3-ply
      • Above 3-ply (Multiwall / Heavy Duty)
    • Y-o-Y Growth Trend Analysis By Thickness, 2020-2024
    • Absolute $ Opportunity Analysis By Thickness, 2025-2035
  7. Global Market Analysis 2020-2024 and Forecast 2025-2035, By Sales channel
    • Introduction / Key Findings
    • Historical Market Size Value (USD Million) & Volume (Units) Analysis By Sales channel, 2020-2024
    • Current and Future Market Size Value (USD Million) & Volume (Units) Analysis and Forecast By Sales channel, 2025-2035
      • Manufacturers
      • Distributors
      • Retailers
      • Hypermarkets
      • Specialty Stores
      • Convenience Stores
      • Warehouse/Wholesale Clubs
      • E-retail
    • Y-o-Y Growth Trend Analysis By Sales channel, 2020-2024
    • Absolute $ Opportunity Analysis By Sales channel, 2025-2035
  8. Global Market Analysis 2020-2024 and Forecast 2025-2035, By End use industry
    • Introduction / Key Findings
    • Historical Market Size Value (USD Million) & Volume (Units) Analysis By End use industry, 2020-2024
    • Current and Future Market Size Value (USD Million) & Volume (Units) Analysis and Forecast By End use industry, 2025-2035
      • Food & Beverage Industry
      • Retail
      • Homecare & Personal Care
      • Healthcare & Pharmaceutical
      • Agriculture
      • Others
    • Y-o-Y Growth Trend Analysis By End use industry, 2020-2024
    • Absolute $ Opportunity Analysis By End use industry, 2025-2035
  9. Global Market Analysis 2020-2024 and Forecast 2025-2035, By Region
    • Introduction
    • Historical Market Size Value (USD Million) & Volume (Units) Analysis By Region, 2020-2024
    • Current Market Size Value (USD Million) & Volume (Units) Analysis and Forecast By Region, 2025-2035
      • North America
      • Latin America
      • Europe
      • East Asia
      • South Asia
      • Oceania
      • MEA
    • Market Attractiveness Analysis By Region
  10. North America Market Analysis 2020-2024 and Forecast 2025-2035, By Country
    • Historical Market Size Value (USD Million) & Volume (Units) Trend Analysis By Market Taxonomy, 2020-2024
    • Market Size Value (USD Million) & Volume (Units) Forecast By Market Taxonomy, 2025-2035
      • By Country
        • USA
        • Canada
      • By Material type
      • By Thickness
      • By Sales channel
      • By End use industry
    • Market Attractiveness Analysis
      • By Country
      • By Material type
      • By Thickness
      • By Sales channel
      • By End use industry
    • Key Takeaways
  11. Latin America Market Analysis 2020-2024 and Forecast 2025-2035, By Country
    • Historical Market Size Value (USD Million) & Volume (Units) Trend Analysis By Market Taxonomy, 2020-2024
    • Market Size Value (USD Million) & Volume (Units) Forecast By Market Taxonomy, 2025-2035
      • By Country
        • Brazil
        • Mexico
        • Argentina
        • Chile
        • Peru
        • Rest of Latin America
      • By Material type
      • By Thickness
      • By Sales channel
      • By End use industry
    • Market Attractiveness Analysis
      • By Country
      • By Material type
      • By Thickness
      • By Sales channel
      • By End use industry
    • Key Takeaways
  12. Europe Market Analysis 2020-2024 and Forecast 2025-2035, By Country
    • Historical Market Size Value (USD Million) & Volume (Units) Trend Analysis By Market Taxonomy, 2020-2024
    • Market Size Value (USD Million) & Volume (Units) Forecast By Market Taxonomy, 2025-2035
      • By Country
        • Germany
        • Italy
        • France
        • UK
        • Spain
        • Russia
        • BENELUX
        • Rest of Europe
      • By Material type
      • By Thickness
      • By Sales channel
      • By End use industry
    • Market Attractiveness Analysis
      • By Country
      • By Material type
      • By Thickness
      • By Sales channel
      • By End use industry
    • Key Takeaways
  13. East Asia Market Analysis 2020-2024 and Forecast 2025-2035, By Country
    • Historical Market Size Value (USD Million) & Volume (Units) Trend Analysis By Market Taxonomy, 2020-2024
    • Market Size Value (USD Million) & Volume (Units) Forecast By Market Taxonomy, 2025-2035
      • By Country
        • China
        • Japan
        • South Korea
      • By Material type
      • By Thickness
      • By Sales channel
      • By End use industry
    • Market Attractiveness Analysis
      • By Country
      • By Material type
      • By Thickness
      • By Sales channel
      • By End use industry
    • Key Takeaways
  14. South Asia Market Analysis 2020-2024 and Forecast 2025-2035, By Country
    • Historical Market Size Value (USD Million) & Volume (Units) Trend Analysis By Market Taxonomy, 2020-2024
    • Market Size Value (USD Million) & Volume (Units) Forecast By Market Taxonomy, 2025-2035
      • By Country
        • India
        • Thailand
        • Malaysia
        • Indonesia
        • Rest of South Asia
      • By Material type
      • By Thickness
      • By Sales channel
      • By End use industry
    • Market Attractiveness Analysis
      • By Country
      • By Material type
      • By Thickness
      • By Sales channel
      • By End use industry
    • Key Takeaways
  15. Oceania Market Analysis 2020-2024 and Forecast 2025-2035, By Country
    • Historical Market Size Value (USD Million) & Volume (Units) Trend Analysis By Market Taxonomy, 2020-2024
    • Market Size Value (USD Million) & Volume (Units) Forecast By Market Taxonomy, 2025-2035
      • By Country
        • Australia
        • New Zealand
      • By Material type
      • By Thickness
      • By Sales channel
      • By End use industry
    • Market Attractiveness Analysis
      • By Country
      • By Material type
      • By Thickness
      • By Sales channel
      • By End use industry
    • Key Takeaways
  16. MEA Market Analysis 2020-2024 and Forecast 2025-2035, By Country
    • Historical Market Size Value (USD Million) & Volume (Units) Trend Analysis By Market Taxonomy, 2020-2024
    • Market Size Value (USD Million) & Volume (Units) Forecast By Market Taxonomy, 2025-2035
      • By Country
        • GCC
        • Rest of MEA
      • By Material type
      • By Thickness
      • By Sales channel
      • By End use industry
    • Market Attractiveness Analysis
      • By Country
      • By Material type
      • By Thickness
      • By Sales channel
      • By End use industry
    • Key Takeaways
  17. Key Countries Market Analysis
    • USA
      • Pricing Analysis
      • Market Share Analysis, 2024
        • By Material type
        • By Thickness
        • By Sales channel
        • By End use industry
    • Canada
      • Pricing Analysis
      • Market Share Analysis, 2024
        • By Material type
        • By Thickness
        • By Sales channel
        • By End use industry
    • Brazil
      • Pricing Analysis
      • Market Share Analysis, 2024
        • By Material type
        • By Thickness
        • By Sales channel
        • By End use industry
    • Mexico
      • Pricing Analysis
      • Market Share Analysis, 2024
        • By Material type
        • By Thickness
        • By Sales channel
        • By End use industry
    • Argentina
      • Pricing Analysis
      • Market Share Analysis, 2024
        • By Material type
        • By Thickness
        • By Sales channel
        • By End use industry
  18. Market Structure Analysis
    • Competition Dashboard
    • Competition Benchmarking
    • Market Share Analysis of Top Players
      • By Regional
      • By Material type
      • By Thickness
      • By Sales channel
      • By End use industry
  19. Competition Analysis
    • Competition Deep Dive
      • International paper Company
        • Overview
        • Product Portfolio
        • Profitability by Market Segments (Product/Age /Sales Channel/Region)
        • Sales Footprint
        • Strategy Overview
          • Marketing Strategy
          • Product Strategy
          • Channel Strategy
      • Smurfit Kappa Group
        • Overview
        • Product Portfolio
        • Profitability by Market Segments (Product/Age /Sales Channel/Region)
        • Sales Footprint
        • Strategy Overview
          • Marketing Strategy
          • Product Strategy
          • Channel Strategy
      • Mondi Group
        • Overview
        • Product Portfolio
        • Profitability by Market Segments (Product/Age /Sales Channel/Region)
        • Sales Footprint
        • Strategy Overview
          • Marketing Strategy
          • Product Strategy
          • Channel Strategy
      • Hood Packaging Corporation
        • Overview
        • Product Portfolio
        • Profitability by Market Segments (Product/Age /Sales Channel/Region)
        • Sales Footprint
        • Strategy Overview
          • Marketing Strategy
          • Product Strategy
          • Channel Strategy
      • Conitex Sonoco
        • Overview
        • Product Portfolio
        • Profitability by Market Segments (Product/Age /Sales Channel/Region)
        • Sales Footprint
        • Strategy Overview
          • Marketing Strategy
          • Product Strategy
          • Channel Strategy
      • Novolex
        • Overview
        • Product Portfolio
        • Profitability by Market Segments (Product/Age /Sales Channel/Region)
        • Sales Footprint
        • Strategy Overview
          • Marketing Strategy
          • Product Strategy
          • Channel Strategy
      • Wisconsin Converting, Inc.
        • Overview
        • Product Portfolio
        • Profitability by Market Segments (Product/Age /Sales Channel/Region)
        • Sales Footprint
        • Strategy Overview
          • Marketing Strategy
          • Product Strategy
          • Channel Strategy
      • Gilchrist Bag Manufacturing LLC
        • Overview
        • Product Portfolio
        • Profitability by Market Segments (Product/Age /Sales Channel/Region)
        • Sales Footprint
        • Strategy Overview
          • Marketing Strategy
          • Product Strategy
          • Channel Strategy
      • Walter Packaging Corp
        • Overview
        • Product Portfolio
        • Profitability by Market Segments (Product/Age /Sales Channel/Region)
        • Sales Footprint
        • Strategy Overview
          • Marketing Strategy
          • Product Strategy
          • Channel Strategy
      • Ross & Wallace Paper Products, Inc.
        • Overview
        • Product Portfolio
        • Profitability by Market Segments (Product/Age /Sales Channel/Region)
        • Sales Footprint
        • Strategy Overview
          • Marketing Strategy
          • Product Strategy
          • Channel Strategy
  20. Assumptions & Acronyms Used
  21. Research Methodology

List of Tables

  • Table 1: Global Market Value (USD Million) Forecast by Region, 2020-2035
  • Table 2: Global Market Volume (Units) Forecast by Region, 2020-2035
  • Table 3: Global Market Value (USD Million) Forecast by Material type, 2020-2035
  • Table 4: Global Market Volume (Units) Forecast by Material type, 2020-2035
  • Table 5: Global Market Value (USD Million) Forecast by Thickness, 2020-2035
  • Table 6: Global Market Volume (Units) Forecast by Thickness, 2020-2035
  • Table 7: Global Market Value (USD Million) Forecast by Sales channel, 2020-2035
  • Table 8: Global Market Volume (Units) Forecast by Sales channel, 2020-2035
  • Table 9: Global Market Value (USD Million) Forecast by End use industry, 2020-2035
  • Table 10: Global Market Volume (Units) Forecast by End use industry, 2020-2035
  • Table 11: North America Market Value (USD Million) Forecast by Country, 2020-2035
  • Table 12: North America Market Volume (Units) Forecast by Country, 2020-2035
  • Table 13: North America Market Value (USD Million) Forecast by Material type, 2020-2035
  • Table 14: North America Market Volume (Units) Forecast by Material type, 2020-2035
  • Table 15: North America Market Value (USD Million) Forecast by Thickness, 2020-2035
  • Table 16: North America Market Volume (Units) Forecast by Thickness, 2020-2035
  • Table 17: North America Market Value (USD Million) Forecast by Sales channel, 2020-2035
  • Table 18: North America Market Volume (Units) Forecast by Sales channel, 2020-2035
  • Table 19: North America Market Value (USD Million) Forecast by End use industry, 2020-2035
  • Table 20: North America Market Volume (Units) Forecast by End use industry, 2020-2035
  • Table 21: Latin America Market Value (USD Million) Forecast by Country, 2020-2035
  • Table 22: Latin America Market Volume (Units) Forecast by Country, 2020-2035
  • Table 23: Latin America Market Value (USD Million) Forecast by Material type, 2020-2035
  • Table 24: Latin America Market Volume (Units) Forecast by Material type, 2020-2035
  • Table 25: Latin America Market Value (USD Million) Forecast by Thickness, 2020-2035
  • Table 26: Latin America Market Volume (Units) Forecast by Thickness, 2020-2035
  • Table 27: Latin America Market Value (USD Million) Forecast by Sales channel, 2020-2035
  • Table 28: Latin America Market Volume (Units) Forecast by Sales channel, 2020-2035
  • Table 29: Latin America Market Value (USD Million) Forecast by End use industry, 2020-2035
  • Table 30: Latin America Market Volume (Units) Forecast by End use industry, 2020-2035
  • Table 31: Europe Market Value (USD Million) Forecast by Country, 2020-2035
  • Table 32: Europe Market Volume (Units) Forecast by Country, 2020-2035
  • Table 33: Europe Market Value (USD Million) Forecast by Material type, 2020-2035
  • Table 34: Europe Market Volume (Units) Forecast by Material type, 2020-2035
  • Table 35: Europe Market Value (USD Million) Forecast by Thickness, 2020-2035
  • Table 36: Europe Market Volume (Units) Forecast by Thickness, 2020-2035
  • Table 37: Europe Market Value (USD Million) Forecast by Sales channel, 2020-2035
  • Table 38: Europe Market Volume (Units) Forecast by Sales channel, 2020-2035
  • Table 39: Europe Market Value (USD Million) Forecast by End use industry, 2020-2035
  • Table 40: Europe Market Volume (Units) Forecast by End use industry, 2020-2035
  • Table 41: East Asia Market Value (USD Million) Forecast by Country, 2020-2035
  • Table 42: East Asia Market Volume (Units) Forecast by Country, 2020-2035
  • Table 43: East Asia Market Value (USD Million) Forecast by Material type, 2020-2035
  • Table 44: East Asia Market Volume (Units) Forecast by Material type, 2020-2035
  • Table 45: East Asia Market Value (USD Million) Forecast by Thickness, 2020-2035
  • Table 46: East Asia Market Volume (Units) Forecast by Thickness, 2020-2035
  • Table 47: East Asia Market Value (USD Million) Forecast by Sales channel, 2020-2035
  • Table 48: East Asia Market Volume (Units) Forecast by Sales channel, 2020-2035
  • Table 49: East Asia Market Value (USD Million) Forecast by End use industry, 2020-2035
  • Table 50: East Asia Market Volume (Units) Forecast by End use industry, 2020-2035
  • Table 51: South Asia Market Value (USD Million) Forecast by Country, 2020-2035
  • Table 52: South Asia Market Volume (Units) Forecast by Country, 2020-2035
  • Table 53: South Asia Market Value (USD Million) Forecast by Material type, 2020-2035
  • Table 54: South Asia Market Volume (Units) Forecast by Material type, 2020-2035
  • Table 55: South Asia Market Value (USD Million) Forecast by Thickness, 2020-2035
  • Table 56: South Asia Market Volume (Units) Forecast by Thickness, 2020-2035
  • Table 57: South Asia Market Value (USD Million) Forecast by Sales channel, 2020-2035
  • Table 58: South Asia Market Volume (Units) Forecast by Sales channel, 2020-2035
  • Table 59: South Asia Market Value (USD Million) Forecast by End use industry, 2020-2035
  • Table 60: South Asia Market Volume (Units) Forecast by End use industry, 2020-2035
  • Table 61: Oceania Market Value (USD Million) Forecast by Country, 2020-2035
  • Table 62: Oceania Market Volume (Units) Forecast by Country, 2020-2035
  • Table 63: Oceania Market Value (USD Million) Forecast by Material type, 2020-2035
  • Table 64: Oceania Market Volume (Units) Forecast by Material type, 2020-2035
  • Table 65: Oceania Market Value (USD Million) Forecast by Thickness, 2020-2035
  • Table 66: Oceania Market Volume (Units) Forecast by Thickness, 2020-2035
  • Table 67: Oceania Market Value (USD Million) Forecast by Sales channel, 2020-2035
  • Table 68: Oceania Market Volume (Units) Forecast by Sales channel, 2020-2035
  • Table 69: Oceania Market Value (USD Million) Forecast by End use industry, 2020-2035
  • Table 70: Oceania Market Volume (Units) Forecast by End use industry, 2020-2035
  • Table 71: MEA Market Value (USD Million) Forecast by Country, 2020-2035
  • Table 72: MEA Market Volume (Units) Forecast by Country, 2020-2035
  • Table 73: MEA Market Value (USD Million) Forecast by Material type, 2020-2035
  • Table 74: MEA Market Volume (Units) Forecast by Material type, 2020-2035
  • Table 75: MEA Market Value (USD Million) Forecast by Thickness, 2020-2035
  • Table 76: MEA Market Volume (Units) Forecast by Thickness, 2020-2035
  • Table 77: MEA Market Value (USD Million) Forecast by Sales channel, 2020-2035
  • Table 78: MEA Market Volume (Units) Forecast by Sales channel, 2020-2035
  • Table 79: MEA Market Value (USD Million) Forecast by End use industry, 2020-2035
  • Table 80: MEA Market Volume (Units) Forecast by End use industry, 2020-2035

List of Figures

  • Figure 1: Global Market Value (USD Million) by Material type, 2025-2035
  • Figure 2: Global Market Value (USD Million) by Thickness, 2025-2035
  • Figure 3: Global Market Value (USD Million) by Sales channel, 2025-2035
  • Figure 4: Global Market Value (USD Million) by End use industry, 2025-2035
  • Figure 5: Global Market Value (USD Million) by Region, 2025-2035
  • Figure 6: Global Market Value (USD Million) Analysis by Region, 2020-2035
  • Figure 7: Global Market Volume (Units) Analysis by Region, 2020-2035
  • Figure 8: Global Market Value Share (%) and BPS Analysis by Region, 2025-2035
  • Figure 9: Global Market Y-o-Y Growth (%) Projections by Region, 2025-2035
  • Figure 10: Global Market Value (USD Million) Analysis by Material type, 2020-2035
  • Figure 11: Global Market Volume (Units) Analysis by Material type, 2020-2035
  • Figure 12: Global Market Value Share (%) and BPS Analysis by Material type, 2025-2035
  • Figure 13: Global Market Y-o-Y Growth (%) Projections by Material type, 2025-2035
  • Figure 14: Global Market Value (USD Million) Analysis by Thickness, 2020-2035
  • Figure 15: Global Market Volume (Units) Analysis by Thickness, 2020-2035
  • Figure 16: Global Market Value Share (%) and BPS Analysis by Thickness, 2025-2035
  • Figure 17: Global Market Y-o-Y Growth (%) Projections by Thickness, 2025-2035
  • Figure 18: Global Market Value (USD Million) Analysis by Sales channel, 2020-2035
  • Figure 19: Global Market Volume (Units) Analysis by Sales channel, 2020-2035
  • Figure 20: Global Market Value Share (%) and BPS Analysis by Sales channel, 2025-2035
  • Figure 21: Global Market Y-o-Y Growth (%) Projections by Sales channel, 2025-2035
  • Figure 22: Global Market Value (USD Million) Analysis by End use industry, 2020-2035
  • Figure 23: Global Market Volume (Units) Analysis by End use industry, 2020-2035
  • Figure 24: Global Market Value Share (%) and BPS Analysis by End use industry, 2025-2035
  • Figure 25: Global Market Y-o-Y Growth (%) Projections by End use industry, 2025-2035
  • Figure 26: Global Market Attractiveness by Material type, 2025-2035
  • Figure 27: Global Market Attractiveness by Thickness, 2025-2035
  • Figure 28: Global Market Attractiveness by Sales channel, 2025-2035
  • Figure 29: Global Market Attractiveness by End use industry, 2025-2035
  • Figure 30: Global Market Attractiveness by Region, 2025-2035
  • Figure 31: North America Market Value (USD Million) by Material type, 2025-2035
  • Figure 32: North America Market Value (USD Million) by Thickness, 2025-2035
  • Figure 33: North America Market Value (USD Million) by Sales channel, 2025-2035
  • Figure 34: North America Market Value (USD Million) by End use industry, 2025-2035
  • Figure 35: North America Market Value (USD Million) by Country, 2025-2035
  • Figure 36: North America Market Value (USD Million) Analysis by Country, 2020-2035
  • Figure 37: North America Market Volume (Units) Analysis by Country, 2020-2035
  • Figure 38: North America Market Value Share (%) and BPS Analysis by Country, 2025-2035
  • Figure 39: North America Market Y-o-Y Growth (%) Projections by Country, 2025-2035
  • Figure 40: North America Market Value (USD Million) Analysis by Material type, 2020-2035
  • Figure 41: North America Market Volume (Units) Analysis by Material type, 2020-2035
  • Figure 42: North America Market Value Share (%) and BPS Analysis by Material type, 2025-2035
  • Figure 43: North America Market Y-o-Y Growth (%) Projections by Material type, 2025-2035
  • Figure 44: North America Market Value (USD Million) Analysis by Thickness, 2020-2035
  • Figure 45: North America Market Volume (Units) Analysis by Thickness, 2020-2035
  • Figure 46: North America Market Value Share (%) and BPS Analysis by Thickness, 2025-2035
  • Figure 47: North America Market Y-o-Y Growth (%) Projections by Thickness, 2025-2035
  • Figure 48: North America Market Value (USD Million) Analysis by Sales channel, 2020-2035
  • Figure 49: North America Market Volume (Units) Analysis by Sales channel, 2020-2035
  • Figure 50: North America Market Value Share (%) and BPS Analysis by Sales channel, 2025-2035
  • Figure 51: North America Market Y-o-Y Growth (%) Projections by Sales channel, 2025-2035
  • Figure 52: North America Market Value (USD Million) Analysis by End use industry, 2020-2035
  • Figure 53: North America Market Volume (Units) Analysis by End use industry, 2020-2035
  • Figure 54: North America Market Value Share (%) and BPS Analysis by End use industry, 2025-2035
  • Figure 55: North America Market Y-o-Y Growth (%) Projections by End use industry, 2025-2035
  • Figure 56: North America Market Attractiveness by Material type, 2025-2035
  • Figure 57: North America Market Attractiveness by Thickness, 2025-2035
  • Figure 58: North America Market Attractiveness by Sales channel, 2025-2035
  • Figure 59: North America Market Attractiveness by End use industry, 2025-2035
  • Figure 60: North America Market Attractiveness by Country, 2025-2035
  • Figure 61: Latin America Market Value (USD Million) by Material type, 2025-2035
  • Figure 62: Latin America Market Value (USD Million) by Thickness, 2025-2035
  • Figure 63: Latin America Market Value (USD Million) by Sales channel, 2025-2035
  • Figure 64: Latin America Market Value (USD Million) by End use industry, 2025-2035
  • Figure 65: Latin America Market Value (USD Million) by Country, 2025-2035
  • Figure 66: Latin America Market Value (USD Million) Analysis by Country, 2020-2035
  • Figure 67: Latin America Market Volume (Units) Analysis by Country, 2020-2035
  • Figure 68: Latin America Market Value Share (%) and BPS Analysis by Country, 2025-2035
  • Figure 69: Latin America Market Y-o-Y Growth (%) Projections by Country, 2025-2035
  • Figure 70: Latin America Market Value (USD Million) Analysis by Material type, 2020-2035
  • Figure 71: Latin America Market Volume (Units) Analysis by Material type, 2020-2035
  • Figure 72: Latin America Market Value Share (%) and BPS Analysis by Material type, 2025-2035
  • Figure 73: Latin America Market Y-o-Y Growth (%) Projections by Material type, 2025-2035
  • Figure 74: Latin America Market Value (USD Million) Analysis by Thickness, 2020-2035
  • Figure 75: Latin America Market Volume (Units) Analysis by Thickness, 2020-2035
  • Figure 76: Latin America Market Value Share (%) and BPS Analysis by Thickness, 2025-2035
  • Figure 77: Latin America Market Y-o-Y Growth (%) Projections by Thickness, 2025-2035
  • Figure 78: Latin America Market Value (USD Million) Analysis by Sales channel, 2020-2035
  • Figure 79: Latin America Market Volume (Units) Analysis by Sales channel, 2020-2035
  • Figure 80: Latin America Market Value Share (%) and BPS Analysis by Sales channel, 2025-2035
  • Figure 81: Latin America Market Y-o-Y Growth (%) Projections by Sales channel, 2025-2035
  • Figure 82: Latin America Market Value (USD Million) Analysis by End use industry, 2020-2035
  • Figure 83: Latin America Market Volume (Units) Analysis by End use industry, 2020-2035
  • Figure 84: Latin America Market Value Share (%) and BPS Analysis by End use industry, 2025-2035
  • Figure 85: Latin America Market Y-o-Y Growth (%) Projections by End use industry, 2025-2035
  • Figure 86: Latin America Market Attractiveness by Material type, 2025-2035
  • Figure 87: Latin America Market Attractiveness by Thickness, 2025-2035
  • Figure 88: Latin America Market Attractiveness by Sales channel, 2025-2035
  • Figure 89: Latin America Market Attractiveness by End use industry, 2025-2035
  • Figure 90: Latin America Market Attractiveness by Country, 2025-2035
  • Figure 91: Europe Market Value (USD Million) by Material type, 2025-2035
  • Figure 92: Europe Market Value (USD Million) by Thickness, 2025-2035
  • Figure 93: Europe Market Value (USD Million) by Sales channel, 2025-2035
  • Figure 94: Europe Market Value (USD Million) by End use industry, 2025-2035
  • Figure 95: Europe Market Value (USD Million) by Country, 2025-2035
  • Figure 96: Europe Market Value (USD Million) Analysis by Country, 2020-2035
  • Figure 97: Europe Market Volume (Units) Analysis by Country, 2020-2035
  • Figure 98: Europe Market Value Share (%) and BPS Analysis by Country, 2025-2035
  • Figure 99: Europe Market Y-o-Y Growth (%) Projections by Country, 2025-2035
  • Figure 100: Europe Market Value (USD Million) Analysis by Material type, 2020-2035
  • Figure 101: Europe Market Volume (Units) Analysis by Material type, 2020-2035
  • Figure 102: Europe Market Value Share (%) and BPS Analysis by Material type, 2025-2035
  • Figure 103: Europe Market Y-o-Y Growth (%) Projections by Material type, 2025-2035
  • Figure 104: Europe Market Value (USD Million) Analysis by Thickness, 2020-2035
  • Figure 105: Europe Market Volume (Units) Analysis by Thickness, 2020-2035
  • Figure 106: Europe Market Value Share (%) and BPS Analysis by Thickness, 2025-2035
  • Figure 107: Europe Market Y-o-Y Growth (%) Projections by Thickness, 2025-2035
  • Figure 108: Europe Market Value (USD Million) Analysis by Sales channel, 2020-2035
  • Figure 109: Europe Market Volume (Units) Analysis by Sales channel, 2020-2035
  • Figure 110: Europe Market Value Share (%) and BPS Analysis by Sales channel, 2025-2035
  • Figure 111: Europe Market Y-o-Y Growth (%) Projections by Sales channel, 2025-2035
  • Figure 112: Europe Market Value (USD Million) Analysis by End use industry, 2020-2035
  • Figure 113: Europe Market Volume (Units) Analysis by End use industry, 2020-2035
  • Figure 114: Europe Market Value Share (%) and BPS Analysis by End use industry, 2025-2035
  • Figure 115: Europe Market Y-o-Y Growth (%) Projections by End use industry, 2025-2035
  • Figure 116: Europe Market Attractiveness by Material type, 2025-2035
  • Figure 117: Europe Market Attractiveness by Thickness, 2025-2035
  • Figure 118: Europe Market Attractiveness by Sales channel, 2025-2035
  • Figure 119: Europe Market Attractiveness by End use industry, 2025-2035
  • Figure 120: Europe Market Attractiveness by Country, 2025-2035
  • Figure 121: East Asia Market Value (USD Million) by Material type, 2025-2035
  • Figure 122: East Asia Market Value (USD Million) by Thickness, 2025-2035
  • Figure 123: East Asia Market Value (USD Million) by Sales channel, 2025-2035
  • Figure 124: East Asia Market Value (USD Million) by End use industry, 2025-2035
  • Figure 125: East Asia Market Value (USD Million) by Country, 2025-2035
  • Figure 126: East Asia Market Value (USD Million) Analysis by Country, 2020-2035
  • Figure 127: East Asia Market Volume (Units) Analysis by Country, 2020-2035
  • Figure 128: East Asia Market Value Share (%) and BPS Analysis by Country, 2025-2035
  • Figure 129: East Asia Market Y-o-Y Growth (%) Projections by Country, 2025-2035
  • Figure 130: East Asia Market Value (USD Million) Analysis by Material type, 2020-2035
  • Figure 131: East Asia Market Volume (Units) Analysis by Material type, 2020-2035
  • Figure 132: East Asia Market Value Share (%) and BPS Analysis by Material type, 2025-2035
  • Figure 133: East Asia Market Y-o-Y Growth (%) Projections by Material type, 2025-2035
  • Figure 134: East Asia Market Value (USD Million) Analysis by Thickness, 2020-2035
  • Figure 135: East Asia Market Volume (Units) Analysis by Thickness, 2020-2035
  • Figure 136: East Asia Market Value Share (%) and BPS Analysis by Thickness, 2025-2035
  • Figure 137: East Asia Market Y-o-Y Growth (%) Projections by Thickness, 2025-2035
  • Figure 138: East Asia Market Value (USD Million) Analysis by Sales channel, 2020-2035
  • Figure 139: East Asia Market Volume (Units) Analysis by Sales channel, 2020-2035
  • Figure 140: East Asia Market Value Share (%) and BPS Analysis by Sales channel, 2025-2035
  • Figure 141: East Asia Market Y-o-Y Growth (%) Projections by Sales channel, 2025-2035
  • Figure 142: East Asia Market Value (USD Million) Analysis by End use industry, 2020-2035
  • Figure 143: East Asia Market Volume (Units) Analysis by End use industry, 2020-2035
  • Figure 144: East Asia Market Value Share (%) and BPS Analysis by End use industry, 2025-2035
  • Figure 145: East Asia Market Y-o-Y Growth (%) Projections by End use industry, 2025-2035
  • Figure 146: East Asia Market Attractiveness by Material type, 2025-2035
  • Figure 147: East Asia Market Attractiveness by Thickness, 2025-2035
  • Figure 148: East Asia Market Attractiveness by Sales channel, 2025-2035
  • Figure 149: East Asia Market Attractiveness by End use industry, 2025-2035
  • Figure 150: East Asia Market Attractiveness by Country, 2025-2035
  • Figure 151: South Asia Market Value (USD Million) by Material type, 2025-2035
  • Figure 152: South Asia Market Value (USD Million) by Thickness, 2025-2035
  • Figure 153: South Asia Market Value (USD Million) by Sales channel, 2025-2035
  • Figure 154: South Asia Market Value (USD Million) by End use industry, 2025-2035
  • Figure 155: South Asia Market Value (USD Million) by Country, 2025-2035
  • Figure 156: South Asia Market Value (USD Million) Analysis by Country, 2020-2035
  • Figure 157: South Asia Market Volume (Units) Analysis by Country, 2020-2035
  • Figure 158: South Asia Market Value Share (%) and BPS Analysis by Country, 2025-2035
  • Figure 159: South Asia Market Y-o-Y Growth (%) Projections by Country, 2025-2035
  • Figure 160: South Asia Market Value (USD Million) Analysis by Material type, 2020-2035
  • Figure 161: South Asia Market Volume (Units) Analysis by Material type, 2020-2035
  • Figure 162: South Asia Market Value Share (%) and BPS Analysis by Material type, 2025-2035
  • Figure 163: South Asia Market Y-o-Y Growth (%) Projections by Material type, 2025-2035
  • Figure 164: South Asia Market Value (USD Million) Analysis by Thickness, 2020-2035
  • Figure 165: South Asia Market Volume (Units) Analysis by Thickness, 2020-2035
  • Figure 166: South Asia Market Value Share (%) and BPS Analysis by Thickness, 2025-2035
  • Figure 167: South Asia Market Y-o-Y Growth (%) Projections by Thickness, 2025-2035
  • Figure 168: South Asia Market Value (USD Million) Analysis by Sales channel, 2020-2035
  • Figure 169: South Asia Market Volume (Units) Analysis by Sales channel, 2020-2035
  • Figure 170: South Asia Market Value Share (%) and BPS Analysis by Sales channel, 2025-2035
  • Figure 171: South Asia Market Y-o-Y Growth (%) Projections by Sales channel, 2025-2035
  • Figure 172: South Asia Market Value (USD Million) Analysis by End use industry, 2020-2035
  • Figure 173: South Asia Market Volume (Units) Analysis by End use industry, 2020-2035
  • Figure 174: South Asia Market Value Share (%) and BPS Analysis by End use industry, 2025-2035
  • Figure 175: South Asia Market Y-o-Y Growth (%) Projections by End use industry, 2025-2035
  • Figure 176: South Asia Market Attractiveness by Material type, 2025-2035
  • Figure 177: South Asia Market Attractiveness by Thickness, 2025-2035
  • Figure 178: South Asia Market Attractiveness by Sales channel, 2025-2035
  • Figure 179: South Asia Market Attractiveness by End use industry, 2025-2035
  • Figure 180: South Asia Market Attractiveness by Country, 2025-2035
  • Figure 181: Oceania Market Value (USD Million) by Material type, 2025-2035
  • Figure 182: Oceania Market Value (USD Million) by Thickness, 2025-2035
  • Figure 183: Oceania Market Value (USD Million) by Sales channel, 2025-2035
  • Figure 184: Oceania Market Value (USD Million) by End use industry, 2025-2035
  • Figure 185: Oceania Market Value (USD Million) by Country, 2025-2035
  • Figure 186: Oceania Market Value (USD Million) Analysis by Country, 2020-2035
  • Figure 187: Oceania Market Volume (Units) Analysis by Country, 2020-2035
  • Figure 188: Oceania Market Value Share (%) and BPS Analysis by Country, 2025-2035
  • Figure 189: Oceania Market Y-o-Y Growth (%) Projections by Country, 2025-2035
  • Figure 190: Oceania Market Value (USD Million) Analysis by Material type, 2020-2035
  • Figure 191: Oceania Market Volume (Units) Analysis by Material type, 2020-2035
  • Figure 192: Oceania Market Value Share (%) and BPS Analysis by Material type, 2025-2035
  • Figure 193: Oceania Market Y-o-Y Growth (%) Projections by Material type, 2025-2035
  • Figure 194: Oceania Market Value (USD Million) Analysis by Thickness, 2020-2035
  • Figure 195: Oceania Market Volume (Units) Analysis by Thickness, 2020-2035
  • Figure 196: Oceania Market Value Share (%) and BPS Analysis by Thickness, 2025-2035
  • Figure 197: Oceania Market Y-o-Y Growth (%) Projections by Thickness, 2025-2035
  • Figure 198: Oceania Market Value (USD Million) Analysis by Sales channel, 2020-2035
  • Figure 199: Oceania Market Volume (Units) Analysis by Sales channel, 2020-2035
  • Figure 200: Oceania Market Value Share (%) and BPS Analysis by Sales channel, 2025-2035
  • Figure 201: Oceania Market Y-o-Y Growth (%) Projections by Sales channel, 2025-2035
  • Figure 202: Oceania Market Value (USD Million) Analysis by End use industry, 2020-2035
  • Figure 203: Oceania Market Volume (Units) Analysis by End use industry, 2020-2035
  • Figure 204: Oceania Market Value Share (%) and BPS Analysis by End use industry, 2025-2035
  • Figure 205: Oceania Market Y-o-Y Growth (%) Projections by End use industry, 2025-2035
  • Figure 206: Oceania Market Attractiveness by Material type, 2025-2035
  • Figure 207: Oceania Market Attractiveness by Thickness, 2025-2035
  • Figure 208: Oceania Market Attractiveness by Sales channel, 2025-2035
  • Figure 209: Oceania Market Attractiveness by End use industry, 2025-2035
  • Figure 210: Oceania Market Attractiveness by Country, 2025-2035
  • Figure 211: MEA Market Value (USD Million) by Material type, 2025-2035
  • Figure 212: MEA Market Value (USD Million) by Thickness, 2025-2035
  • Figure 213: MEA Market Value (USD Million) by Sales channel, 2025-2035
  • Figure 214: MEA Market Value (USD Million) by End use industry, 2025-2035
  • Figure 215: MEA Market Value (USD Million) by Country, 2025-2035
  • Figure 216: MEA Market Value (USD Million) Analysis by Country, 2020-2035
  • Figure 217: MEA Market Volume (Units) Analysis by Country, 2020-2035
  • Figure 218: MEA Market Value Share (%) and BPS Analysis by Country, 2025-2035
  • Figure 219: MEA Market Y-o-Y Growth (%) Projections by Country, 2025-2035
  • Figure 220: MEA Market Value (USD Million) Analysis by Material type, 2020-2035
  • Figure 221: MEA Market Volume (Units) Analysis by Material type, 2020-2035
  • Figure 222: MEA Market Value Share (%) and BPS Analysis by Material type, 2025-2035
  • Figure 223: MEA Market Y-o-Y Growth (%) Projections by Material type, 2025-2035
  • Figure 224: MEA Market Value (USD Million) Analysis by Thickness, 2020-2035
  • Figure 225: MEA Market Volume (Units) Analysis by Thickness, 2020-2035
  • Figure 226: MEA Market Value Share (%) and BPS Analysis by Thickness, 2025-2035
  • Figure 227: MEA Market Y-o-Y Growth (%) Projections by Thickness, 2025-2035
  • Figure 228: MEA Market Value (USD Million) Analysis by Sales channel, 2020-2035
  • Figure 229: MEA Market Volume (Units) Analysis by Sales channel, 2020-2035
  • Figure 230: MEA Market Value Share (%) and BPS Analysis by Sales channel, 2025-2035
  • Figure 231: MEA Market Y-o-Y Growth (%) Projections by Sales channel, 2025-2035
  • Figure 232: MEA Market Value (USD Million) Analysis by End use industry, 2020-2035
  • Figure 233: MEA Market Volume (Units) Analysis by End use industry, 2020-2035
  • Figure 234: MEA Market Value Share (%) and BPS Analysis by End use industry, 2025-2035
  • Figure 235: MEA Market Y-o-Y Growth (%) Projections by End use industry, 2025-2035
  • Figure 236: MEA Market Attractiveness by Material type, 2025-2035
  • Figure 237: MEA Market Attractiveness by Thickness, 2025-2035
  • Figure 238: MEA Market Attractiveness by Sales channel, 2025-2035
  • Figure 239: MEA Market Attractiveness by End use industry, 2025-2035
  • Figure 240: MEA Market Attractiveness by Country, 2025-2035

Frequently Asked Questions

What was the overall size of the kraft paper bags market in 2025?

The overall market size for the kraft paper bags market was USD 4.9 billion in 2025.

How big is the kraft paper bags market expected to be in 2035?

The kraft paper bags market is expected to reach USD 9.4 billion in 2035.

What will drive the demand for kraft paper bags during the forecast period?

The demand for kraft paper bags is expected to rise due to increasing environmental concerns, government regulations banning plastic bags, growing consumer preference for sustainable packaging, and expanding applications in retail, food, and e-commerce sectors.

List the top five countries contributing to the kraft paper bags market.

The top five countries driving the development of the kraft paper bags market are the USA, Germany, China, India, and France.

Which segment in type is expected to lead in the kraft paper bags market?

Flat-bottom Kraft paper bags and stand-up kraft paper bags are expected to dominate the market due to their growing usage in retail, grocery, and food service applications.

Explore Similar Insights

Future Market Insights

Kraft Paper Bags Market