The Saturated Kraft Paper Industry Analysis in Europe is estimated to be valued at USD 592.5 million in 2025 and is projected to reach USD 894.4 million by 2035, registering a compound annual growth rate (CAGR) of 4.2% over the forecast period.
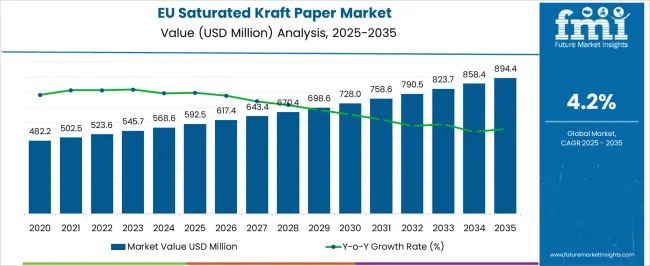
| Metric | Value |
|---|---|
| Saturated Kraft Paper Industry Analysis in Europe Estimated Value in (2025 E) | USD 592.5 million |
| Saturated Kraft Paper Industry Analysis in Europe Forecast Value in (2035 F) | USD 894.4 million |
| Forecast CAGR (2025 to 2035) | 4.2% |
The saturated kraft paper industry in Europe is experiencing stable growth. Demand is being driven by rising usage in packaging, industrial applications, and specialty paper products.
Current market dynamics reflect stringent environmental regulations, increasing adoption of sustainable materials, and growing awareness of recyclability and biodegradability among manufacturers and consumers. Production processes are being optimized to improve efficiency, reduce waste, and enhance product quality, while supply chain integration ensures consistent raw material availability.
The future outlook is shaped by continued investment in advanced manufacturing technologies, expansion of specialty paper applications, and the shift toward lightweight, high-strength paper solutions to meet evolving industrial and retail requirements Growth rationale is founded on the ability of saturated kraft paper to offer durability, moisture resistance, and cost-effectiveness across multiple applications, the ongoing focus on environmentally responsible production, and the adaptability of the European market to incorporate innovative paper grades, all of which collectively support steady market expansion and adoption over the forecast period.
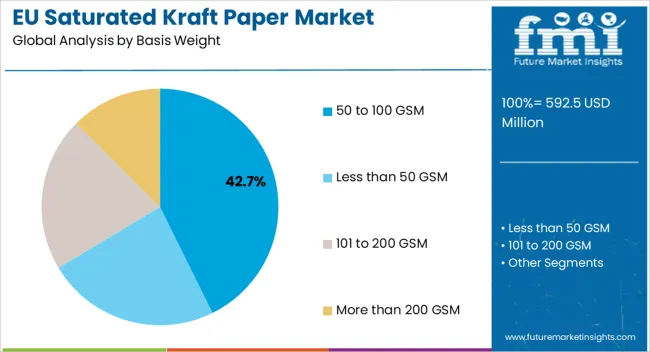
The 50 to 100 GSM segment, holding 42.70% of the basis weight category, has been leading due to its balanced combination of strength, flexibility, and cost efficiency. Its adoption is being reinforced by compatibility with a wide range of processing and converting operations, while operational consistency and uniformity in sheet formation have supported industrial reliability.
The segment has benefited from increasing preference for lightweight materials that reduce transportation costs and improve environmental footprint. Production optimizations, including precision refining and controlled drying, have enhanced performance characteristics and minimized defects.
Market acceptance has been further strengthened by alignment with sustainability standards and regulatory compliance Continued focus on improving mechanical properties, moisture resistance, and surface smoothness is expected to sustain the segment’s market share and reinforce its dominance within the European saturated kraft paper industry.
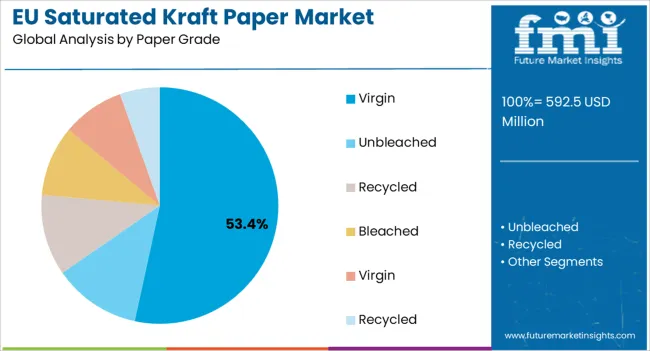
The virgin paper grade segment, representing 53.40% of the paper grade category, has maintained its leading position due to its superior strength, cleanliness, and uniformity compared to recycled alternatives. Adoption has been supported by consistent supply of high-quality pulp, stringent quality controls, and regulatory adherence.
Demand has been sustained by applications requiring premium performance, such as packaging for food and industrial goods, where hygiene, durability, and printability are critical. Production processes have been refined to maximize fiber utilization and enhance sheet formation.
The segment’s market share is reinforced by ongoing investments in pulp sourcing, process efficiency, and compliance with environmental and safety standards Continuous innovation in coating, sizing, and surface treatment is expected to maintain competitive advantage and support further adoption across European industrial and commercial applications.
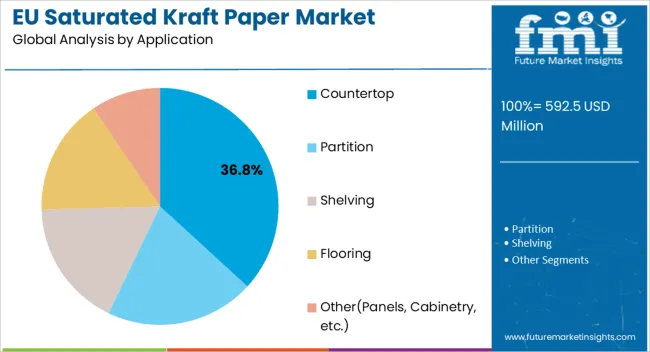
The countertop application segment, holding 36.80% of the application category, has emerged as the leading application due to its demand in retail, foodservice, and specialty packaging settings. Adoption has been driven by the material’s durability, moisture resistance, and aesthetic appeal, which ensure reliable performance in high-contact and display environments.
The segment has benefited from growing consumer preference for eco-friendly and hygienic surfaces, while manufacturers have optimized sheet weight, surface finish, and coating properties to meet specific application requirements. Supply chain efficiency and product availability through established distribution networks have further strengthened market acceptance.
Continued focus on innovation, including enhanced resistance to grease, water, and mechanical stress, is expected to sustain the segment’s market share and support continued adoption in European countertop and related applications.
Revenue to Expand Over 1.5X through 2035
The Europe saturated kraft paper revenue is projected to expand over 1.4X through 2035, amid a 1.6% increase in the expected CAGR compared to the historical ones. This growth can be attributed to rapid growth of residential and industrial sectors and growing need for sustainable, high strength, and water-resistant materials.
Other drivers and trends in the saturated kraft paper business:
Sales of Unbleached Saturated Kraft Paper to Outpace Bleached Ones
As per the latest analysis, unbleached saturated kraft paper segment is anticipated to acquire more than 58.5% value share in 2035. Over the forecast period, sales of unbleached saturated kraft paper in Europe are expected to soar at a CAGR of 4.5%.
Europe is witnessing a high demand for unbleached saturated kraft paper owing to its multiple advantages. For instance, unbleached saturated kraft paper is less expensive and more sustainable than bleached saturated kraft paper.
The Europe saturated kraft paper business recorded a CAGR of 2.8% during the historic period, with total valuation reaching USD 592.5 million in 2025. In the forecast period, saturated kraft paper demand in Europe is projected to rise at 4.4% CAGR.
| Historical CAGR (2020 to 2025) | 2.8% |
|---|---|
| Forecast CAGR (2025 to 2035) | 4.4% |
Saturated kraft paper is gaining immense traction due to the growing adoption of sustainable solutions in Europe. Recently, industries such as homecare and construction have started to adopt these papers. This is expected to further improve sales growth in the region.
Saturated kraft papers are made from sawdust material and are flexible, stiff, and can withstand high tension. They are soaked in resin or other saturating agents, which enhance their properties.
Saturated kraft paper possesses properties like high strength, water resistance, durability, etc. The application of saturated kraft papers is mainly in commercial and residential sectors. Growing demographic changes and advancement in these sectors will positively affect the growth of the saturated kraft paper business in Europe.
Saturated kraft papers act as a resistant material against moisture. They are largely used in applications such as countertops, partitions, shelving, flooring, panels, cabinetry, etc. Rising usage in these applications is expected to boost sales of saturated kraft papers in Europe through 2035.
With people across Europe becoming conscious about craftsmanship and aesthetic experiences, the adoption of products like saturated paper is expected to rise rapidly. This will boost the Europe saturated kraft paper business.
| Particular | Value CAGR |
|---|---|
| H1 | 4.1% (2025 to 2035) |
| H2 | 2.9% (2025 to 2035) |
| H1 | 3.9% (2025 to 2035) |
| H2 | 2.8% (2025 to 2035) |
Increasing Adoption of Digital Printing for Enhanced Customer Engagement
The adoption of digital printing in saturated kraft paper is getting traction across Europe. Recently, industries started to adopt digital printing as their key printing method due to convenience and ease.
The rise of online distribution platforms such as e-commerce has prompted several businesses to shift towards online platforms. This is expected to create new growth avenues for the Europe saturated kraft paper business.
A visually appealing, aesthetic design in packaging and a memorable unboxing experience will further improve the business of saturated kraft papers. Using digital printing, manufacturers can adopt various security measures such as QR Codes and Barcodes in saturated kraft papers. This will enhance the security of packaging.
Increasing Building and Construction Projects in High-Growth Economies
The saturated kraft paper business is expected to experience significant growth during the forecast period. This is mainly due to rising usage of saturated kraft paper in the thriving building and construction sector.
Saturated kraft papers are moisture resistant and hence provide protection for cement, furniture, and allied products. This is prompting people across Europe to use these products.
Countries such as Germany, the United Kingdom, and Italy have shown a significant improvement in the furniture sector. This is expected to uplift demand for saturated kraft paper and boost the European saturation processed paper sector.
The population in Europe has nearly doubled over the past three decades. This has resulted significant rate of urbanization and an increase in the use of construction materials. Driven by this, demand for saturated kraft paper in Europe is projected to grow steadily through 2035.
Rising Usage of Contemporary Interiors Driving Growth
The Europe saturated kraft paper business is witnessing significant growth due to the rise in the adoption of contemporary interior design trends. Today, interior designers and homeowners across European countries are embracing modern aesthetics, and saturated kraft papers have become a versatile and sustainable material choice for various applications.
Saturated kraft paper has the unique ability to mimic materials such as wood, stone, and leather. This makes it a preferred choice for making stylish interiors. By providing this material for wall covering, flooring, furniture laminators, and decorative applications, manufacturers can acquire a significant consumer base in the region.
The below table shows the estimated growth rates of key countries in Europe. Among these, Italy, BENELUX, and Poland are set to record higher CAGRs of 5.6%, 7.3%, and 5.8%, respectively, through 2035.
| Countries | Projected CAGR (2025 to 2035) |
|---|---|
| Germany | 3.2% |
| France | 4.0% |
| United Kingdom | 3.6% |
| Italy | 5.6% |
| Poland | 5.8% |
| BENELUX | 7.3% |
The United Kingdom saturated kraft paper business size is projected to reach USD 894.4 million in 2035. Over the assessment period, demand for saturated kraft papers in the country will likely rise at 3.6% CAGR.
Multiple factors are expected to stimulate growth in the United Kingdom through 2035. These include rising need for sustainable packaging solutions and growing adoption of saturated kraft papers in e-commerce packaging.
People across the United Kingdom are becoming aware of the environmental impact of packaging materials. As a result, businesses such as e-commerce and the food industry are increasingly using eco-friendly packaging solutions like saturated kraft paper.
Sales of saturated kraft papers in Germany are projected to soar at 3.2% CAGR during the assessment period. Total valuation in the country is set to reach USD 139.0 million by 2035. This is due to growing adoption of saturated kraft paper in Germany’s construction sector.
Saturated kraft paper is widely used in the building & construction sector for several applications. For instance, it is used for roofing and insulation. Hence, expansion of construction industry in Germany will continue to fuel sales of kraft paper solutions through 2035.
The below section shows the more than 200 GSM segment dominating the Europe saturated kraft paper business in terms of basic weight. It is forecast to thrive at 5.6% CAGR between 2025 and 2035.
Based on application, the flooring segment is anticipated to hold a dominant share through 2035. It is poised to exhibit a CAGR of 3.8% during the forecast period.
| Basic Weight | Value CAGR |
|---|---|
| More than 200 GSM | 5.6% |
| 101 GSM to 200 GSM | 2.8% |
Among the various basis weights, more than 200 GSM saturated kraft paper segment will continue to dominate the target business, holding 48.5% value share in 2035. This dominance is attributed to the fact that the above 200 GSM saturated kraft paper offers better barrier properties and is adopted in construction products such as cements.
Over the forecast period, demand for more than 200 GSM saturated kraft paper in Europe is expected to rise at 5.6% CAGR. It will remain a key revenue-generation segment for saturated kraft paper manufacturers.
| Application | Value CAGR |
|---|---|
| Flooring | 3.8% |
| Countertop | 4.2% |
As per the latest saturated kraft paper analysis, usage of saturated kraft paper is expected to remain high in flooring applications. This is because it is an ideal choice for underlayment and backing materials in various types of flooring, including laminate, engineered wood, and vinyl.
The flooring segment is anticipated to thrive at 3.8% CAGR during the assessment period. It will likely total USD 894.4.0 million by 2035, accounting for a revenue share of 32.5%.
Saturated kraft paper is waterproof and more durable, making it versatile for flooring applications. It is widely used as a backing or underlayment for other flooring materials, including hardwood, laminate, and vinyl.
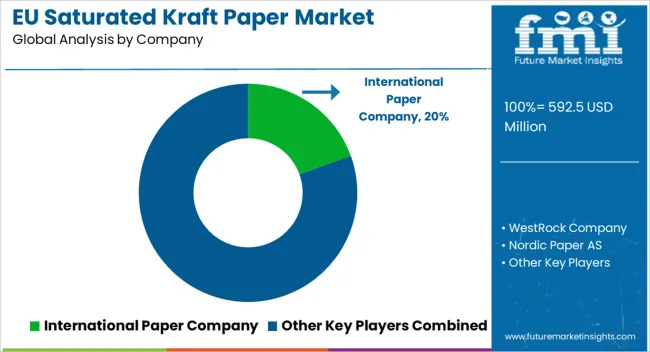
Europe, a leading industrial hub with significant opportunities for innovation in several sectors, observes a region-wise variety in customer behavioral patterns and packaging trends. Europe-based saturated kraft paper companies are primarily focused on improving material quality and sustainable integrity.
Key manufacturers of saturated kraft paper in Europe include International Paper Company, WestRock Company, Nordic Paper AS, Ahlstrom, Stora Enso Oyj, MM Kotkamills, Mondi plc, Formica group, and Ranheim paper.
Recent Developments in the Europe Saturated Kraft Paper Business:
| Attribute | Details |
|---|---|
| Estimated Business Value (2025) | USD 592.5 million |
| Projected Business Value (2035) | USD 894.4 million |
| Anticipated Growth Rate (2025 to 2035) | 4.2% CAGR |
| Historical Data | 2020 to 2025 |
| Forecast Period | 2025 to 2035 |
| Quantitative Units | Revenue in USD Million, Volume in ‘000 Units, and CAGR from 2025 to 2035 |
| Report Coverage | Revenue Forecast, Volume Forecast, Company Ranking, Competitive Landscape, Growth Factors, Trends and Pricing Analysis |
| Segments Covered | Basis Weight, Paper Grade, Application, End Use, Countries |
| Key Countries Covered | Germany, France, United Kingdom, Spain, Italy, Nordic, BENELUX, Poland, Rest of Europe |
| Key Companies Profiled |
International Paper Company; WestRock Company; Nordic Paper AS; Ahlstrom; Stora Enso Oyj; MM Kotkamills; Modi Plc; Formica Group; Ranheim Paper & Board |
The global saturated kraft paper industry analysis in Europe is estimated to be valued at USD 592.5 million in 2025.
The market size for the saturated kraft paper industry analysis in Europe is projected to reach USD 894.4 million by 2035.
The saturated kraft paper industry analysis in Europe is expected to grow at a 4.2% CAGR between 2025 and 2035.
The key product types in saturated kraft paper industry analysis in Europe are 50 to 100 gsm, less than 50 gsm, 101 to 200 gsm and more than 200 gsm.
In terms of paper grade, virgin segment to command 53.4% share in the saturated kraft paper industry analysis in Europe in 2025.


Our Research Products

The "Full Research Suite" delivers actionable market intel, deep dives on markets or technologies, so clients act faster, cut risk, and unlock growth.

The Leaderboard benchmarks and ranks top vendors, classifying them as Established Leaders, Leading Challengers, or Disruptors & Challengers.

Locates where complements amplify value and substitutes erode it, forecasting net impact by horizon

We deliver granular, decision-grade intel: market sizing, 5-year forecasts, pricing, adoption, usage, revenue, and operational KPIs—plus competitor tracking, regulation, and value chains—across 60 countries broadly.

Spot the shifts before they hit your P&L. We track inflection points, adoption curves, pricing moves, and ecosystem plays to show where demand is heading, why it is changing, and what to do next across high-growth markets and disruptive tech

Real-time reads of user behavior. We track shifting priorities, perceptions of today’s and next-gen services, and provider experience, then pace how fast tech moves from trial to adoption, blending buyer, consumer, and channel inputs with social signals (#WhySwitch, #UX).

Partner with our analyst team to build a custom report designed around your business priorities. From analysing market trends to assessing competitors or crafting bespoke datasets, we tailor insights to your needs.
Supplier Intelligence
Discovery & Profiling
Capacity & Footprint
Performance & Risk
Compliance & Governance
Commercial Readiness
Who Supplies Whom
Scorecards & Shortlists
Playbooks & Docs
Category Intelligence
Definition & Scope
Demand & Use Cases
Cost Drivers
Market Structure
Supply Chain Map
Trade & Policy
Operating Norms
Deliverables
Buyer Intelligence
Account Basics
Spend & Scope
Procurement Model
Vendor Requirements
Terms & Policies
Entry Strategy
Pain Points & Triggers
Outputs
Pricing Analysis
Benchmarks
Trends
Should-Cost
Indexation
Landed Cost
Commercial Terms
Deliverables
Brand Analysis
Positioning & Value Prop
Share & Presence
Customer Evidence
Go-to-Market
Digital & Reputation
Compliance & Trust
KPIs & Gaps
Outputs
Full Research Suite comprises of:
Market outlook & trends analysis
Interviews & case studies
Strategic recommendations
Vendor profiles & capabilities analysis
5-year forecasts
8 regions and 60+ country-level data splits
Market segment data splits
12 months of continuous data updates
DELIVERED AS:
PDF EXCEL ONLINE
Europe Retail Paper Bag Market Trends – Growth & Forecast 2023-2033
PE Coated Paper Market Trends & Industry Growth Forecast 2024-2034
Glassine Paper Industry Analysis in Western Europe Size and Share Forecast Outlook 2025 to 2035
Europe Ecommerce Paper Bags Market Analysis – Trends & Forecast 2024-2034
Barrier Coated Paper Industry Analysis in Europe - Demand, Growth & Future Outlook 2025 to 2035
Machine Glazed Paper Industry Analysis in Western Europe Size and Share Forecast Outlook 2025 to 2035
Europe Flexible Laminated Paper Market Trends – Forecast 2024-2034
Kraft Paper Market Size and Share Forecast Outlook 2025 to 2035
Kraft Paper Machine Market Analysis - Size, Share, and Forecast Outlook 2025 to 2035
Kraft Paper Bags Market Size, Share & Forecast 2025 to 2035
Kraft Paper Pouch Market Growth – Demand & Forecast 2025 to 2035
Kraft Paper Shopping Bags Market Growth – Size, Trends & Forecast 2024 to 2034
Kraft Paper Bakery Bags Market
Kraft Paper Mailer Market
Kraft Paper Tapes Market
Kraft Paper SOS Bag Market
Europe Décor Paper Market Insights – Demand & Growth 2023-2032
Decor Paper Industry Analysis in India Size and Share Forecast Outlook 2025 to 2035
Paper Tubes & Core Industry Analysis in United States Trends, Size, and Forecast for 2025-2035
Industry Analysis of Paper Bag in North America Size and Share Forecast Outlook 2025 to 2035

Thank you!
You will receive an email from our Business Development Manager. Please be sure to check your SPAM/JUNK folder too.
Chat With
MaRIA