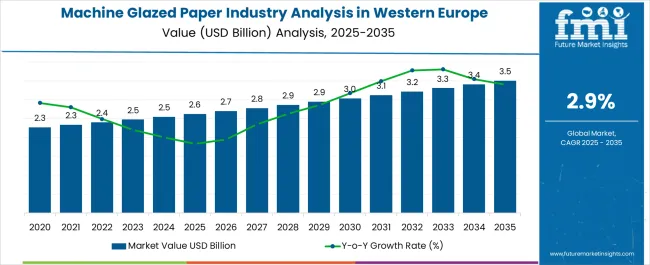
The Machine Glazed Paper Industry Analysis in Western Europe is estimated to be valued at USD 2.6 billion in 2025 and is projected to reach USD 3.5 billion by 2035, registering a compound annual growth rate (CAGR) of 2.9% over the forecast period.

| Metric | Value |
|---|---|
| Machine Glazed Paper Industry Analysis in Western Europe Estimated Value in (2025 E) | USD 2.6 billion |
| Machine Glazed Paper Industry Analysis in Western Europe Forecast Value in (2035 F) | USD 3.5 billion |
| Forecast CAGR (2025 to 2035) | 2.9% |
The machine glazed paper industry in Western Europe is experiencing moderate growth. Increasing demand from packaging, hygiene, and printing sectors is driving market expansion.
Current market dynamics are characterized by technological advancements in paper production, stringent environmental regulations, and a growing emphasis on sustainable sourcing. Producers are investing in process optimization, energy-efficient machinery, and quality improvement initiatives to maintain competitiveness.
The future outlook is supported by the rising adoption of machine glazed paper in flexible packaging and tissue applications, coupled with regional initiatives promoting recycling and circular economy practices Growth rationale is founded on the versatility of machine glazed paper across end-use industries, the capacity of manufacturers to meet evolving quality standards, and the strategic alignment with sustainability trends, which together are expected to sustain market growth and enhance value capture within the region.

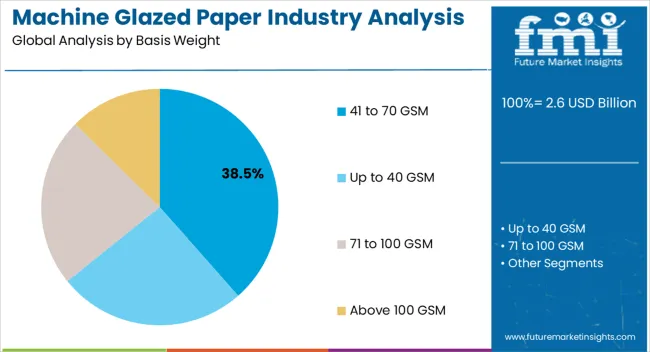
The 41 to 70 GSM segment, holding 38.50% of the basis weight category, has emerged as the leading segment due to its optimal balance between strength and flexibility. It is widely utilized in tissue and packaging applications where lightweight yet durable paper is required.
Production processes have been optimized to ensure uniformity, smoothness, and printability, enhancing market acceptance. Demand has been supported by consistent industrial usage and regulatory compliance in food-contact and hygiene applications.
Manufacturers are leveraging technological improvements in coating and finishing to maintain product performance, while the segment benefits from stable raw material supply chains Continued investment in process efficiency and sustainability practices is expected to sustain its market share and reinforce its position as a preferred basis weight in Western Europe.

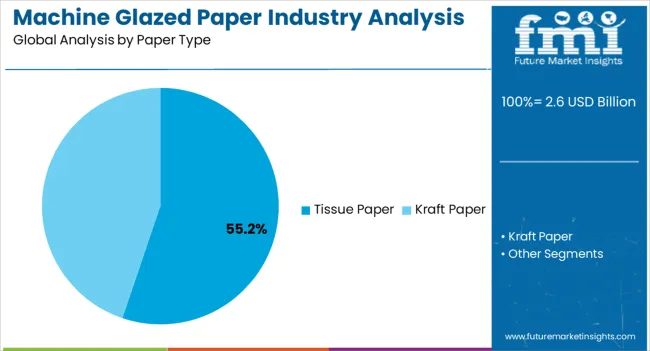
The tissue paper segment, representing 55.20% of the paper type category, has maintained its dominance due to high consumption in hygiene, household, and institutional applications. Adoption has been driven by favorable tactile properties, absorbency, and compatibility with consumer preferences for soft and strong paper products.
Market share has been strengthened through technological enhancements in manufacturing, including improved creping and embossing techniques, which elevate product quality. Distribution networks across retail and industrial channels have ensured accessibility, while sustainability initiatives and recycled content integration have enhanced acceptance among environmentally conscious consumers.
Continued innovation and alignment with regional regulatory standards are expected to sustain segment leadership and support incremental growth.

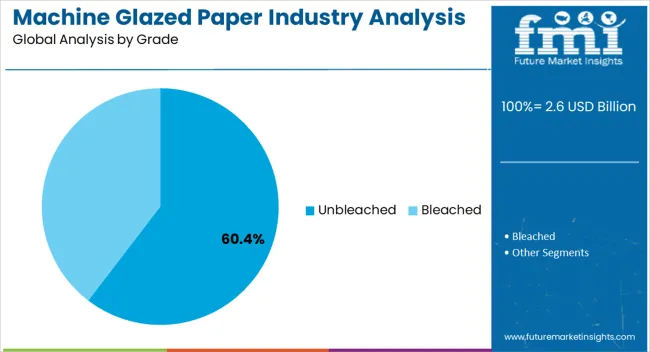
The unbleached segment, accounting for 60.40% of the grade category, has led the market due to its environmental benefits, lower production costs, and suitability for packaging and tissue applications. Demand has been reinforced by increasing regulatory and consumer focus on sustainable materials and reduced chemical usage.
Manufacturing processes have been adapted to optimize fiber retention, mechanical strength, and surface finish, ensuring quality consistency. Supply chains have been stabilized through reliable sourcing of raw pulp and integration of recycled content.
Continued emphasis on eco-friendly production and alignment with circular economy initiatives is expected to sustain the segment’s market share and strengthen its position as the preferred grade in Western Europe.
The United Kingdom is projected to experience a CAGR of 3.7% through 2035, indicating a consistent growth trajectory in its machine glazed paper industry. Italy anticipates a CAGR of 3.4%, reflecting a sustained but slightly moderated expansion in the industry, aligning with regional economic dynamics and industrial trends.
| Countries | CAGR from 2025 to 2035 |
|---|---|
| United Kingdom | 3.7% |
| Italy | 3.4% |
The machine glazed paper industry in the United Kingdom exhibits a steady growth trajectory with a CAGR of 3.7% through 2035. This suggests a sustained demand for machine glazed paper in the region, possibly driven by packaging requirements and adherence to sustainable practices.
The positive CAGR underscores the resilience and adaptability of the industry to evolve industrial dynamics within the United Kingdom.
The machine glazed paper industry in Italy maintains a CAGR of 3.4% through 2035, indicating a consistent upward trend in industrial demand. The moderate but positive growth reflects the ability of the industry to navigate challenges and capitalize on opportunities within industries of Italy.
Factors such as increased awareness of sustainable packaging and evolving consumer preferences likely contribute to this growth, making Italy a notable player in the ongoing development of the machine glazed paper sector.
The section provides an overview of the machine glazed paper industry forecast based on two key segments- paper type and grade. Based on paper type, the kraft paper market share shows its crucial role in meeting industrial requirements.
The substantial presence of unbleached paper emphasizes the industrial commitment to environmentally responsible practices. The confluence of durability and environmentally conscious practices shape the industrial paper landscape, reflecting the evolving preferences and priorities in 2025.
| Category | Industrial Share in 2025 |
|---|---|
| Kraft Paper | 81.9% |
| Unbleached | 69.5% |
In 2025, the industrial landscape is expected to exhibit a dominant presence of kraft paper, securing a revenue share of 81.9%. This signifies a substantial industrial preference for Kraft Paper, reflecting its versatility and applicability across various industries.
The strength, durability, and environmentally conscious material attributes contribute to its widespread adoption in diverse industrial applications.
Unbleached holds a significant share of 69.5%, underscoring the industrial inclination towards sustainable and minimally processed paper products.
The preference for unbleached paper aligns with the growing awareness of environmental considerations as businesses prioritize responsible solutions in their industrial processes.
In March 2025, BillerudKorsnas AB acquired Verso Corporation, a United States-based manufacturer specializing in coated groundwood, coated freesheet, and niche products like machine glazed paper
| Attribute | Details |
|---|---|
| Estimated Industry Size in 2025 | USD 2.6 billion |
| Projected Industry Size in 2035 | USD 3.5 billion |
| Anticipated CAGR between 2025 to 2035 | 2.9% CAGR |
| Demand Forecast for the Machine Glazed Paper Industry in Western Europe | 2025 to 2035 |
| Report Coverage | Industry Size, Industry Trends, Analysis of key factors influencing the Machine Glazed Paper Industry in Western Europe, Insights on Global Players and their Industry Strategy in Western Europe, Ecosystem Analysis of Local and Regional Western Europe Providers |
| Key Countries Analyzed | The United Kingdom, Germany, France, The Netherlands, Italy |
| Key Companies Profiled | International Paper Company; Nippon Paper Industries; Stora Enso; Smurfit Kappa Group; Mondi Group; BILLERUD; Heinzel Group; Burgo Group; SCG Packaging; Verso Corporation |
The global machine glazed paper industry analysis in Western Europe is estimated to be valued at USD 2.6 billion in 2025.
The market size for the machine glazed paper industry analysis in Western Europe is projected to reach USD 3.5 billion by 2035.
The machine glazed paper industry analysis in Western Europe is expected to grow at a 3.0% CAGR between 2025 and 2035.
The key product types in machine glazed paper industry analysis in Western Europe are 41 to 70 gsm, up to 40 gsm, 71 to 100 gsm and above 100 gsm.
In terms of paper type, tissue paper segment to command 55.2% share in the machine glazed paper industry analysis in Western Europe in 2025.


Our Research Products

The "Full Research Suite" delivers actionable market intel, deep dives on markets or technologies, so clients act faster, cut risk, and unlock growth.

The Leaderboard benchmarks and ranks top vendors, classifying them as Established Leaders, Leading Challengers, or Disruptors & Challengers.

Locates where complements amplify value and substitutes erode it, forecasting net impact by horizon

We deliver granular, decision-grade intel: market sizing, 5-year forecasts, pricing, adoption, usage, revenue, and operational KPIs—plus competitor tracking, regulation, and value chains—across 60 countries broadly.

Spot the shifts before they hit your P&L. We track inflection points, adoption curves, pricing moves, and ecosystem plays to show where demand is heading, why it is changing, and what to do next across high-growth markets and disruptive tech

Real-time reads of user behavior. We track shifting priorities, perceptions of today’s and next-gen services, and provider experience, then pace how fast tech moves from trial to adoption, blending buyer, consumer, and channel inputs with social signals (#WhySwitch, #UX).

Partner with our analyst team to build a custom report designed around your business priorities. From analysing market trends to assessing competitors or crafting bespoke datasets, we tailor insights to your needs.
Supplier Intelligence
Discovery & Profiling
Capacity & Footprint
Performance & Risk
Compliance & Governance
Commercial Readiness
Who Supplies Whom
Scorecards & Shortlists
Playbooks & Docs
Category Intelligence
Definition & Scope
Demand & Use Cases
Cost Drivers
Market Structure
Supply Chain Map
Trade & Policy
Operating Norms
Deliverables
Buyer Intelligence
Account Basics
Spend & Scope
Procurement Model
Vendor Requirements
Terms & Policies
Entry Strategy
Pain Points & Triggers
Outputs
Pricing Analysis
Benchmarks
Trends
Should-Cost
Indexation
Landed Cost
Commercial Terms
Deliverables
Brand Analysis
Positioning & Value Prop
Share & Presence
Customer Evidence
Go-to-Market
Digital & Reputation
Compliance & Trust
KPIs & Gaps
Outputs
Full Research Suite comprises of:
Market outlook & trends analysis
Interviews & case studies
Strategic recommendations
Vendor profiles & capabilities analysis
5-year forecasts
8 regions and 60+ country-level data splits
Market segment data splits
12 months of continuous data updates
DELIVERED AS:
PDF EXCEL ONLINE
Machine Condition Monitoring Market Size and Share Forecast Outlook 2025 to 2035
Machine Vision Camera Market Size and Share Forecast Outlook 2025 to 2035
Machine Tool Oils Market Size and Share Forecast Outlook 2025 to 2035
Machine Vision System And Services Market Size and Share Forecast Outlook 2025 to 2035
Machine Tool Cooling System Market Analysis - Size, Share, and Forecast Outlook 2025 to 2035
Machine Tool Touch Probe Market Analysis - Size, Growth, and Forecast 2025 to 2035
Machine Mount Market Analysis - Size & Industry Trends 2025 to 2035
Machine Control System Market Growth – Trends & Forecast 2025 to 2035
Machine Automation Controller Market Growth – Trends & Forecast 2025 to 2035
Machine-to-Machine (M2M) Connections Market – IoT & Smart Devices 2025 to 2035
Machine Safety Market Analysis by Component, Industry, and Region Through 2035
Machine Vision Market Insights – Growth & Forecast 2024-2034
Machine Learning As A Services Market
Machine Glazed Paper Market Size and Share Forecast Outlook 2025 to 2035
Key Players & Market Share in Machine Glazed Paper Industry
Machine Glazed Paper Industry Analysis in Asia Pacific Forecast Outlook 2025 to 2035
Machine Glazed Paper Industry Analysis in Korea Size and Share Forecast Outlook 2025 to 2035
Machine Glazed Paper Industry Analysis in Japan Size and Share Forecast Outlook 2025 to 2035
Machine Glazed Kraft Paper Market Forecast and Outlook 2025 to 2035
BMI Machine Market Size and Share Forecast Outlook 2025 to 2035

Thank you!
You will receive an email from our Business Development Manager. Please be sure to check your SPAM/JUNK folder too.
Chat With
MaRIA