Machine Tool Touch Probe Market Forecast and Outlook 2025 to 2035

The global machine tool touch probe market is expected to grow from USD 682.7 million in 2025 to USD 963.0 million by 2035, reflecting a CAGR of 3.5%. This growth has been fueled by the rising integration of smart manufacturing systems and precision machining, particularly within the automotive and aerospace sectors.
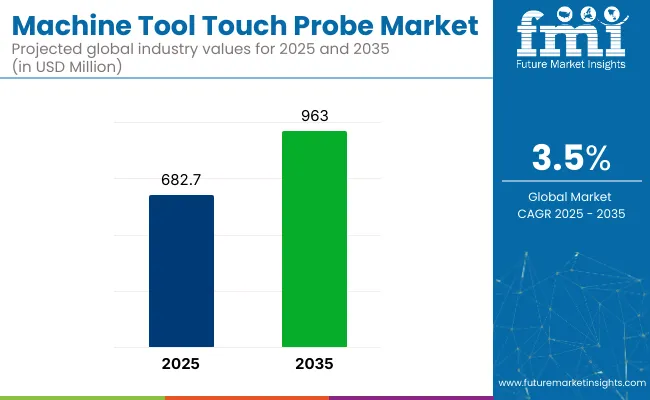
Quick Stats of Machine Tool Touch Probe Market

  • Market Value (2025): USD 682.7 million
  • Forecast Value (2035): USD 963.0 million
  • Forecast CAGR: 3.5%
  • Product Leader in 2025: 3D Touch Probes (35% Market Share)
  • Top Transmission Type: Wireless Touch Probes (53% Market Share)
  • Key Growth Region: North America (fastest-growing market in the USA with 3.6% CAGR)

Machine Tool Touch Probe Market

Metric Value
Estimated Size (2025) USD 682.7 million
Projected value (2035) USD 963.0 million
CAGR (2025 to 2035) 3.5%

The increasing adoption of Industry 4.0 technologies, along with the need for real-time data collection and error correction, has boosted the deployment of touch probes in CNC machines worldwide.

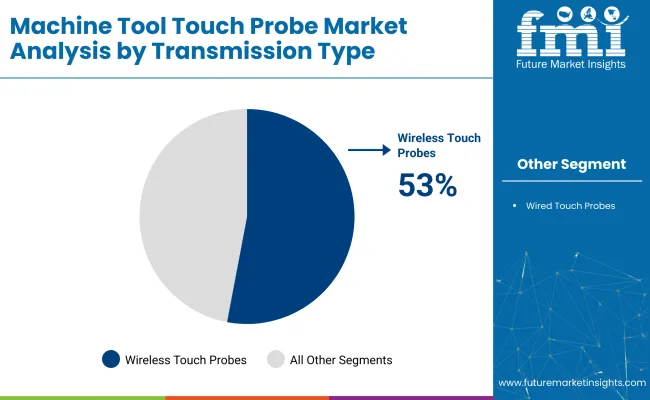
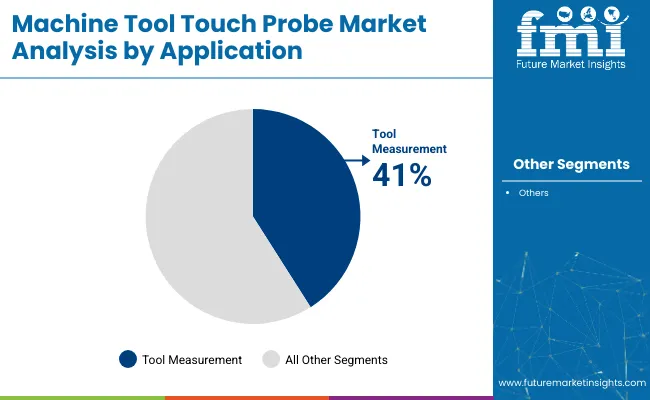
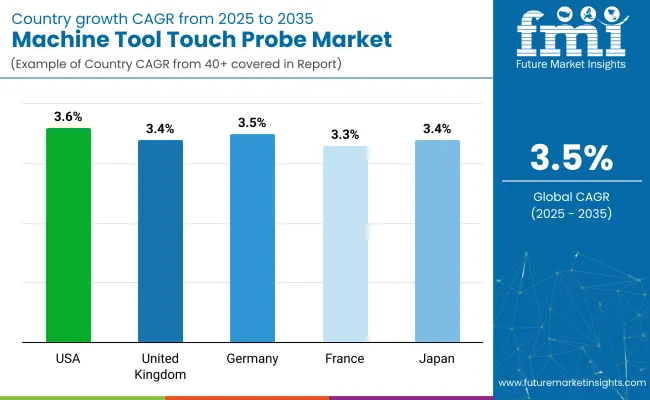
The USA is projected to hold the largest share of the global machine tool touch probe market by 2025, owing to its extensive demand in aerospace and automotive manufacturing, growing at a CAGR of 3.6%. Meanwhile, Japan is anticipated to register growth at a CAGR of 3.4%. Among all product categories, 3D touch probes are likely to retain a prominent share of 35% due to their vital role in high-complexity machining. Wireless touch probe leads the transmission type segment with 53% of the market share. Additionally, tool measurement by application accounts for 41% of the market share in 2025.

Profitability has been seen by firms such as Hexagon AB and Blum-Novotest GmbH, attributed to their early adoption of AI-enabled probes and integration with Industry 4.0 systems. On the other hand, certain cost-sensitive regions and small-scale manufacturers are expected to face adoption challenges, primarily due to the high ownership costs of wireless and predictive maintenance-integrated touch probes. Additionally, a shortage of skilled technicians, especially in emerging markets, has resulted in slow uptake despite increasing demand.

Looking ahead, the market is anticipated to benefit from ongoing investments in smart factories and the combination of wireless, optical, and AI technologies. Countries such as Japan and Germany are actively implementing digital twin strategies and CNC automation upgrades, expected to push the adoption curve forward. Furthermore, newer probes with 5G, predictive calibration, and real-time feedback are likely to reshape precision manufacturing, reducing downtime and material waste globally.

Machine Tool Touch Probe Market Analysis by Top Investment Segments

The machine tool touch probe market is segmented based on type, transmission type, application, end use, and region. In terms of type, it includes 3D touch probes, optical touch probes, and radio touch probes. By transmission type, the market is divided into wired touch probes and wireless touch probes.

By application, it includes tool measurement, workpiece measurement, and machine calibration. By end use, it covers automotive, aerospace & defense, electronics & semiconductor, industrial manufacturing, healthcare. Regionally, the market is divided into North America, Latin America, Western Europe, South Asia, East Asia, Eastern Europe, and the Middle East & Africa.
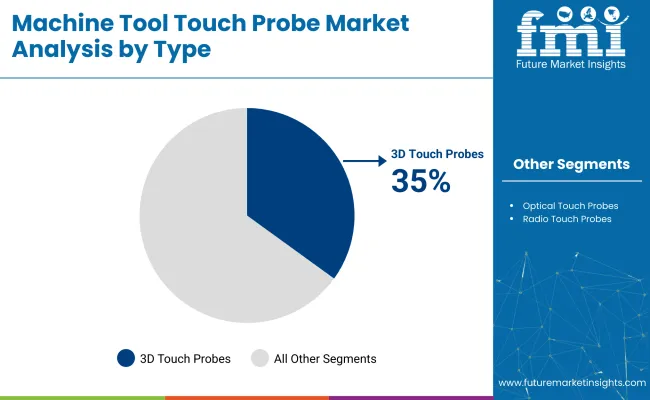
By Type, 3D Touch Probes Expected to Hold 35% Market Share

3D touch probes are anticipated to dominate the type segment due to their superior accuracy in multi-axis CNC machining operations, especially in aerospace and medical applications. The segment is expected to account for 35% of the market share by 2035. Their integration with high-speed machines for real-time surface and dimensional inspection is accelerating adoption across sectors.
  • 3D probes offer accurate 3D profiling for complex geometries
  • Ideal for high-mix, low-volume production setups
  • Favored in aerospace, defense, and surgical implant manufacturing
  • Contribute significantly to cycle time reduction

Machine Tool Touch Probe Market Analysis By Type

By Transmission Type, Wireless Probes to Lead with 53% Share in 2035

Wireless touch probes are likely to lead the transmission type segment, capturing 53% share through 2035, owing to their flexibility, ease of installation, and ability to operate without physical constraints in high-speed environments. Demand is rising in Industry 4.0-enabled smart factories.
  • Enables mobility and adaptability in compact machine environments
  • Enhances efficiency in automated production lines
  • Reduces downtime and maintenance complexity
  • Preferred for retrofitting legacy CNC systems

Machine Tool Touch Probe Market Analysis By Transmission Type

By Application, Tool Measurement Accounts for 41% of the Market Share in 2025

Tool measurement is projected to remain the primary application, holding a 41% market share in 2025, as precision in tool setting has become critical for minimizing tool wear and ensuring machining accuracy. Automated tool presetting directly boosts output consistency.
  • Reduces human error in tool calibration
  • Extends tool life through optimized usage
  • Vital for adaptive control in smart machining
  • Enhances surface finish quality in finished parts

Machine Tool Touch Probe Market Analysis By Application

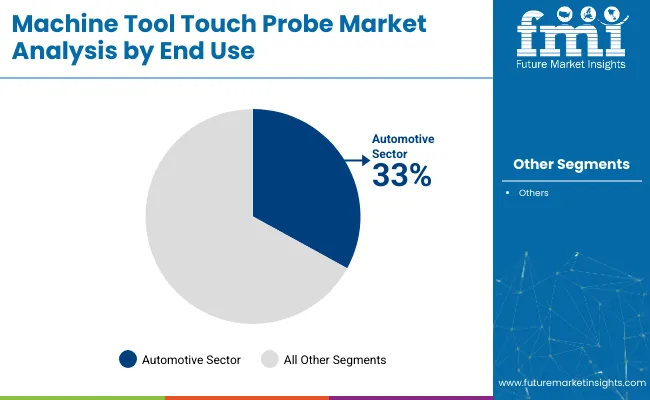
By End Use, the Automotive Sector Accounts for 33% of the Market Share in 2025

The automotive segment is expected to remain the leading segment with a 33% market share in 2025, led by EV production and the demand for lightweight, precision components. Touch probes are increasingly used for in-process QA during complex part machining.

  • Ensures accuracy in engine and chassis component production
  • Supports mass manufacturing of EV parts
  • Key to reducing defect rates in automated lines
  • Adoption is rising in both OEM and Tier 1 suppliers

Machine Tool Touch Probe Market Analysis By End Use

Top Machine Tool Touch Probe Market Dynamics

Recent Trends in the Machine Tool Touch Probe Market
  • Integration of AI and predictive maintenance features in touch probes is accelerating.
  • Wireless and optical transmission probes are replacing traditional wired systems.
  • Adoption of digital twin and smart factory frameworks is rising across key industries.
  • Increasing demand for 5-axis CNC machining tools enhances probe compatibility and usage.

Key Challenges in the Machine Tool Touch Probe Market

  • High initial cost of advanced AI-enabled and wireless probes limits adoption among SMEs.
  • Shortage of skilled technicians affects accurate probe calibration and operation.
  • Compatibility issues with legacy CNC systems create barriers for retrofit installations.
  • Need for frequent software updates and calibration disrupts uninterrupted workflows.

Analyzing Top Countries Manufacturing and Supplying Machine Tool Touch Probes

Machine Tool Touch Probe Market Country Wise Analysis

USA Machine Tool Touch Probe Market Analysis

The machine tool touch probe market in the USA is projected to grow at a CAGR of 3.6% from 2025 to 2035. This growth is driven by advanced aerospace and automotive sectors that demand real-time metrology and tool measurement precision. The rise of smart factories and Industry 4.0 technologies is facilitating widespread probe adoption in CNC operations across manufacturing clusters in states like Michigan, Texas, and California.

  • High reliance on precision machining in aerospace and defense.
  • Significant funding for digital transformation in manufacturing.
  • Increasing integration of wireless probes in automotive production lines.

UK Machine Tool Touch Probe Sales Analysis

The UK machine tool touch probe market is forecasted to expand at a CAGR of 3.4% through 2035, fueled by growth in precision engineering and government-backed initiatives like Made Smarter. Leading aerospace firms and EV manufacturers are increasingly incorporating touch probes into high-precision CNC machining environments, with London and the Midlands emerging as notable hubs for adoption.

  • Rising focus on turbine and structural part quality control.
  • Government incentives encourage automation in manufacturing.
  • Strong presence of medical device manufacturers using touch probes.

Machine Tool Touch Probe Demand Analysis in Germany

The German machine tool touch probe market is expected to grow at a CAGR of 3.5% over the forecast period, maintaining its position as a leader in industrial automation and high-speed CNC machining. With robust demand from the automotive, aerospace, and precision machinery sectors, German manufacturers are deploying AI-integrated touch probes to enhance productivity and quality assurance.

  • Home to globally leading machine tool OEMs and CNC innovators.
  • Integration of AI and IoT in touch probe systems is increasing.
  • Strong regulatory push for quality compliance and sustainability.

France Machine Tool Touch Probe Market Analysis

The French machine tool touch probe market is projected to expand at a CAGR of 3.3% between 2025 and 2035, supported by its expanding aerospace and electric vehicle industries. CNC machining centers in Toulouse and Paris are incorporating advanced touch probe systems for dimensional accuracy and process automation in aircraft and EV part manufacturing.

  • Rapid increase in EV component machining requiring tight tolerances.
  • Government programs promoting automation and smart manufacturing.
  • Rising use of optical probes in precision metal part fabrication.

Japan Machine Tool Touch Probe Market Analysis

The Japanese machine tool touch probe market is poised to grow at a CAGR of 3.4% through 2035. The country's well-established robotics, semiconductor, and automotive industries are aggressively adopting high-accuracy probes for 5-axis and high-speed machining. Companies like Fanuc, Okuma, and Mazak are spearheading innovation in intelligent CNC systems.

  • High demand for ultra-precise machining in electronics and EV sectors.
  • Government-backed initiatives promoting digital manufacturing.
  • Strong culture of R&D investment in CNC automation and AI integration.

Leading Machine Tool Touch Probe Suppliers

The machine tool touch probe market is moderately consolidated, with a handful of global players commanding a significant portion of the revenue pool. Leading companies such as Renishaw plc, Hexagon AB, Blum-Novotest GmbH, Marposs S.p.A., and Heidenhain GmbH are known for their precision technologies and wide CNC integration portfolios.

These firms are competing through technology innovation, AI-integration, wireless enhancements, and real-time metrology solutions, often leveraging exclusive patents, customer-specific customization, and strategic distribution networks.

Company strategies are centered on improving accuracy, reducing cycle time, and embedding smart factory compatibility, particularly via AI-driven diagnostic features and optical/wireless connectivity. Pricing pressure exists for cost-sensitive regions, where regional players are attempting to outshine.

Tier-1 brands are increasingly forming technology alliances with CNC machine manufacturers and investing in R&D for predictive maintenance, real-time calibration, and digital twin integration. Expansion into Asia Pacific and South America continues through local partnerships and product localization efforts. In contrast, smaller firms such as Metrol and Midaco focus on niche machining needs and retrofit markets.

Recent Machine Tool Touch Probe Industry News

  • Hexagon AB completed the acquisition of the Geomagic software suite from 3D Systems in April 2025, enhancing its 3D modeling and inspection capabilities within the Manufacturing Intelligence division.

Machine Tool Touch Probe Market Report Scope

Report Attributes Details
Current Total Market Size (2025) USD 682.7 million
Projected Market Size (2035) USD 963.0 million
CAGR (2025 to 2035) 3.5%
Base Year for Estimation 2024
Historical Period 2020 to 2024
Projections Period 2025 to 2035
Market Analysis Parameters Revenue in USD millions/ Volume in units
By Type 3D Touch Probes, Optical Touch Probes, Radio Touch Probes
By Transmission Type Wired Touch Probes, Wireless Touch Probes
By Application Tool Measurement, Workpiece Measurement, Machine Calibration
By End Use Automotive, Aerospace & Defense, Electronics & Semiconductor, Industrial Manufacturing, Healthcare
Regions Covered North America, Latin America, Western Europe, South Asia, East Asia, Eastern Europe, Middle East & Africa
Countries Covered United States, Canada, United Kingdom, Germany, France, China, Japan, South Korea, Brazil, Australia
Key Players Renishaw plc, Hexagon AB, Blum-Novotest GmbH, Marposs S.p.A., Heidenhain GmbH, OMRON Corporation, Metrol Co., Ltd., HAIMER GmbH, Tormach Inc., Midaco Corporation
Additional Attributes Dollar sales by value, segment share analysis, region-wise market breakdown, and country-wise CAGR analysis

Market Segmentation

By Type:

The market is segmented into 3D Touch Probes, Optical Touch Probes, and Radio Touch Probes.

By Transmission Type:

The industry is divided into Wired Touch Probes and Wireless Touch Probes.

By Application:

The market caters to Tool Measurement, Workpiece Measurement, and Machine Calibration.

By End-Use Industry:

The report covers key sectors, including Automotive, Aerospace & Defense, Electronics & Semiconductor, Industrial Manufacturing, and Healthcare.

By Region:

The report covers key regions, including North America, Latin America, Western Europe, Eastern Europe, East Asia, South Asia, and the Middle East & Africa (MEA).

Table of Content

  1. Executive Summary
    • Global Market Outlook
    • Demand-side Trends
    • Supply-side Trends
    • Technology Roadmap Analysis
    • Analysis and Recommendations
  2. Market Overview
    • Market Coverage / Taxonomy
    • Market Definition / Scope / Limitations
  3. Market Background
    • Market Dynamics
      • Drivers
      • Restraints
      • Opportunity
      • Trends
    • Scenario Forecast
      • Demand in Optimistic Scenario
      • Demand in Likely Scenario
      • Demand in Conservative Scenario
    • Opportunity Map Analysis
    • Product Life Cycle Analysis
    • Supply Chain Analysis
      • Supply Side Participants and their Roles
        • Producers
        • Mid-Level Participants (Traders/ Agents/ Brokers)
        • Wholesalers and Distributors
      • Value Added and Value Created at Node in the Supply Chain
      • List of Raw Material Suppliers
      • List of Existing and Potential Buyer’s
    • Investment Feasibility Matrix
    • Value Chain Analysis
      • Profit Margin Analysis
      • Wholesalers and Distributors
      • Retailers
    • PESTLE and Porter’s Analysis
    • Regulatory Landscape
      • By Key Regions
      • By Key Countries
    • Regional Parent Market Outlook
    • Production and Consumption Statistics
    • Import and Export Statistics
  4. Global Market Analysis 2020 to 2024 and Forecast, 2025 to 2035
    • Historical Market Size Value (USD Million) & Volume (Units) Analysis, 2020 to 2024
    • Current and Future Market Size Value (USD Million) & Volume (Units) Projections, 2025 to 2035
      • Y-o-Y Growth Trend Analysis
      • Absolute $ Opportunity Analysis
  5. Global Market Pricing Analysis 2020 to 2024 and Forecast 2025 to 2035
  6. Global Market Analysis 2020 to 2024 and Forecast 2025 to 2035, By Type
    • Introduction / Key Findings
    • Historical Market Size Value (USD Million) & Volume (Units) Analysis By Type, 2020 to 2024
    • Current and Future Market Size Value (USD Million) & Volume (Units) Analysis and Forecast By Type, 2025 to 2035
      • 3D Touch Probes
      • Optical Touch Probes
      • Radio Touch Probes
    • Y-o-Y Growth Trend Analysis By Type, 2020 to 2024
    • Absolute $ Opportunity Analysis By Type, 2025 to 2035
  7. Global Market Analysis 2020 to 2024 and Forecast 2025 to 2035, By Transmission Type
    • Introduction / Key Findings
    • Historical Market Size Value (USD Million) & Volume (Units) Analysis By Transmission Type, 2020 to 2024
    • Current and Future Market Size Value (USD Million) & Volume (Units) Analysis and Forecast By Transmission Type, 2025 to 2035
      • Wired Touch Probes
      • Wireless Touch Probes
    • Y-o-Y Growth Trend Analysis By Transmission Type, 2020 to 2024
    • Absolute $ Opportunity Analysis By Transmission Type, 2025 to 2035
  8. Global Market Analysis 2020 to 2024 and Forecast 2025 to 2035, By Application
    • Introduction / Key Findings
    • Historical Market Size Value (USD Million) & Volume (Units) Analysis By Application, 2020 to 2024
    • Current and Future Market Size Value (USD Million) & Volume (Units) Analysis and Forecast By Application, 2025 to 2035
      • Tool Measurement
      • Workpiece Measurement
      • Machine Calibration
    • Y-o-Y Growth Trend Analysis By Application, 2020 to 2024
    • Absolute $ Opportunity Analysis By Application, 2025 to 2035
  9. Global Market Analysis 2020 to 2024 and Forecast 2025 to 2035, By End Use
    • Introduction / Key Findings
    • Historical Market Size Value (USD Million) & Volume (Units) Analysis By End Use, 2020 to 2024
    • Current and Future Market Size Value (USD Million) & Volume (Units) Analysis and Forecast By End Use, 2025 to 2035
      • Automotive
      • Aerospace & Defense
      • Electronics & Semiconductor
      • Industrial Manufacturing
      • Healthcare
    • Y-o-Y Growth Trend Analysis By End Use, 2020 to 2024
    • Absolute $ Opportunity Analysis By End Use, 2025 to 2035
  10. Global Market Analysis 2020 to 2024 and Forecast 2025 to 2035, By Region
    • Introduction
    • Historical Market Size Value (USD Million) & Volume (Units) Analysis By Region, 2020 to 2024
    • Current Market Size Value (USD Million) & Volume (Units) Analysis and Forecast By Region, 2025 to 2035
      • North America
      • Latin America
      • Western Europe
      • Eastern Europe
      • East Asia
      • South Asia & Pacific
      • Middle East and Africa
    • Market Attractiveness Analysis By Region
  11. North America Market Analysis 2020 to 2024 and Forecast 2025 to 2035, By Country
    • Historical Market Size Value (USD Million) & Volume (Units) Trend Analysis By Market Taxonomy, 2020 to 2024
    • Market Size Value (USD Million) & Volume (Units) Forecast By Market Taxonomy, 2025 to 2035
      • By Country
        • USA
        • Canada
        • Mexico
      • By Type
      • By Transmission Type
      • By Application
      • By End Use
    • Market Attractiveness Analysis
      • By Country
      • By Type
      • By Transmission Type
      • By Application
      • By End Use
    • Key Takeaways
  12. Latin America Market Analysis 2020 to 2024 and Forecast 2025 to 2035, By Country
    • Historical Market Size Value (USD Million) & Volume (Units) Trend Analysis By Market Taxonomy, 2020 to 2024
    • Market Size Value (USD Million) & Volume (Units) Forecast By Market Taxonomy, 2025 to 2035
      • By Country
        • Brazil
        • Argentina
        • Rest of LATAM
      • By Type
      • By Transmission Type
      • By Application
      • By End Use
    • Market Attractiveness Analysis
      • By Country
      • By Type
      • By Transmission Type
      • By Application
      • By End Use
    • Key Takeaways
  13. Western Europe Market Analysis 2020 to 2024 and Forecast 2025 to 2035, By Country
    • Historical Market Size Value (USD Million) & Volume (Units) Trend Analysis By Market Taxonomy, 2020 to 2024
    • Market Size Value (USD Million) & Volume (Units) Forecast By Market Taxonomy, 2025 to 2035
      • By Country
        • Germany
        • Italy
        • France
        • UK
        • Spain
        • BENELUX
        • Nordic
        • Rest of W.Europe
      • By Type
      • By Transmission Type
      • By Application
      • By End Use
    • Market Attractiveness Analysis
      • By Country
      • By Type
      • By Transmission Type
      • By Application
      • By End Use
    • Key Takeaways
  14. Eastern Europe Market Analysis 2020 to 2024 and Forecast 2025 to 2035, By Country
    • Historical Market Size Value (USD Million) & Volume (Units) Trend Analysis By Market Taxonomy, 2020 to 2024
    • Market Size Value (USD Million) & Volume (Units) Forecast By Market Taxonomy, 2025 to 2035
      • By Country
        • Russia
        • Hungary
        • Poland
        • Balkan & Baltics
        • Rest of E. Europe
      • By Type
      • By Transmission Type
      • By Application
      • By End Use
    • Market Attractiveness Analysis
      • By Country
      • By Type
      • By Transmission Type
      • By Application
      • By End Use
    • Key Takeaways
  15. East Asia Market Analysis 2020 to 2024 and Forecast 2025 to 2035, By Country
    • Historical Market Size Value (USD Million) & Volume (Units) Trend Analysis By Market Taxonomy, 2020 to 2024
    • Market Size Value (USD Million) & Volume (Units) Forecast By Market Taxonomy, 2025 to 2035
      • By Country
        • China
        • Japan
        • South Korea
      • By Type
      • By Transmission Type
      • By Application
      • By End Use
    • Market Attractiveness Analysis
      • By Country
      • By Type
      • By Transmission Type
      • By Application
      • By End Use
    • Key Takeaways
  16. South Asia & Pacific Market Analysis 2020 to 2024 and Forecast 2025 to 2035, By Country
    • Historical Market Size Value (USD Million) & Volume (Units) Trend Analysis By Market Taxonomy, 2020 to 2024
    • Market Size Value (USD Million) & Volume (Units) Forecast By Market Taxonomy, 2025 to 2035
      • By Country
        • India
        • Australia & New Zealand
        • ASEAN
        • Rest of SAP
      • By Type
      • By Transmission Type
      • By Application
      • By End Use
    • Market Attractiveness Analysis
      • By Country
      • By Type
      • By Transmission Type
      • By Application
      • By End Use
    • Key Takeaways
  17. Middle East and Africa Market Analysis 2020 to 2024 and Forecast 2025 to 2035, By Country
    • Historical Market Size Value (USD Million) & Volume (Units) Trend Analysis By Market Taxonomy, 2020 to 2024
    • Market Size Value (USD Million) & Volume (Units) Forecast By Market Taxonomy, 2025 to 2035
      • By Country
        • GCC Countries
        • Northern Africa
        • South Africa
        • Turkiye
        • Rest of MEA
      • By Type
      • By Transmission Type
      • By Application
      • By End Use
    • Market Attractiveness Analysis
      • By Country
      • By Type
      • By Transmission Type
      • By Application
      • By End Use
    • Key Takeaways
  18. Key Countries Market Analysis
    • USA
      • Pricing Analysis
      • Market Share Analysis, 2024
        • By Type
        • By Transmission Type
        • By Application
        • By End Use
    • Canada
      • Pricing Analysis
      • Market Share Analysis, 2024
        • By Type
        • By Transmission Type
        • By Application
        • By End Use
    • Brazil
      • Pricing Analysis
      • Market Share Analysis, 2024
        • By Type
        • By Transmission Type
        • By Application
        • By End Use
    • Mexico
      • Pricing Analysis
      • Market Share Analysis, 2024
        • By Type
        • By Transmission Type
        • By Application
        • By End Use
    • Argentina
      • Pricing Analysis
      • Market Share Analysis, 2024
        • By Type
        • By Transmission Type
        • By Application
        • By End Use
  19. Market Structure Analysis
    • Competition Dashboard
    • Competition Benchmarking
    • Market Share Analysis of Top Players
      • By Regional
      • By Type
      • By Transmission Type
      • By Application
      • By End Use
  20. Competition Analysis
    • Competition Deep Dive
      • Renishaw plc.
        • Overview
        • Product Portfolio
        • Profitability by Market Segments (Product/Age /Sales Channel/Region)
        • Sales Footprint
        • Strategy Overview
          • Marketing Strategy
          • Product Strategy
          • Channel Strategy
      • Hexagon AB
        • Overview
        • Product Portfolio
        • Profitability by Market Segments (Product/Age /Sales Channel/Region)
        • Sales Footprint
        • Strategy Overview
          • Marketing Strategy
          • Product Strategy
          • Channel Strategy
      • Blum-Novotest GmbH
        • Overview
        • Product Portfolio
        • Profitability by Market Segments (Product/Age /Sales Channel/Region)
        • Sales Footprint
        • Strategy Overview
          • Marketing Strategy
          • Product Strategy
          • Channel Strategy
      • Marposs S.p.A.
        • Overview
        • Product Portfolio
        • Profitability by Market Segments (Product/Age /Sales Channel/Region)
        • Sales Footprint
        • Strategy Overview
          • Marketing Strategy
          • Product Strategy
          • Channel Strategy
      • Heidenhain GmbH
        • Overview
        • Product Portfolio
        • Profitability by Market Segments (Product/Age /Sales Channel/Region)
        • Sales Footprint
        • Strategy Overview
          • Marketing Strategy
          • Product Strategy
          • Channel Strategy
      • OMRON Corporation
        • Overview
        • Product Portfolio
        • Profitability by Market Segments (Product/Age /Sales Channel/Region)
        • Sales Footprint
        • Strategy Overview
          • Marketing Strategy
          • Product Strategy
          • Channel Strategy
      • Metrol Co., Ltd.
        • Overview
        • Product Portfolio
        • Profitability by Market Segments (Product/Age /Sales Channel/Region)
        • Sales Footprint
        • Strategy Overview
          • Marketing Strategy
          • Product Strategy
          • Channel Strategy
      • HAIMER GmbH
        • Overview
        • Product Portfolio
        • Profitability by Market Segments (Product/Age /Sales Channel/Region)
        • Sales Footprint
        • Strategy Overview
          • Marketing Strategy
          • Product Strategy
          • Channel Strategy
      • Tormach Inc.
        • Overview
        • Product Portfolio
        • Profitability by Market Segments (Product/Age /Sales Channel/Region)
        • Sales Footprint
        • Strategy Overview
          • Marketing Strategy
          • Product Strategy
          • Channel Strategy
      • Midaco Corporation
        • Overview
        • Product Portfolio
        • Profitability by Market Segments (Product/Age /Sales Channel/Region)
        • Sales Footprint
        • Strategy Overview
          • Marketing Strategy
          • Product Strategy
          • Channel Strategy
  21. Assumptions & Acronyms Used
  22. Research Methodology

List of Tables

  • Table 1: Global Market Value (USD Million) Forecast by Region, 2020-2035
  • Table 2: Global Market Volume (Units) Forecast by Region, 2020-2035
  • Table 3: Global Market Value (USD Million) Forecast by Type, 2020-2035
  • Table 4: Global Market Volume (Units) Forecast by Type, 2020-2035
  • Table 5: Global Market Value (USD Million) Forecast by Transmission Type, 2020-2035
  • Table 6: Global Market Volume (Units) Forecast by Transmission Type, 2020-2035
  • Table 7: Global Market Value (USD Million) Forecast by Application, 2020-2035
  • Table 8: Global Market Volume (Units) Forecast by Application, 2020-2035
  • Table 9: Global Market Value (USD Million) Forecast by End Use, 2020-2035
  • Table 10: Global Market Volume (Units) Forecast by End Use, 2020-2035
  • Table 11: North America Market Value (USD Million) Forecast by Country, 2020-2035
  • Table 12: North America Market Volume (Units) Forecast by Country, 2020-2035
  • Table 13: North America Market Value (USD Million) Forecast by Type, 2020-2035
  • Table 14: North America Market Volume (Units) Forecast by Type, 2020-2035
  • Table 15: North America Market Value (USD Million) Forecast by Transmission Type, 2020-2035
  • Table 16: North America Market Volume (Units) Forecast by Transmission Type, 2020-2035
  • Table 17: North America Market Value (USD Million) Forecast by Application, 2020-2035
  • Table 18: North America Market Volume (Units) Forecast by Application, 2020-2035
  • Table 19: North America Market Value (USD Million) Forecast by End Use, 2020-2035
  • Table 20: North America Market Volume (Units) Forecast by End Use, 2020-2035
  • Table 21: Latin America Market Value (USD Million) Forecast by Country, 2020-2035
  • Table 22: Latin America Market Volume (Units) Forecast by Country, 2020-2035
  • Table 23: Latin America Market Value (USD Million) Forecast by Type, 2020-2035
  • Table 24: Latin America Market Volume (Units) Forecast by Type, 2020-2035
  • Table 25: Latin America Market Value (USD Million) Forecast by Transmission Type, 2020-2035
  • Table 26: Latin America Market Volume (Units) Forecast by Transmission Type, 2020-2035
  • Table 27: Latin America Market Value (USD Million) Forecast by Application, 2020-2035
  • Table 28: Latin America Market Volume (Units) Forecast by Application, 2020-2035
  • Table 29: Latin America Market Value (USD Million) Forecast by End Use, 2020-2035
  • Table 30: Latin America Market Volume (Units) Forecast by End Use, 2020-2035
  • Table 31: Western Europe Market Value (USD Million) Forecast by Country, 2020-2035
  • Table 32: Western Europe Market Volume (Units) Forecast by Country, 2020-2035
  • Table 33: Western Europe Market Value (USD Million) Forecast by Type, 2020-2035
  • Table 34: Western Europe Market Volume (Units) Forecast by Type, 2020-2035
  • Table 35: Western Europe Market Value (USD Million) Forecast by Transmission Type, 2020-2035
  • Table 36: Western Europe Market Volume (Units) Forecast by Transmission Type, 2020-2035
  • Table 37: Western Europe Market Value (USD Million) Forecast by Application, 2020-2035
  • Table 38: Western Europe Market Volume (Units) Forecast by Application, 2020-2035
  • Table 39: Western Europe Market Value (USD Million) Forecast by End Use, 2020-2035
  • Table 40: Western Europe Market Volume (Units) Forecast by End Use, 2020-2035
  • Table 41: Eastern Europe Market Value (USD Million) Forecast by Country, 2020-2035
  • Table 42: Eastern Europe Market Volume (Units) Forecast by Country, 2020-2035
  • Table 43: Eastern Europe Market Value (USD Million) Forecast by Type, 2020-2035
  • Table 44: Eastern Europe Market Volume (Units) Forecast by Type, 2020-2035
  • Table 45: Eastern Europe Market Value (USD Million) Forecast by Transmission Type, 2020-2035
  • Table 46: Eastern Europe Market Volume (Units) Forecast by Transmission Type, 2020-2035
  • Table 47: Eastern Europe Market Value (USD Million) Forecast by Application, 2020-2035
  • Table 48: Eastern Europe Market Volume (Units) Forecast by Application, 2020-2035
  • Table 49: Eastern Europe Market Value (USD Million) Forecast by End Use, 2020-2035
  • Table 50: Eastern Europe Market Volume (Units) Forecast by End Use, 2020-2035
  • Table 51: East Asia Market Value (USD Million) Forecast by Country, 2020-2035
  • Table 52: East Asia Market Volume (Units) Forecast by Country, 2020-2035
  • Table 53: East Asia Market Value (USD Million) Forecast by Type, 2020-2035
  • Table 54: East Asia Market Volume (Units) Forecast by Type, 2020-2035
  • Table 55: East Asia Market Value (USD Million) Forecast by Transmission Type, 2020-2035
  • Table 56: East Asia Market Volume (Units) Forecast by Transmission Type, 2020-2035
  • Table 57: East Asia Market Value (USD Million) Forecast by Application, 2020-2035
  • Table 58: East Asia Market Volume (Units) Forecast by Application, 2020-2035
  • Table 59: East Asia Market Value (USD Million) Forecast by End Use, 2020-2035
  • Table 60: East Asia Market Volume (Units) Forecast by End Use, 2020-2035
  • Table 61: South Asia & Pacific Market Value (USD Million) Forecast by Country, 2020-2035
  • Table 62: South Asia & Pacific Market Volume (Units) Forecast by Country, 2020-2035
  • Table 63: South Asia & Pacific Market Value (USD Million) Forecast by Type, 2020-2035
  • Table 64: South Asia & Pacific Market Volume (Units) Forecast by Type, 2020-2035
  • Table 65: South Asia & Pacific Market Value (USD Million) Forecast by Transmission Type, 2020-2035
  • Table 66: South Asia & Pacific Market Volume (Units) Forecast by Transmission Type, 2020-2035
  • Table 67: South Asia & Pacific Market Value (USD Million) Forecast by Application, 2020-2035
  • Table 68: South Asia & Pacific Market Volume (Units) Forecast by Application, 2020-2035
  • Table 69: South Asia & Pacific Market Value (USD Million) Forecast by End Use, 2020-2035
  • Table 70: South Asia & Pacific Market Volume (Units) Forecast by End Use, 2020-2035
  • Table 71: Middle East and Africa Market Value (USD Million) Forecast by Country, 2020-2035
  • Table 72: Middle East and Africa Market Volume (Units) Forecast by Country, 2020-2035
  • Table 73: Middle East and Africa Market Value (USD Million) Forecast by Type, 2020-2035
  • Table 74: Middle East and Africa Market Volume (Units) Forecast by Type, 2020-2035
  • Table 75: Middle East and Africa Market Value (USD Million) Forecast by Transmission Type, 2020-2035
  • Table 76: Middle East and Africa Market Volume (Units) Forecast by Transmission Type, 2020-2035
  • Table 77: Middle East and Africa Market Value (USD Million) Forecast by Application, 2020-2035
  • Table 78: Middle East and Africa Market Volume (Units) Forecast by Application, 2020-2035
  • Table 79: Middle East and Africa Market Value (USD Million) Forecast by End Use, 2020-2035
  • Table 80: Middle East and Africa Market Volume (Units) Forecast by End Use, 2020-2035

List of Figures

  • Figure 1: Global Market Volume (Units) Forecast 2020-2035
  • Figure 2: Global Market Pricing Analysis
  • Figure 3: Global Market Value (USD Million) Forecast 2020-2035
  • Figure 4: Global Market Value Share and BPS Analysis by Type, 2025 and 2035
  • Figure 5: Global Market Y-o-Y Growth Comparison by Type, 2025-2035
  • Figure 6: Global Market Attractiveness Analysis by Type
  • Figure 7: Global Market Value Share and BPS Analysis by Transmission Type, 2025 and 2035
  • Figure 8: Global Market Y-o-Y Growth Comparison by Transmission Type, 2025-2035
  • Figure 9: Global Market Attractiveness Analysis by Transmission Type
  • Figure 10: Global Market Value Share and BPS Analysis by Application, 2025 and 2035
  • Figure 11: Global Market Y-o-Y Growth Comparison by Application, 2025-2035
  • Figure 12: Global Market Attractiveness Analysis by Application
  • Figure 13: Global Market Value Share and BPS Analysis by End Use, 2025 and 2035
  • Figure 14: Global Market Y-o-Y Growth Comparison by End Use, 2025-2035
  • Figure 15: Global Market Attractiveness Analysis by End Use
  • Figure 16: Global Market Value (USD Million) Share and BPS Analysis by Region, 2025 and 2035
  • Figure 17: Global Market Y-o-Y Growth Comparison by Region, 2025-2035
  • Figure 18: Global Market Attractiveness Analysis by Region
  • Figure 19: North America Market Incremental USD Opportunity, 2025-2035
  • Figure 20: Latin America Market Incremental USD Opportunity, 2025-2035
  • Figure 21: Western Europe Market Incremental USD Opportunity, 2025-2035
  • Figure 22: Eastern Europe Market Incremental USD Opportunity, 2025-2035
  • Figure 23: East Asia Market Incremental USD Opportunity, 2025-2035
  • Figure 24: South Asia & Pacific Market Incremental USD Opportunity, 2025-2035
  • Figure 25: Middle East and Africa Market Incremental USD Opportunity, 2025-2035
  • Figure 26: North America Market Value Share and BPS Analysis by Country, 2025 and 2035
  • Figure 27: North America Market Value Share and BPS Analysis by Type, 2025 and 2035
  • Figure 28: North America Market Y-o-Y Growth Comparison by Type, 2025-2035
  • Figure 29: North America Market Attractiveness Analysis by Type
  • Figure 30: North America Market Value Share and BPS Analysis by Transmission Type, 2025 and 2035
  • Figure 31: North America Market Y-o-Y Growth Comparison by Transmission Type, 2025-2035
  • Figure 32: North America Market Attractiveness Analysis by Transmission Type
  • Figure 33: North America Market Value Share and BPS Analysis by Application, 2025 and 2035
  • Figure 34: North America Market Y-o-Y Growth Comparison by Application, 2025-2035
  • Figure 35: North America Market Attractiveness Analysis by Application
  • Figure 36: North America Market Value Share and BPS Analysis by End Use, 2025 and 2035
  • Figure 37: North America Market Y-o-Y Growth Comparison by End Use, 2025-2035
  • Figure 38: North America Market Attractiveness Analysis by End Use
  • Figure 39: Latin America Market Value Share and BPS Analysis by Country, 2025 and 2035
  • Figure 40: Latin America Market Value Share and BPS Analysis by Type, 2025 and 2035
  • Figure 41: Latin America Market Y-o-Y Growth Comparison by Type, 2025-2035
  • Figure 42: Latin America Market Attractiveness Analysis by Type
  • Figure 43: Latin America Market Value Share and BPS Analysis by Transmission Type, 2025 and 2035
  • Figure 44: Latin America Market Y-o-Y Growth Comparison by Transmission Type, 2025-2035
  • Figure 45: Latin America Market Attractiveness Analysis by Transmission Type
  • Figure 46: Latin America Market Value Share and BPS Analysis by Application, 2025 and 2035
  • Figure 47: Latin America Market Y-o-Y Growth Comparison by Application, 2025-2035
  • Figure 48: Latin America Market Attractiveness Analysis by Application
  • Figure 49: Latin America Market Value Share and BPS Analysis by End Use, 2025 and 2035
  • Figure 50: Latin America Market Y-o-Y Growth Comparison by End Use, 2025-2035
  • Figure 51: Latin America Market Attractiveness Analysis by End Use
  • Figure 52: Western Europe Market Value Share and BPS Analysis by Country, 2025 and 2035
  • Figure 53: Western Europe Market Value Share and BPS Analysis by Type, 2025 and 2035
  • Figure 54: Western Europe Market Y-o-Y Growth Comparison by Type, 2025-2035
  • Figure 55: Western Europe Market Attractiveness Analysis by Type
  • Figure 56: Western Europe Market Value Share and BPS Analysis by Transmission Type, 2025 and 2035
  • Figure 57: Western Europe Market Y-o-Y Growth Comparison by Transmission Type, 2025-2035
  • Figure 58: Western Europe Market Attractiveness Analysis by Transmission Type
  • Figure 59: Western Europe Market Value Share and BPS Analysis by Application, 2025 and 2035
  • Figure 60: Western Europe Market Y-o-Y Growth Comparison by Application, 2025-2035
  • Figure 61: Western Europe Market Attractiveness Analysis by Application
  • Figure 62: Western Europe Market Value Share and BPS Analysis by End Use, 2025 and 2035
  • Figure 63: Western Europe Market Y-o-Y Growth Comparison by End Use, 2025-2035
  • Figure 64: Western Europe Market Attractiveness Analysis by End Use
  • Figure 65: Eastern Europe Market Value Share and BPS Analysis by Country, 2025 and 2035
  • Figure 66: Eastern Europe Market Value Share and BPS Analysis by Type, 2025 and 2035
  • Figure 67: Eastern Europe Market Y-o-Y Growth Comparison by Type, 2025-2035
  • Figure 68: Eastern Europe Market Attractiveness Analysis by Type
  • Figure 69: Eastern Europe Market Value Share and BPS Analysis by Transmission Type, 2025 and 2035
  • Figure 70: Eastern Europe Market Y-o-Y Growth Comparison by Transmission Type, 2025-2035
  • Figure 71: Eastern Europe Market Attractiveness Analysis by Transmission Type
  • Figure 72: Eastern Europe Market Value Share and BPS Analysis by Application, 2025 and 2035
  • Figure 73: Eastern Europe Market Y-o-Y Growth Comparison by Application, 2025-2035
  • Figure 74: Eastern Europe Market Attractiveness Analysis by Application
  • Figure 75: Eastern Europe Market Value Share and BPS Analysis by End Use, 2025 and 2035
  • Figure 76: Eastern Europe Market Y-o-Y Growth Comparison by End Use, 2025-2035
  • Figure 77: Eastern Europe Market Attractiveness Analysis by End Use
  • Figure 78: East Asia Market Value Share and BPS Analysis by Country, 2025 and 2035
  • Figure 79: East Asia Market Value Share and BPS Analysis by Type, 2025 and 2035
  • Figure 80: East Asia Market Y-o-Y Growth Comparison by Type, 2025-2035
  • Figure 81: East Asia Market Attractiveness Analysis by Type
  • Figure 82: East Asia Market Value Share and BPS Analysis by Transmission Type, 2025 and 2035
  • Figure 83: East Asia Market Y-o-Y Growth Comparison by Transmission Type, 2025-2035
  • Figure 84: East Asia Market Attractiveness Analysis by Transmission Type
  • Figure 85: East Asia Market Value Share and BPS Analysis by Application, 2025 and 2035
  • Figure 86: East Asia Market Y-o-Y Growth Comparison by Application, 2025-2035
  • Figure 87: East Asia Market Attractiveness Analysis by Application
  • Figure 88: East Asia Market Value Share and BPS Analysis by End Use, 2025 and 2035
  • Figure 89: East Asia Market Y-o-Y Growth Comparison by End Use, 2025-2035
  • Figure 90: East Asia Market Attractiveness Analysis by End Use
  • Figure 91: South Asia & Pacific Market Value Share and BPS Analysis by Country, 2025 and 2035
  • Figure 92: South Asia & Pacific Market Value Share and BPS Analysis by Type, 2025 and 2035
  • Figure 93: South Asia & Pacific Market Y-o-Y Growth Comparison by Type, 2025-2035
  • Figure 94: South Asia & Pacific Market Attractiveness Analysis by Type
  • Figure 95: South Asia & Pacific Market Value Share and BPS Analysis by Transmission Type, 2025 and 2035
  • Figure 96: South Asia & Pacific Market Y-o-Y Growth Comparison by Transmission Type, 2025-2035
  • Figure 97: South Asia & Pacific Market Attractiveness Analysis by Transmission Type
  • Figure 98: South Asia & Pacific Market Value Share and BPS Analysis by Application, 2025 and 2035
  • Figure 99: South Asia & Pacific Market Y-o-Y Growth Comparison by Application, 2025-2035
  • Figure 100: South Asia & Pacific Market Attractiveness Analysis by Application
  • Figure 101: South Asia & Pacific Market Value Share and BPS Analysis by End Use, 2025 and 2035
  • Figure 102: South Asia & Pacific Market Y-o-Y Growth Comparison by End Use, 2025-2035
  • Figure 103: South Asia & Pacific Market Attractiveness Analysis by End Use
  • Figure 104: Middle East and Africa Market Value Share and BPS Analysis by Country, 2025 and 2035
  • Figure 105: Middle East and Africa Market Value Share and BPS Analysis by Type, 2025 and 2035
  • Figure 106: Middle East and Africa Market Y-o-Y Growth Comparison by Type, 2025-2035
  • Figure 107: Middle East and Africa Market Attractiveness Analysis by Type
  • Figure 108: Middle East and Africa Market Value Share and BPS Analysis by Transmission Type, 2025 and 2035
  • Figure 109: Middle East and Africa Market Y-o-Y Growth Comparison by Transmission Type, 2025-2035
  • Figure 110: Middle East and Africa Market Attractiveness Analysis by Transmission Type
  • Figure 111: Middle East and Africa Market Value Share and BPS Analysis by Application, 2025 and 2035
  • Figure 112: Middle East and Africa Market Y-o-Y Growth Comparison by Application, 2025-2035
  • Figure 113: Middle East and Africa Market Attractiveness Analysis by Application
  • Figure 114: Middle East and Africa Market Value Share and BPS Analysis by End Use, 2025 and 2035
  • Figure 115: Middle East and Africa Market Y-o-Y Growth Comparison by End Use, 2025-2035
  • Figure 116: Middle East and Africa Market Attractiveness Analysis by End Use
  • Figure 117: Global Market - Tier Structure Analysis
  • Figure 118: Global Market - Company Share Analysis

Frequently Asked Questions

What is the projected size of the machine tool touch probe market in 2025?

The machine tool touch probe market is valued at USD 682.7 million in 2025.

What is the outlook on machine tool touch probe demand by 2035?

The market is forecasted to reach USD 963.0 million by 2035, reflecting a CAGR of 3.5%.

Which product type leads the machine tool touch probe market in 2025?

3D touch probes are expected to lead the market, accounting for a 35% share in 2025.

What is the projected share of wireless probes in the transmission type segment by 2035?

Wireless probes are expected to hold 53% of the market share by 2035.

Which country is projected to have the fastest-growing machine tool touch probe market?

The USA is anticipated to be the fastest-growing market with a CAGR of 3.6% from 2025 to 2035.

Explore Responsible Resource Management & Safety Insights

Future Market Insights

Machine Tool Touch Probe Market