Machine Condition Monitoring Market Forecast and Outlook from 2025 to 2035

The machine condition monitoring market is advancing steadily, driven by the increasing adoption of predictive maintenance strategies across manufacturing and industrial sectors. Reports from engineering journals and automation system manufacturers have pointed to a significant shift from reactive to data-driven maintenance, with real-time monitoring technologies playing a central role.

Industries such as oil & gas, power generation, and automotive manufacturing are integrating advanced condition monitoring systems to minimize downtime, enhance asset life, and reduce maintenance costs. The rising complexity of modern machinery has also necessitated continuous health diagnostics, supported by sensors, data loggers, and software analytics.

Moreover, the growing reliance on Industrial Internet of Things (IIoT) and cloud-based platforms has enabled seamless monitoring, data visualization, and automated alerts for potential failures. Looking forward, market growth is expected to be influenced by the development of wireless monitoring solutions, integration of AI for predictive analytics, and increasing deployment of machine condition monitoring systems across small and medium enterprises. Segmental growth is being led by vibration monitoring techniques, hardware components, and online monitoring processes, each driven by their unique application strengths and technological maturity.
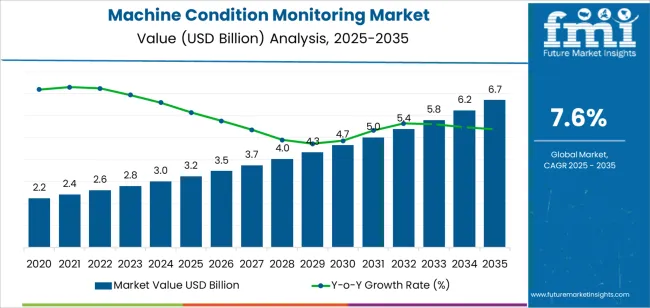
Quick Stats for Machine Condition Monitoring Market

  • Machine Condition Monitoring Market Industry Value (2025): USD 3.2 billion
  • Machine Condition Monitoring Market Forecast Value (2035): USD 6.7 billion
  • Machine Condition Monitoring Market Forecast CAGR: 7.6%
  • Leading Segment in Machine Condition Monitoring Market in 2025: Vibrating Monitoring (34.2%)
  • Key Growth Region in Machine Condition Monitoring Market: North America, Asia-Pacific, Europe
  • Top Key Players in Machine Condition Monitoring Market: Emerson Electric, General Electric, SKF, Honeywell International, Schaeffler AG, Rockwell Automation Inc., National Instruments Corporation, Parker Hannifin Corporation, Dewesoft, Advanced Technology Services, Inc., Crystal Instruments, Baker Hughes Company, Fluke Corporation

Machine Condition Monitoring Market Market Value Analysis

Metric Value
Machine Condition Monitoring Market Estimated Value in (2025 E) USD 3.2 billion
Machine Condition Monitoring Market Forecast Value in (2035 F) USD 6.7 billion
Forecast CAGR (2025 to 2035) 7.6%

Segmental Analysis

The market is segmented by Monitoring Techniques, Component, Monitoring Process, Deployment Type, and Industry and region. By Monitoring Techniques, the market is divided into Vibrating Monitoring, Thermography, Oil Analysis, Corrosion Monitoring, Motor Current Analysis, and Ultrasound Emission Monitoring. In terms of Component, the market is classified into Hardware and Software. Based on Monitoring Process, the market is segmented into Online and Portable. By Deployment Type, the market is divided into On‑Premises and Cloud. By Industry, the market is segmented into Oil And Gas, Power Generation, Automotive, Chemical, Aerospace, Food And Beverage, Metal And Mining, and Others. Regionally, the market is classified into North America, Latin America, Western Europe, Eastern Europe, Balkan & Baltic Countries, Russia & Belarus, Central Asia, East Asia, South Asia & Pacific, and the Middle East & Africa.
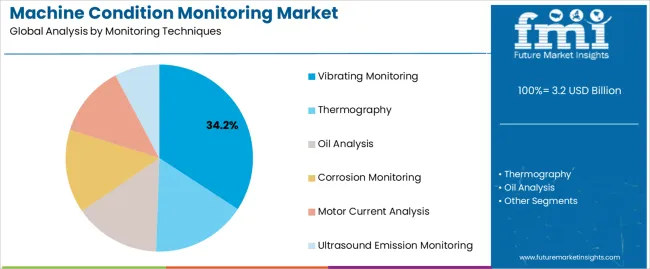
Insights into the Monitoring Techniques Segment: Vibration Monitoring

Machine Condition Monitoring Market Analysis By Monitoring Techniques

The Vibration Monitoring segment is projected to hold 34.20% of the machine condition monitoring market revenue in 2025, leading the monitoring techniques category. This growth has been driven by the technique’s proven reliability in detecting early-stage faults such as misalignment, imbalance, and bearing wear.

Engineering publications and maintenance audits have consistently cited vibration analysis as the most cost-effective and widely implemented technique across rotating machinery. Its ability to detect anomalies before they escalate into critical failures has made it indispensable in sectors like manufacturing, power generation, and mining.

The availability of portable vibration analyzers and integrated sensors has facilitated easy deployment across legacy and modern systems. Moreover, recent advancements in wireless sensor networks and real-time data interpretation have further increased its effectiveness and adoption. With increased awareness of equipment lifecycle optimization and unplanned downtime reduction, the Vibration Monitoring segment is expected to maintain its position as the foundational technique in condition monitoring programs.
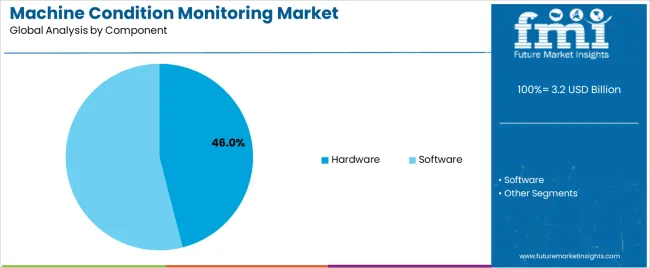
Insights into the Component Segment: Hardware

Machine Condition Monitoring Market Analysis By Component

The Hardware segment is projected to contribute 46.0% of the machine condition monitoring market revenue in 2025, securing its lead among component types. This dominance has been attributed to the essential role of physical infrastructure such as sensors, transducers, data acquisition systems, and portable diagnostic equipment in facilitating accurate and real-time condition monitoring.

Industry suppliers and automation solution providers have reported sustained demand for robust, durable hardware capable of operating in harsh industrial environments. Hardware components form the core of monitoring systems, converting mechanical signals into digital data streams for interpretation.

The integration of modular hardware with existing plant equipment has also enabled cost-effective scaling of condition monitoring capabilities. Furthermore, advancements in MEMS sensor technology and edge computing devices have enhanced hardware functionality, allowing for faster data capture and analysis. As industrial sectors prioritize system reliability and predictive diagnostics, the Hardware segment is expected to remain the largest revenue contributor in the condition monitoring ecosystem.
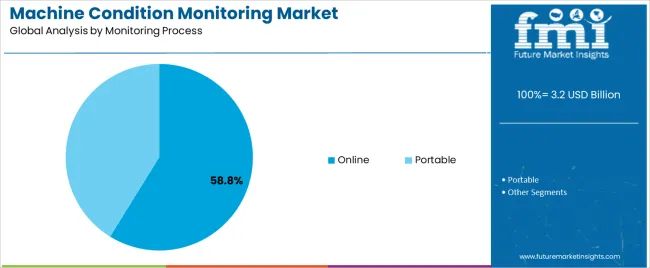
Insights into the Monitoring Process Segment: Online

Machine Condition Monitoring Market Analysis By Monitoring Process

The Online segment is projected to account for 58.8% of the machine condition monitoring market revenue in 2025, establishing itself as the dominant monitoring process. This segment’s growth has been driven by the increasing demand for continuous equipment surveillance in mission-critical environments where downtime is highly disruptive.

Online monitoring enables real-time data collection and immediate fault detection, supporting predictive maintenance and enhancing operational safety. Industries such as energy, petrochemicals, and transportation have prioritized online systems to ensure uninterrupted performance of high-value machinery.

Technological advancements in cloud connectivity, wireless sensors, and remote monitoring platforms have significantly improved the accessibility and scalability of online monitoring systems. These systems also support integration with AI-powered analytics tools, enabling early anomaly detection and maintenance scheduling. With operational efficiency and equipment reliability being key metrics for industrial success, the Online segment is expected to remain the preferred monitoring process, offering superior insight, responsiveness, and long-term cost savings.

Comprehensive Analysis of the Machine Condition Monitoring Industry

Innovations in Sensor Technology and Predictive Maintenance Fuel Demand

Continuous innovations in sensor technology, data analytics, and artificial intelligence drive the development of more sophisticated and effective condition monitoring solutions.

Industries increasingly adopt predictive maintenance strategies to minimize downtime, optimize operational efficiency, and reduce maintenance costs, thereby boosting the demand for condition monitoring systems.

Stringent regulatory requirements regarding equipment safety, environmental sustainability, and worker safety compel companies to invest in condition monitoring solutions to ensure compliance and avoid penalties.

Risk of Data Theft and Technical Challenges to Hamper Demand

The initial cost of implementing condition monitoring systems, including sensors, software, and infrastructure, can be prohibitive for some organizations, particularly small-scale businesses with limited budgets.

Integrating condition monitoring systems with existing infrastructure and legacy equipment may pose technical challenges and require additional investments in training and system integration. The collection and analysis of sensitive equipment data raise concerns about data privacy and security, particularly in industries where proprietary information is at risk of theft or unauthorized access.

Integration of Machine Learning to Create Novel Opportunities

Ongoing expansion of industries such as renewable energy, aerospace, and automotive presents new opportunities for condition monitoring solution providers, as these sectors require reliable monitoring of critical assets to ensure operational efficiency and safety.

The proliferation of Internet of Things (IoT) devices and connectivity enables real-time monitoring of equipment health, opening up opportunities for predictive maintenance and proactive interventions to prevent costly downtime.

The integration of machine learning algorithms and predictive analytics into condition monitoring platforms enhances the accuracy and timeliness of fault detection and enables proactive maintenance strategies, offering new avenues for innovation and differentiation.

Margin Erosion and Price Wars Might Impede the Industry

The machine condition monitoring market is highly competitive, with numerous players offering a wide range of solutions. Intense competition may lead to price wars, margin erosion, and commoditization of products and services.

Rapid technological advancements and disruptive innovations could render existing condition monitoring solutions obsolete, forcing companies to continuously invest in research and development to stay ahead of the curve.

Strict regulations governing data privacy and protection, such as the General Data Protection Regulation (GDPR), could impose compliance challenges and increase operating costs for condition monitoring solution providers.

Analysis of Top Countries, Producing, Using, and Distributing Machine Condition Monitoring Market

Country-wise insights offer a glimpse into how leading countries are shaping the machine condition monitoring market, each with its unique strengths, challenges, and opportunities.

Emphasis on Operational Efficiency to Propel the United States

The United States boasts one of the most significant machine condition monitoring markets globally, driven by its extensive industrial base across various sectors such as manufacturing, energy, aerospace, and automotive.

The country is a hub for technological innovations, with numerous companies and research institutions pioneering advancements in sensor technology, data analytics, and artificial intelligence for condition monitoring applications.

Stringent regulatory requirements regarding equipment safety, environmental compliance, and worker safety incentivize industries in the United States to invest in condition monitoring solutions to ensure compliance and mitigate operational risks.

Key drivers of market growth in the country include increasing adoption of predictive maintenance strategies, emphasis on operational efficiency and asset reliability, and the need to minimize downtime and maintenance costs.

Germany Embraces a Collaborative Ecosystem to Augment Growth

Germany is renowned for its engineering prowess and manufacturing expertise, making it a significant player in the global machine condition monitoring market. Companies in the country lead the way in developing high-quality monitoring solutions for various industries.

The country's emphasis on industrial automation and Industry 4.0 initiatives pushes the adoption of advanced condition monitoring technologies as manufacturers seek to optimize production processes and maintain competitive advantage.

Germany benefits from a collaborative ecosystem comprising industry associations, research institutions, and government agencies, fostering innovation and knowledge exchange in the field of condition monitoring.

Condition monitoring solution providers in the country capitalize on export opportunities, leveraging Germany’s strong reputation for reliability and quality to serve international markets across Europe, Asia, and beyond.

China Focuses on Operational Efficiency and Optimization of Value Chain

China's status as a global manufacturing powerhouse fuels the demand for machine condition monitoring solutions as companies prioritize operational efficiency, quality control, and asset reliability to remain competitive in domestic and international markets.

Government initiatives such as Made in China 2025 and the Belt and Road Initiative boost investments in advanced manufacturing technologies, including condition monitoring, as China seeks to upgrade its industrial infrastructure and move up the value chain.

Rapid urbanization and industrialization in China have led to increased demand for condition monitoring solutions in sectors such as infrastructure, construction, energy, and transportation as companies strive to ensure the reliability and safety of critical assets.

China-based companies are increasingly investing in research and development to develop indigenous condition monitoring technologies tailored to the needs of domestic industries, presenting opportunities for homegrown solutions to gain market share domestically and globally.

Machine Condition Monitoring Market Analyzed by Top Industry Segments

Thermography Technique to be Highly Preferred by Consumers

Thermography is set to be particularly useful for detecting faults in electrical systems, motors, and process equipment. It is projected to be widely used in industries such as power generation, manufacturing, and utilities.

Thermography solutions represent a significant portion of the machine condition monitoring market, driven by the growing adoption of infrared technology for predictive maintenance applications.

Demand for Online Condition Monitoring to Rise Exponentially

Online condition monitoring has the ability to provide real-time visibility into equipment health, enabling operators and maintenance personnel to identify anomalies and abnormalities as they occur.

By leveraging sensors, data acquisition systems, and connectivity technologies, online monitoring solutions continuously collect and analyze data from machinery, detecting deviations from normal operating conditions and triggering alarms or notifications when issues are detected.

Online condition monitoring also facilitates predictive maintenance strategies and can forecast potential equipment failures and recommend appropriate maintenance actions by analyzing historical data and trends and predictive algorithms.

It is set to be a critical enabler of predictive maintenance and asset management strategies, offering real-time visibility, proactive insights, and operational intelligence for organizations across various industries.
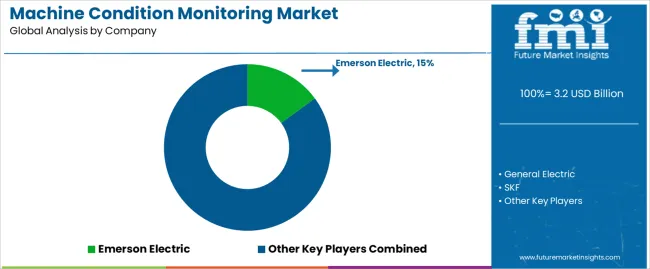
Leading Suppliers of Machine Condition Monitoring Systems

Machine Condition Monitoring Market Analysis By Company

The competitive landscape in the machine condition monitoring market is characterized by intense competition among a diverse range of players, including multinational corporations, small and medium-sized enterprises, and start-ups. These companies offer a wide array of products and services tailored to various industries and applications within the condition monitoring ecosystem.

The machine condition monitoring market is highly competitive, with a mix of established players, specialized providers, start-ups, and technology innovators vying for a high share.

These companies differentiate themselves based on their technological capabilities, industry expertise, and ability to deliver value-added services for predictive maintenance and asset management. As the demand for condition monitoring solutions continues to grow, competition is expected to intensify, driving further innovation and consolidation in the market.

Insights into Key Players

  • Germany-based SKF is a global leader in bearing manufacturing and provides a comprehensive range of products and services. The company's offerings include sophisticated vibration analysis equipment, advanced sensor technology, and comprehensive software solutions for predictive maintenance. SKF's condition monitoring systems are designed to improve operational efficiency, reduce downtime, and extend the life of machinery across various industries, including manufacturing, energy, and aerospace.
  • Emerson Electric Co., based in the United States, is a prominent player in the field of automation solutions, including machine condition monitoring. The company's portfolio features advanced diagnostic and monitoring tools, such as the AMS 6500 ATG system, which combines machinery health monitoring with predictive analytics to prevent equipment failures. Emerson's condition monitoring solutions are widely used in industries like oil and gas, chemical, and power generation, helping clients enhance reliability, safety, and performance through proactive maintenance strategies.

Top Companies in the Machine Condition Monitoring Market

  • General Electric
  • Emerson Electric
  • SKF
  • Honeywell International
  • Schaeffler AG
  • Rockwell Automation Inc.
  • National Instruments Corporation
  • Parker Hannifin Corporation
  • Dewesoft
  • Advanced Technology Services, Inc.
  • Crystal Instruments
  • Baker Hughes Company
  • Fluke Corporation

Machine Condition Monitoring Industry Analysis by Top Investment Segments

By Monitoring Techniques:

Based on monitoring techniques, the machine condition monitoring market is segmented into vibrating monitoring, thermography, oil analysis, corrosion monitoring, motor current analysis, and ultrasound emission monitoring.

By Component:

By component, the sector is divided into hardware and software.

By Monitoring Process:

Based on the monitoring process, the industry is distributed in online and portable condition monitoring.

By Deployment Type:

The machine condition monitoring market is deployed in two parts, namely, on-premises and cloud.

By Industry:

Based on industry, the sector is segregated into power generation, oil and gas, automotive, chemical, aerospace, food and beverage, metal and mining, and others.

By Region:

By region, the machine condition monitoring market is spread across North America, Latin America, Europe, East Asia, South Asia, Pacific, and the Middle East and Africa.

Frequently Asked Questions

How big is the machine condition monitoring market in 2025?

The global machine condition monitoring market is estimated to be valued at USD 3.2 billion in 2025.

What will be the size of machine condition monitoring market in 2035?

The market size for the machine condition monitoring market is projected to reach USD 6.7 billion by 2035.

How much will be the machine condition monitoring market growth between 2025 and 2035?

The machine condition monitoring market is expected to grow at a 7.6% CAGR between 2025 and 2035.

What are the key product types in the machine condition monitoring market?

The key product types in machine condition monitoring market are vibrating monitoring, thermography, oil analysis, corrosion monitoring, motor current analysis and ultrasound emission monitoring.

Which component segment to contribute significant share in the machine condition monitoring market in 2025?

In terms of component, hardware segment to command 46.0% share in the machine condition monitoring market in 2025.

Table of Content

  1. Executive Summary
    • Global Market Outlook
    • Demand to side Trends
    • Supply to side Trends
    • Technology Roadmap Analysis
    • Analysis and Recommendations
  2. Market Overview
    • Market Coverage / Taxonomy
    • Market Definition / Scope / Limitations
  3. Market Background
    • Market Dynamics
      • Drivers
      • Restraints
      • Opportunity
      • Trends
    • Scenario Forecast
      • Demand in Optimistic Scenario
      • Demand in Likely Scenario
      • Demand in Conservative Scenario
    • Opportunity Map Analysis
    • Product Life Cycle Analysis
    • Supply Chain Analysis
    • Investment Feasibility Matrix
    • Value Chain Analysis
    • PESTLE and Porter’s Analysis
    • Regulatory Landscape
    • Regional Parent Market Outlook
    • Production and Consumption Statistics
    • Import and Export Statistics
  4. Global Market Analysis 2020 to 2024 and Forecast, 2025 to 2035
    • Historical Market Size Value (USD Million) Analysis, 2020 to 2024
    • Current and Future Market Size Value (USD Million) Projections, 2025 to 2035
      • Y to o to Y Growth Trend Analysis
      • Absolute $ Opportunity Analysis
  5. Global Market Pricing Analysis 2020 to 2024 and Forecast 2025 to 2035
  6. Global Market Analysis 2020 to 2024 and Forecast 2025 to 2035, By Monitoring Techniques
    • Introduction / Key Findings
    • Historical Market Size Value (USD Million) Analysis By Monitoring Techniques , 2020 to 2024
    • Current and Future Market Size Value (USD Million) Analysis and Forecast By Monitoring Techniques , 2025 to 2035
      • Vibrating Monitoring
      • Thermography
      • Oil Analysis
      • Corrosion Monitoring
      • Motor Current Analysis
      • Ultrasound Emission Monitoring
    • Y to o to Y Growth Trend Analysis By Monitoring Techniques , 2020 to 2024
    • Absolute $ Opportunity Analysis By Monitoring Techniques , 2025 to 2035
  7. Global Market Analysis 2020 to 2024 and Forecast 2025 to 2035, By Component
    • Introduction / Key Findings
    • Historical Market Size Value (USD Million) Analysis By Component, 2020 to 2024
    • Current and Future Market Size Value (USD Million) Analysis and Forecast By Component, 2025 to 2035
      • Hardware
      • Software
    • Y to o to Y Growth Trend Analysis By Component, 2020 to 2024
    • Absolute $ Opportunity Analysis By Component, 2025 to 2035
  8. Global Market Analysis 2020 to 2024 and Forecast 2025 to 2035, By Monitoring Process
    • Introduction / Key Findings
    • Historical Market Size Value (USD Million) Analysis By Monitoring Process, 2020 to 2024
    • Current and Future Market Size Value (USD Million) Analysis and Forecast By Monitoring Process, 2025 to 2035
      • Online
      • Portable
    • Y to o to Y Growth Trend Analysis By Monitoring Process, 2020 to 2024
    • Absolute $ Opportunity Analysis By Monitoring Process, 2025 to 2035
  9. Global Market Analysis 2020 to 2024 and Forecast 2025 to 2035, By Deployment Type
    • Introduction / Key Findings
    • Historical Market Size Value (USD Million) Analysis By Deployment Type, 2020 to 2024
    • Current and Future Market Size Value (USD Million) Analysis and Forecast By Deployment Type, 2025 to 2035
      • On‑Premises
      • Cloud
    • Y to o to Y Growth Trend Analysis By Deployment Type, 2020 to 2024
    • Absolute $ Opportunity Analysis By Deployment Type, 2025 to 2035
  10. Global Market Analysis 2020 to 2024 and Forecast 2025 to 2035, By Industry
    • Introduction / Key Findings
    • Historical Market Size Value (USD Million) Analysis By Industry, 2020 to 2024
    • Current and Future Market Size Value (USD Million) Analysis and Forecast By Industry, 2025 to 2035
      • Oil And Gas
      • Power Generation
      • Automotive
      • Chemical
      • Aerospace
      • Food And Beverage
      • Metal And Mining
      • Others
    • Y to o to Y Growth Trend Analysis By Industry, 2020 to 2024
    • Absolute $ Opportunity Analysis By Industry, 2025 to 2035
  11. Global Market Analysis 2020 to 2024 and Forecast 2025 to 2035, By Region
    • Introduction
    • Historical Market Size Value (USD Million) Analysis By Region, 2020 to 2024
    • Current Market Size Value (USD Million) Analysis and Forecast By Region, 2025 to 2035
      • North America
      • Latin America
      • Western Europe
      • Eastern Europe
      • East Asia
      • South Asia and Pacific
      • Middle East & Africa
    • Market Attractiveness Analysis By Region
  12. North America Market Analysis 2020 to 2024 and Forecast 2025 to 2035, By Country
    • Historical Market Size Value (USD Million) Trend Analysis By Market Taxonomy, 2020 to 2024
    • Market Size Value (USD Million) Forecast By Market Taxonomy, 2025 to 2035
      • By Country
        • USA
        • Canada
        • Mexico
      • By Monitoring Techniques
      • By Component
      • By Monitoring Process
      • By Deployment Type
      • By Industry
    • Market Attractiveness Analysis
      • By Country
      • By Monitoring Techniques
      • By Component
      • By Monitoring Process
      • By Deployment Type
      • By Industry
    • Key Takeaways
  13. Latin America Market Analysis 2020 to 2024 and Forecast 2025 to 2035, By Country
    • Historical Market Size Value (USD Million) Trend Analysis By Market Taxonomy, 2020 to 2024
    • Market Size Value (USD Million) Forecast By Market Taxonomy, 2025 to 2035
      • By Country
        • Brazil
        • Chile
        • Rest of Latin America
      • By Monitoring Techniques
      • By Component
      • By Monitoring Process
      • By Deployment Type
      • By Industry
    • Market Attractiveness Analysis
      • By Country
      • By Monitoring Techniques
      • By Component
      • By Monitoring Process
      • By Deployment Type
      • By Industry
    • Key Takeaways
  14. Western Europe Market Analysis 2020 to 2024 and Forecast 2025 to 2035, By Country
    • Historical Market Size Value (USD Million) Trend Analysis By Market Taxonomy, 2020 to 2024
    • Market Size Value (USD Million) Forecast By Market Taxonomy, 2025 to 2035
      • By Country
        • Germany
        • UK
        • Italy
        • Spain
        • France
        • Nordic
        • BENELUX
        • Rest of Western Europe
      • By Monitoring Techniques
      • By Component
      • By Monitoring Process
      • By Deployment Type
      • By Industry
    • Market Attractiveness Analysis
      • By Country
      • By Monitoring Techniques
      • By Component
      • By Monitoring Process
      • By Deployment Type
      • By Industry
    • Key Takeaways
  15. Eastern Europe Market Analysis 2020 to 2024 and Forecast 2025 to 2035, By Country
    • Historical Market Size Value (USD Million) Trend Analysis By Market Taxonomy, 2020 to 2024
    • Market Size Value (USD Million) Forecast By Market Taxonomy, 2025 to 2035
      • By Country
        • Russia
        • Poland
        • Hungary
        • Balkan & Baltic
        • Rest of Eastern Europe
      • By Monitoring Techniques
      • By Component
      • By Monitoring Process
      • By Deployment Type
      • By Industry
    • Market Attractiveness Analysis
      • By Country
      • By Monitoring Techniques
      • By Component
      • By Monitoring Process
      • By Deployment Type
      • By Industry
    • Key Takeaways
  16. East Asia Market Analysis 2020 to 2024 and Forecast 2025 to 2035, By Country
    • Historical Market Size Value (USD Million) Trend Analysis By Market Taxonomy, 2020 to 2024
    • Market Size Value (USD Million) Forecast By Market Taxonomy, 2025 to 2035
      • By Country
        • China
        • Japan
        • South Korea
      • By Monitoring Techniques
      • By Component
      • By Monitoring Process
      • By Deployment Type
      • By Industry
    • Market Attractiveness Analysis
      • By Country
      • By Monitoring Techniques
      • By Component
      • By Monitoring Process
      • By Deployment Type
      • By Industry
    • Key Takeaways
  17. South Asia and Pacific Market Analysis 2020 to 2024 and Forecast 2025 to 2035, By Country
    • Historical Market Size Value (USD Million) Trend Analysis By Market Taxonomy, 2020 to 2024
    • Market Size Value (USD Million) Forecast By Market Taxonomy, 2025 to 2035
      • By Country
        • India
        • ASEAN
        • Australia & New Zealand
        • Rest of South Asia and Pacific
      • By Monitoring Techniques
      • By Component
      • By Monitoring Process
      • By Deployment Type
      • By Industry
    • Market Attractiveness Analysis
      • By Country
      • By Monitoring Techniques
      • By Component
      • By Monitoring Process
      • By Deployment Type
      • By Industry
    • Key Takeaways
  18. Middle East & Africa Market Analysis 2020 to 2024 and Forecast 2025 to 2035, By Country
    • Historical Market Size Value (USD Million) Trend Analysis By Market Taxonomy, 2020 to 2024
    • Market Size Value (USD Million) Forecast By Market Taxonomy, 2025 to 2035
      • By Country
        • Kingdom of Saudi Arabia
        • Other GCC Countries
        • Turkiye
        • South Africa
        • Other African Union
        • Rest of Middle East & Africa
      • By Monitoring Techniques
      • By Component
      • By Monitoring Process
      • By Deployment Type
      • By Industry
    • Market Attractiveness Analysis
      • By Country
      • By Monitoring Techniques
      • By Component
      • By Monitoring Process
      • By Deployment Type
      • By Industry
    • Key Takeaways
  19. Key Countries Market Analysis
    • USA
      • Pricing Analysis
      • Market Share Analysis, 2024
        • By Monitoring Techniques
        • By Component
        • By Monitoring Process
        • By Deployment Type
        • By Industry
    • Canada
      • Pricing Analysis
      • Market Share Analysis, 2024
        • By Monitoring Techniques
        • By Component
        • By Monitoring Process
        • By Deployment Type
        • By Industry
    • Mexico
      • Pricing Analysis
      • Market Share Analysis, 2024
        • By Monitoring Techniques
        • By Component
        • By Monitoring Process
        • By Deployment Type
        • By Industry
    • Brazil
      • Pricing Analysis
      • Market Share Analysis, 2024
        • By Monitoring Techniques
        • By Component
        • By Monitoring Process
        • By Deployment Type
        • By Industry
    • Chile
      • Pricing Analysis
      • Market Share Analysis, 2024
        • By Monitoring Techniques
        • By Component
        • By Monitoring Process
        • By Deployment Type
        • By Industry
    • Germany
      • Pricing Analysis
      • Market Share Analysis, 2024
        • By Monitoring Techniques
        • By Component
        • By Monitoring Process
        • By Deployment Type
        • By Industry
    • UK
      • Pricing Analysis
      • Market Share Analysis, 2024
        • By Monitoring Techniques
        • By Component
        • By Monitoring Process
        • By Deployment Type
        • By Industry
    • Italy
      • Pricing Analysis
      • Market Share Analysis, 2024
        • By Monitoring Techniques
        • By Component
        • By Monitoring Process
        • By Deployment Type
        • By Industry
    • Spain
      • Pricing Analysis
      • Market Share Analysis, 2024
        • By Monitoring Techniques
        • By Component
        • By Monitoring Process
        • By Deployment Type
        • By Industry
    • France
      • Pricing Analysis
      • Market Share Analysis, 2024
        • By Monitoring Techniques
        • By Component
        • By Monitoring Process
        • By Deployment Type
        • By Industry
    • India
      • Pricing Analysis
      • Market Share Analysis, 2024
        • By Monitoring Techniques
        • By Component
        • By Monitoring Process
        • By Deployment Type
        • By Industry
    • ASEAN
      • Pricing Analysis
      • Market Share Analysis, 2024
        • By Monitoring Techniques
        • By Component
        • By Monitoring Process
        • By Deployment Type
        • By Industry
    • Australia & New Zealand
      • Pricing Analysis
      • Market Share Analysis, 2024
        • By Monitoring Techniques
        • By Component
        • By Monitoring Process
        • By Deployment Type
        • By Industry
    • China
      • Pricing Analysis
      • Market Share Analysis, 2024
        • By Monitoring Techniques
        • By Component
        • By Monitoring Process
        • By Deployment Type
        • By Industry
    • Japan
      • Pricing Analysis
      • Market Share Analysis, 2024
        • By Monitoring Techniques
        • By Component
        • By Monitoring Process
        • By Deployment Type
        • By Industry
    • South Korea
      • Pricing Analysis
      • Market Share Analysis, 2024
        • By Monitoring Techniques
        • By Component
        • By Monitoring Process
        • By Deployment Type
        • By Industry
    • Russia
      • Pricing Analysis
      • Market Share Analysis, 2024
        • By Monitoring Techniques
        • By Component
        • By Monitoring Process
        • By Deployment Type
        • By Industry
    • Poland
      • Pricing Analysis
      • Market Share Analysis, 2024
        • By Monitoring Techniques
        • By Component
        • By Monitoring Process
        • By Deployment Type
        • By Industry
    • Hungary
      • Pricing Analysis
      • Market Share Analysis, 2024
        • By Monitoring Techniques
        • By Component
        • By Monitoring Process
        • By Deployment Type
        • By Industry
    • Kingdom of Saudi Arabia
      • Pricing Analysis
      • Market Share Analysis, 2024
        • By Monitoring Techniques
        • By Component
        • By Monitoring Process
        • By Deployment Type
        • By Industry
    • Turkiye
      • Pricing Analysis
      • Market Share Analysis, 2024
        • By Monitoring Techniques
        • By Component
        • By Monitoring Process
        • By Deployment Type
        • By Industry
    • South Africa
      • Pricing Analysis
      • Market Share Analysis, 2024
        • By Monitoring Techniques
        • By Component
        • By Monitoring Process
        • By Deployment Type
        • By Industry
  20. Market Structure Analysis
    • Competition Dashboard
    • Competition Benchmarking
    • Market Share Analysis of Top Players
      • By Regional
      • By Monitoring Techniques
      • By Component
      • By Monitoring Process
      • By Deployment Type
      • By Industry
  21. Competition Analysis
    • Competition Deep Dive
      • Emerson Electric
        • Overview
        • Product Portfolio
        • Profitability by Market Segments (Product/Age /Sales Channel/Region)
        • Sales Footprint
        • Strategy Overview
          • Marketing Strategy
          • Product Strategy
          • Channel Strategy
      • General Electric
      • SKF
      • Honeywell International
      • Schaeffler AG
      • Rockwell Automation Inc.
      • National Instruments Corporation
      • Parker Hannifin Corporation
      • Dewesoft
      • Advanced Technology Services, Inc.
      • Crystal Instruments
      • Baker Hughes Company
      • Fluke Corporation
  22. Assumptions & Acronyms Used
  23. Research Methodology

List of Tables

  • Table 1: Global Market Value (USD Million) Forecast by Region, 2020 to 2035
  • Table 2: Global Market Value (USD Million) Forecast by Monitoring Techniques , 2020 to 2035
  • Table 3: Global Market Value (USD Million) Forecast by Component, 2020 to 2035
  • Table 4: Global Market Value (USD Million) Forecast by Monitoring Process, 2020 to 2035
  • Table 5: Global Market Value (USD Million) Forecast by Deployment Type, 2020 to 2035
  • Table 6: Global Market Value (USD Million) Forecast by Industry, 2020 to 2035
  • Table 7: North America Market Value (USD Million) Forecast by Country, 2020 to 2035
  • Table 8: North America Market Value (USD Million) Forecast by Monitoring Techniques , 2020 to 2035
  • Table 9: North America Market Value (USD Million) Forecast by Component, 2020 to 2035
  • Table 10: North America Market Value (USD Million) Forecast by Monitoring Process, 2020 to 2035
  • Table 11: North America Market Value (USD Million) Forecast by Deployment Type, 2020 to 2035
  • Table 12: North America Market Value (USD Million) Forecast by Industry, 2020 to 2035
  • Table 13: Latin America Market Value (USD Million) Forecast by Country, 2020 to 2035
  • Table 14: Latin America Market Value (USD Million) Forecast by Monitoring Techniques , 2020 to 2035
  • Table 15: Latin America Market Value (USD Million) Forecast by Component, 2020 to 2035
  • Table 16: Latin America Market Value (USD Million) Forecast by Monitoring Process, 2020 to 2035
  • Table 17: Latin America Market Value (USD Million) Forecast by Deployment Type, 2020 to 2035
  • Table 18: Latin America Market Value (USD Million) Forecast by Industry, 2020 to 2035
  • Table 19: Western Europe Market Value (USD Million) Forecast by Country, 2020 to 2035
  • Table 20: Western Europe Market Value (USD Million) Forecast by Monitoring Techniques , 2020 to 2035
  • Table 21: Western Europe Market Value (USD Million) Forecast by Component, 2020 to 2035
  • Table 22: Western Europe Market Value (USD Million) Forecast by Monitoring Process, 2020 to 2035
  • Table 23: Western Europe Market Value (USD Million) Forecast by Deployment Type, 2020 to 2035
  • Table 24: Western Europe Market Value (USD Million) Forecast by Industry, 2020 to 2035
  • Table 25: Eastern Europe Market Value (USD Million) Forecast by Country, 2020 to 2035
  • Table 26: Eastern Europe Market Value (USD Million) Forecast by Monitoring Techniques , 2020 to 2035
  • Table 27: Eastern Europe Market Value (USD Million) Forecast by Component, 2020 to 2035
  • Table 28: Eastern Europe Market Value (USD Million) Forecast by Monitoring Process, 2020 to 2035
  • Table 29: Eastern Europe Market Value (USD Million) Forecast by Deployment Type, 2020 to 2035
  • Table 30: Eastern Europe Market Value (USD Million) Forecast by Industry, 2020 to 2035
  • Table 31: East Asia Market Value (USD Million) Forecast by Country, 2020 to 2035
  • Table 32: East Asia Market Value (USD Million) Forecast by Monitoring Techniques , 2020 to 2035
  • Table 33: East Asia Market Value (USD Million) Forecast by Component, 2020 to 2035
  • Table 34: East Asia Market Value (USD Million) Forecast by Monitoring Process, 2020 to 2035
  • Table 35: East Asia Market Value (USD Million) Forecast by Deployment Type, 2020 to 2035
  • Table 36: East Asia Market Value (USD Million) Forecast by Industry, 2020 to 2035
  • Table 37: South Asia and Pacific Market Value (USD Million) Forecast by Country, 2020 to 2035
  • Table 38: South Asia and Pacific Market Value (USD Million) Forecast by Monitoring Techniques , 2020 to 2035
  • Table 39: South Asia and Pacific Market Value (USD Million) Forecast by Component, 2020 to 2035
  • Table 40: South Asia and Pacific Market Value (USD Million) Forecast by Monitoring Process, 2020 to 2035
  • Table 41: South Asia and Pacific Market Value (USD Million) Forecast by Deployment Type, 2020 to 2035
  • Table 42: South Asia and Pacific Market Value (USD Million) Forecast by Industry, 2020 to 2035
  • Table 43: Middle East & Africa Market Value (USD Million) Forecast by Country, 2020 to 2035
  • Table 44: Middle East & Africa Market Value (USD Million) Forecast by Monitoring Techniques , 2020 to 2035
  • Table 45: Middle East & Africa Market Value (USD Million) Forecast by Component, 2020 to 2035
  • Table 46: Middle East & Africa Market Value (USD Million) Forecast by Monitoring Process, 2020 to 2035
  • Table 47: Middle East & Africa Market Value (USD Million) Forecast by Deployment Type, 2020 to 2035
  • Table 48: Middle East & Africa Market Value (USD Million) Forecast by Industry, 2020 to 2035

List of Figures

  • Figure 1: Global Market Pricing Analysis
  • Figure 2: Global Market Value (USD Million) Forecast 2020-2035
  • Figure 3: Global Market Value Share and BPS Analysis by Monitoring Techniques , 2025 and 2035
  • Figure 4: Global Market Y to o to Y Growth Comparison by Monitoring Techniques , 2025-2035
  • Figure 5: Global Market Attractiveness Analysis by Monitoring Techniques
  • Figure 6: Global Market Value Share and BPS Analysis by Component, 2025 and 2035
  • Figure 7: Global Market Y to o to Y Growth Comparison by Component, 2025-2035
  • Figure 8: Global Market Attractiveness Analysis by Component
  • Figure 9: Global Market Value Share and BPS Analysis by Monitoring Process, 2025 and 2035
  • Figure 10: Global Market Y to o to Y Growth Comparison by Monitoring Process, 2025-2035
  • Figure 11: Global Market Attractiveness Analysis by Monitoring Process
  • Figure 12: Global Market Value Share and BPS Analysis by Deployment Type, 2025 and 2035
  • Figure 13: Global Market Y to o to Y Growth Comparison by Deployment Type, 2025-2035
  • Figure 14: Global Market Attractiveness Analysis by Deployment Type
  • Figure 15: Global Market Value Share and BPS Analysis by Industry, 2025 and 2035
  • Figure 16: Global Market Y to o to Y Growth Comparison by Industry, 2025-2035
  • Figure 17: Global Market Attractiveness Analysis by Industry
  • Figure 18: Global Market Value (USD Million) Share and BPS Analysis by Region, 2025 and 2035
  • Figure 19: Global Market Y to o to Y Growth Comparison by Region, 2025-2035
  • Figure 20: Global Market Attractiveness Analysis by Region
  • Figure 21: North America Market Incremental Dollar Opportunity, 2025-2035
  • Figure 22: Latin America Market Incremental Dollar Opportunity, 2025-2035
  • Figure 23: Western Europe Market Incremental Dollar Opportunity, 2025-2035
  • Figure 24: Eastern Europe Market Incremental Dollar Opportunity, 2025-2035
  • Figure 25: East Asia Market Incremental Dollar Opportunity, 2025-2035
  • Figure 26: South Asia and Pacific Market Incremental Dollar Opportunity, 2025-2035
  • Figure 27: Middle East & Africa Market Incremental Dollar Opportunity, 2025-2035
  • Figure 28: North America Market Value Share and BPS Analysis by Country, 2025 and 2035
  • Figure 29: North America Market Value Share and BPS Analysis by Monitoring Techniques , 2025 and 2035
  • Figure 30: North America Market Y to o to Y Growth Comparison by Monitoring Techniques , 2025-2035
  • Figure 31: North America Market Attractiveness Analysis by Monitoring Techniques
  • Figure 32: North America Market Value Share and BPS Analysis by Component, 2025 and 2035
  • Figure 33: North America Market Y to o to Y Growth Comparison by Component, 2025-2035
  • Figure 34: North America Market Attractiveness Analysis by Component
  • Figure 35: North America Market Value Share and BPS Analysis by Monitoring Process, 2025 and 2035
  • Figure 36: North America Market Y to o to Y Growth Comparison by Monitoring Process, 2025-2035
  • Figure 37: North America Market Attractiveness Analysis by Monitoring Process
  • Figure 38: North America Market Value Share and BPS Analysis by Deployment Type, 2025 and 2035
  • Figure 39: North America Market Y to o to Y Growth Comparison by Deployment Type, 2025-2035
  • Figure 40: North America Market Attractiveness Analysis by Deployment Type
  • Figure 41: North America Market Value Share and BPS Analysis by Industry, 2025 and 2035
  • Figure 42: North America Market Y to o to Y Growth Comparison by Industry, 2025-2035
  • Figure 43: North America Market Attractiveness Analysis by Industry
  • Figure 44: Latin America Market Value Share and BPS Analysis by Country, 2025 and 2035
  • Figure 45: Latin America Market Value Share and BPS Analysis by Monitoring Techniques , 2025 and 2035
  • Figure 46: Latin America Market Y to o to Y Growth Comparison by Monitoring Techniques , 2025-2035
  • Figure 47: Latin America Market Attractiveness Analysis by Monitoring Techniques
  • Figure 48: Latin America Market Value Share and BPS Analysis by Component, 2025 and 2035
  • Figure 49: Latin America Market Y to o to Y Growth Comparison by Component, 2025-2035
  • Figure 50: Latin America Market Attractiveness Analysis by Component
  • Figure 51: Latin America Market Value Share and BPS Analysis by Monitoring Process, 2025 and 2035
  • Figure 52: Latin America Market Y to o to Y Growth Comparison by Monitoring Process, 2025-2035
  • Figure 53: Latin America Market Attractiveness Analysis by Monitoring Process
  • Figure 54: Latin America Market Value Share and BPS Analysis by Deployment Type, 2025 and 2035
  • Figure 55: Latin America Market Y to o to Y Growth Comparison by Deployment Type, 2025-2035
  • Figure 56: Latin America Market Attractiveness Analysis by Deployment Type
  • Figure 57: Latin America Market Value Share and BPS Analysis by Industry, 2025 and 2035
  • Figure 58: Latin America Market Y to o to Y Growth Comparison by Industry, 2025-2035
  • Figure 59: Latin America Market Attractiveness Analysis by Industry
  • Figure 60: Western Europe Market Value Share and BPS Analysis by Country, 2025 and 2035
  • Figure 61: Western Europe Market Value Share and BPS Analysis by Monitoring Techniques , 2025 and 2035
  • Figure 62: Western Europe Market Y to o to Y Growth Comparison by Monitoring Techniques , 2025-2035
  • Figure 63: Western Europe Market Attractiveness Analysis by Monitoring Techniques
  • Figure 64: Western Europe Market Value Share and BPS Analysis by Component, 2025 and 2035
  • Figure 65: Western Europe Market Y to o to Y Growth Comparison by Component, 2025-2035
  • Figure 66: Western Europe Market Attractiveness Analysis by Component
  • Figure 67: Western Europe Market Value Share and BPS Analysis by Monitoring Process, 2025 and 2035
  • Figure 68: Western Europe Market Y to o to Y Growth Comparison by Monitoring Process, 2025-2035
  • Figure 69: Western Europe Market Attractiveness Analysis by Monitoring Process
  • Figure 70: Western Europe Market Value Share and BPS Analysis by Deployment Type, 2025 and 2035
  • Figure 71: Western Europe Market Y to o to Y Growth Comparison by Deployment Type, 2025-2035
  • Figure 72: Western Europe Market Attractiveness Analysis by Deployment Type
  • Figure 73: Western Europe Market Value Share and BPS Analysis by Industry, 2025 and 2035
  • Figure 74: Western Europe Market Y to o to Y Growth Comparison by Industry, 2025-2035
  • Figure 75: Western Europe Market Attractiveness Analysis by Industry
  • Figure 76: Eastern Europe Market Value Share and BPS Analysis by Country, 2025 and 2035
  • Figure 77: Eastern Europe Market Value Share and BPS Analysis by Monitoring Techniques , 2025 and 2035
  • Figure 78: Eastern Europe Market Y to o to Y Growth Comparison by Monitoring Techniques , 2025-2035
  • Figure 79: Eastern Europe Market Attractiveness Analysis by Monitoring Techniques
  • Figure 80: Eastern Europe Market Value Share and BPS Analysis by Component, 2025 and 2035
  • Figure 81: Eastern Europe Market Y to o to Y Growth Comparison by Component, 2025-2035
  • Figure 82: Eastern Europe Market Attractiveness Analysis by Component
  • Figure 83: Eastern Europe Market Value Share and BPS Analysis by Monitoring Process, 2025 and 2035
  • Figure 84: Eastern Europe Market Y to o to Y Growth Comparison by Monitoring Process, 2025-2035
  • Figure 85: Eastern Europe Market Attractiveness Analysis by Monitoring Process
  • Figure 86: Eastern Europe Market Value Share and BPS Analysis by Deployment Type, 2025 and 2035
  • Figure 87: Eastern Europe Market Y to o to Y Growth Comparison by Deployment Type, 2025-2035
  • Figure 88: Eastern Europe Market Attractiveness Analysis by Deployment Type
  • Figure 89: Eastern Europe Market Value Share and BPS Analysis by Industry, 2025 and 2035
  • Figure 90: Eastern Europe Market Y to o to Y Growth Comparison by Industry, 2025-2035
  • Figure 91: Eastern Europe Market Attractiveness Analysis by Industry
  • Figure 92: East Asia Market Value Share and BPS Analysis by Country, 2025 and 2035
  • Figure 93: East Asia Market Value Share and BPS Analysis by Monitoring Techniques , 2025 and 2035
  • Figure 94: East Asia Market Y to o to Y Growth Comparison by Monitoring Techniques , 2025-2035
  • Figure 95: East Asia Market Attractiveness Analysis by Monitoring Techniques
  • Figure 96: East Asia Market Value Share and BPS Analysis by Component, 2025 and 2035
  • Figure 97: East Asia Market Y to o to Y Growth Comparison by Component, 2025-2035
  • Figure 98: East Asia Market Attractiveness Analysis by Component
  • Figure 99: East Asia Market Value Share and BPS Analysis by Monitoring Process, 2025 and 2035
  • Figure 100: East Asia Market Y to o to Y Growth Comparison by Monitoring Process, 2025-2035
  • Figure 101: East Asia Market Attractiveness Analysis by Monitoring Process
  • Figure 102: East Asia Market Value Share and BPS Analysis by Deployment Type, 2025 and 2035
  • Figure 103: East Asia Market Y to o to Y Growth Comparison by Deployment Type, 2025-2035
  • Figure 104: East Asia Market Attractiveness Analysis by Deployment Type
  • Figure 105: East Asia Market Value Share and BPS Analysis by Industry, 2025 and 2035
  • Figure 106: East Asia Market Y to o to Y Growth Comparison by Industry, 2025-2035
  • Figure 107: East Asia Market Attractiveness Analysis by Industry
  • Figure 108: South Asia and Pacific Market Value Share and BPS Analysis by Country, 2025 and 2035
  • Figure 109: South Asia and Pacific Market Value Share and BPS Analysis by Monitoring Techniques , 2025 and 2035
  • Figure 110: South Asia and Pacific Market Y to o to Y Growth Comparison by Monitoring Techniques , 2025-2035
  • Figure 111: South Asia and Pacific Market Attractiveness Analysis by Monitoring Techniques
  • Figure 112: South Asia and Pacific Market Value Share and BPS Analysis by Component, 2025 and 2035
  • Figure 113: South Asia and Pacific Market Y to o to Y Growth Comparison by Component, 2025-2035
  • Figure 114: South Asia and Pacific Market Attractiveness Analysis by Component
  • Figure 115: South Asia and Pacific Market Value Share and BPS Analysis by Monitoring Process, 2025 and 2035
  • Figure 116: South Asia and Pacific Market Y to o to Y Growth Comparison by Monitoring Process, 2025-2035
  • Figure 117: South Asia and Pacific Market Attractiveness Analysis by Monitoring Process
  • Figure 118: South Asia and Pacific Market Value Share and BPS Analysis by Deployment Type, 2025 and 2035
  • Figure 119: South Asia and Pacific Market Y to o to Y Growth Comparison by Deployment Type, 2025-2035
  • Figure 120: South Asia and Pacific Market Attractiveness Analysis by Deployment Type
  • Figure 121: South Asia and Pacific Market Value Share and BPS Analysis by Industry, 2025 and 2035
  • Figure 122: South Asia and Pacific Market Y to o to Y Growth Comparison by Industry, 2025-2035
  • Figure 123: South Asia and Pacific Market Attractiveness Analysis by Industry
  • Figure 124: Middle East & Africa Market Value Share and BPS Analysis by Country, 2025 and 2035
  • Figure 125: Middle East & Africa Market Value Share and BPS Analysis by Monitoring Techniques , 2025 and 2035
  • Figure 126: Middle East & Africa Market Y to o to Y Growth Comparison by Monitoring Techniques , 2025-2035
  • Figure 127: Middle East & Africa Market Attractiveness Analysis by Monitoring Techniques
  • Figure 128: Middle East & Africa Market Value Share and BPS Analysis by Component, 2025 and 2035
  • Figure 129: Middle East & Africa Market Y to o to Y Growth Comparison by Component, 2025-2035
  • Figure 130: Middle East & Africa Market Attractiveness Analysis by Component
  • Figure 131: Middle East & Africa Market Value Share and BPS Analysis by Monitoring Process, 2025 and 2035
  • Figure 132: Middle East & Africa Market Y to o to Y Growth Comparison by Monitoring Process, 2025-2035
  • Figure 133: Middle East & Africa Market Attractiveness Analysis by Monitoring Process
  • Figure 134: Middle East & Africa Market Value Share and BPS Analysis by Deployment Type, 2025 and 2035
  • Figure 135: Middle East & Africa Market Y to o to Y Growth Comparison by Deployment Type, 2025-2035
  • Figure 136: Middle East & Africa Market Attractiveness Analysis by Deployment Type
  • Figure 137: Middle East & Africa Market Value Share and BPS Analysis by Industry, 2025 and 2035
  • Figure 138: Middle East & Africa Market Y to o to Y Growth Comparison by Industry, 2025-2035
  • Figure 139: Middle East & Africa Market Attractiveness Analysis by Industry
  • Figure 140: Global Market - Tier Structure Analysis
  • Figure 141: Global Market - Company Share Analysis
Dashboard
Dashboard
Dashboard
Dashboard
Dashboard
Dashboard

Full Research Suite comprises of:

Market outlook & trends analysis

Market outlook & trends analysis

Interviews & case studies

Interviews & case studies

Strategic recommendations

Strategic recommendations

Vendor profiles & capabilities analysis

Vendor profiles & capabilities analysis

5-year forecasts

5-year forecasts

8 regions and 60+ country-level data splits

8 regions and 60+ country-level data splits

Market segment data splits

Market segment data splits

12 months of continuous data updates

12 months of continuous data updates

DELIVERED AS:

PDF EXCEL ONLINE

Full Research Suite


$5000

$7500

$10000

Buy Report Now
Similar Industry Reports

Similar Industry Reports

Machine Glazed Paper Market

Machine Glazed Paper Market Size and Share Forecast Outlook 2025 to 2035

Machine Glazed Kraft Paper Market

Machine Glazed Kraft Paper Market Forecast and Outlook 2025 to 2035

Machine Glazed Paper Industry Analysis in Asia Pacific

Machine Glazed Paper Industry Analysis in Asia Pacific Forecast Outlook 2025 to 2035

Machine Vision Camera Market

Machine Vision Camera Market Size and Share Forecast Outlook 2025 to 2035

Machine Tool Oils Market

Machine Tool Oils Market Size and Share Forecast Outlook 2025 to 2035

Machine Vision System And Services Market

Machine Vision System And Services Market Size and Share Forecast Outlook 2025 to 2035

Machine Glazed Paper Industry Analysis in Western Europe

Machine Glazed Paper Industry Analysis in Western Europe Size and Share Forecast Outlook 2025 to 2035

Machine Glazed Paper Industry Analysis in Korea

Machine Glazed Paper Industry Analysis in Korea Size and Share Forecast Outlook 2025 to 2035

Machine Glazed Paper Industry Analysis in Japan

Machine Glazed Paper Industry Analysis in Japan Size and Share Forecast Outlook 2025 to 2035

Machine Tool Cooling System Market

Machine Tool Cooling System Market Analysis - Size, Share, and Forecast Outlook 2025 to 2035

Machine Tool Touch Probe Market

Machine Tool Touch Probe Market Analysis - Size, Growth, and Forecast 2025 to 2035

Machine Mount Market

Machine Mount Market Analysis - Size & Industry Trends 2025 to 2035

Machine Control System Market

Machine Control System Market Growth – Trends & Forecast 2025 to 2035

Machine Automation Controller Market

Machine Automation Controller Market Growth – Trends & Forecast 2025 to 2035

Machine-to-Machine (M2M) Connections Market

Machine-to-Machine (M2M) Connections Market – IoT & Smart Devices 2025 to 2035

Machine Safety Market

Machine Safety Market Analysis by Component, Industry, and Region Through 2035

Machine Glazed Paper Market Share Analysis

Key Players & Market Share in Machine Glazed Paper Industry

Machine Vision Market

Machine Vision Market Insights – Growth & Forecast 2024-2034

Machine Learning As A Services Market

Machine Learning As A Services Market

BMI Machine Market
BMI Machine Market

BMI Machine Market Size and Share Forecast Outlook 2025 to 2035

Future Market Insights

Machine Condition Monitoring Market

Chat With MaRIA

Chat With

MaRIA

Hi There, I am MaRIA, Your Market Research Intelligence Assistant. How may I help you?