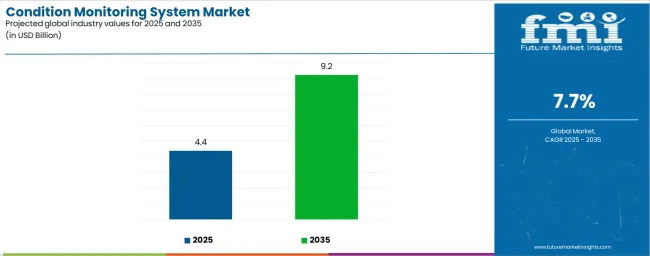
The global condition monitoring system market is projected to reach USD 9.2 billion by 2035, recording an absolute increase of USD 4.8 billion over the forecast period. The market is valued at USD 4.4 billion in 2025 and is set to rise at a CAGR of 7.7% during the assessment period. The overall market size is expected to grow by nearly 2.1 times during the same period, supported by increasing demand for predictive maintenance solutions and industrial automation worldwide, driving demand for advanced monitoring technologies and increasing investments in equipment reliability modernization and operational efficiency projects globally. However, high implementation costs and technical complexity challenges may pose challenges to market expansion.
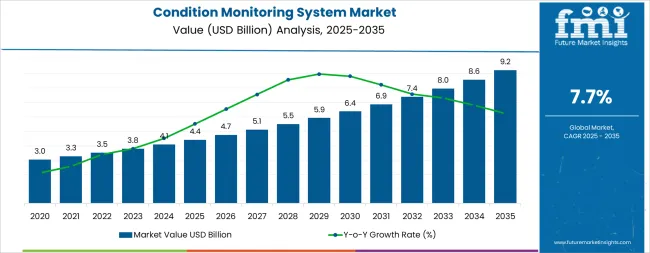
Between 2025 and 2030, the condition monitoring system market is projected to expand from USD 4.4 billion to USD 6.5 billion, resulting in a value increase of USD 2.1 billion, which represents 43.8% of the total forecast growth for the decade. This phase of development will be shaped by rising demand for industrial automation and predictive maintenance, product innovation in AI-powered monitoring technologies and IoT-based sensor systems, as well as expanding integration with smart factory initiatives and operational efficiency programs. Companies are establishing competitive positions through investment in advanced monitoring technologies, wireless sensor solutions, and strategic market expansion across manufacturing, energy, and industrial processing applications.
From 2030 to 2035, the market is forecast to grow from USD 6.5 billion to USD 9.2 billion, adding another USD 2.7 billion, which constitutes 56.2% of the overall ten-year expansion. This period is expected to be characterized by the expansion of specialized monitoring systems, including advanced AI-powered analytics formulations and integrated predictive maintenance solutions tailored for specific industry requirements, strategic collaborations between technology manufacturers and end-user industries, and an enhanced focus on operational efficiency and equipment reliability. The growing emphasis on equipment optimization and advanced diagnostic processes will drive demand for comprehensive, high-performance condition monitoring solutions across diverse industrial applications.
| Metric | Value |
|---|---|
| Market Value (2025) | USD 4.4 billion |
| Market Forecast Value (2035) | USD 9.2 billion |
| Forecast CAGR (2025 to 2035) | 7.7% |
The condition monitoring system market grows by enabling industrial operators to achieve superior equipment reliability and operational efficiency across manufacturing facilities, ranging from small-scale production operations to mega industrial complexes. Industrial operators face mounting pressure to improve operational efficiency and equipment reliability, with condition monitoring systems typically providing 20-30% improvement in maintenance cost reduction compared to conventional maintenance approaches, making advanced monitoring technologies essential for competitive industrial operations. The manufacturing industry's need for maximum equipment uptime creates demand for advanced monitoring solutions that can minimize unexpected failures, enhance equipment durability, and ensure consistent performance across diverse operational conditions. Government initiatives promoting industrial automation and operational efficiency drive adoption in manufacturing, energy, and processing applications, where equipment performance has a direct impact on operational efficiency and cost optimization. However, high implementation costs and the complexity of achieving consistent performance across different equipment types may limit adoption rates among cost-sensitive operators and developing regions with limited technical expertise.
The market is segmented by monitoring technique, end-use industry, and region. By monitoring technique, the market is divided into corrosion monitoring, infrared thermography, motor condition monitoring, oil analysis, ultrasound testing, and vibration analysis. Based on end-use industry, the market is categorized into power generation, oil & gas, automotive & transportation, aerospace & defense, metals & mining, and chemical & petrochemical. Regionally, the market is divided into North America, Latin America, Western Europe, Eastern Europe, East Asia, South Asia, and Middle East & Africa.
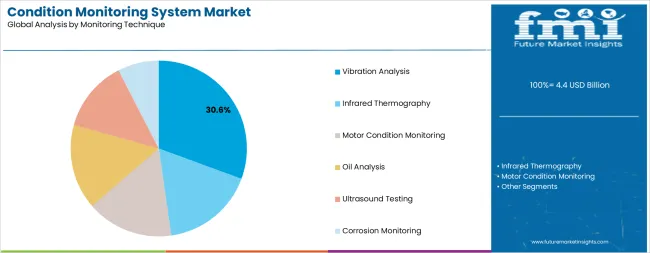
The vibration analysis segment represents the dominant force in the condition monitoring system market, capturing approximately 30.6% of total market share in 2025. This advanced monitoring category encompasses formulations featuring superior diagnostic characteristics, including enhanced fault detection capabilities and optimized performance combinations that enable superior equipment monitoring and enhanced reliability characteristics. The vibration analysis segment's market leadership stems from its exceptional performance capabilities in rotating machinery applications, with systems capable of detecting mechanical imbalances, misalignments, and bearing failures while maintaining consistent performance and diagnostic reliability across diverse industrial operations.
The oil analysis segment maintains a substantial market share, serving operators who require cost-effective monitoring solutions for fluid-based equipment applications. These systems offer reliable performance for general-purpose industrial monitoring applications while providing sufficient diagnostic capability to meet basic performance requirements in manufacturing and processing applications.
Key technological advantages driving the vibration analysis segment include:
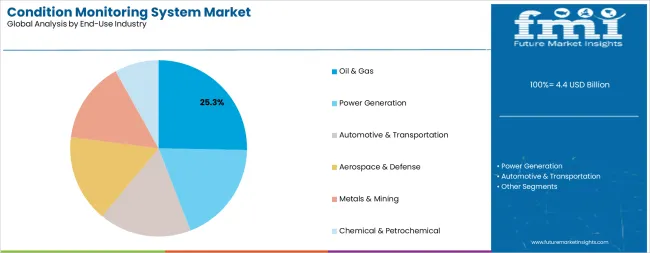
Oil & Gas applications dominate the condition monitoring system market with approximately 25.3% market share in 2025, reflecting the critical role of equipment reliability in serving energy production demand and supporting operational safety initiatives. The oil & gas segment's market leadership is reinforced by increasing equipment reliability requirements, safety compliance needs, and rising demand for cost-effective maintenance optimization that directly correlates with operational flexibility and production responsiveness.
The power generation segment represents the second-largest end-use category, capturing significant market share through specialized requirements for power plant operations, turbine monitoring, and high-reliability power generation systems. This segment benefits from growing demand for grid reliability systems that meet stringent performance, efficiency, and safety requirements in demanding energy applications.
The manufacturing segment accounts for substantial market share, serving facilities requiring comprehensive equipment monitoring solutions. The aerospace & defense segment captures market share through high-reliability applications, while other end-use ranges represent specialized market segments.
Key market dynamics supporting end-use growth include:
The market is driven by three concrete demand factors tied to industrial and operational optimization outcomes. First, global industrial automation growth and equipment modernization create increasing demand for high-performance monitoring solutions, with Industry 4.0 initiatives projected to continue expanding, requiring specialized monitoring technologies for maximum operational efficiency. Second, modernization of legacy industrial equipment and predictive maintenance adoption drive the utilization of superior monitoring technologies, with operators seeking 20-30% improvement in maintenance cost reduction and operational reliability enhancement. Third, technological advancements in AI-powered analytics and IoT sensor technologies enable more effective and intelligent monitoring systems that reduce operational costs while improving long-term performance and cost-effectiveness.
Market restraints include high implementation costs that can impact system adoption and profitability margins, particularly during periods of budget constraints or capital investment limitations affecting key manufacturing and processing industries. Technical complexity in system integration poses another significant challenge, as achieving consistent performance standards across different equipment types and operational environments requires specialized expertise and quality control systems, potentially causing project delays and increased implementation costs. Skills shortage in system operation and maintenance creates additional challenges for operators, demanding ongoing investment in training capabilities and compliance with varying industrial automation standards.
Key trends indicate accelerated adoption in emerging markets, particularly India, China, and Southeast Asia, where rapid industrial development and equipment modernization capacity expansion drive comprehensive condition monitoring system development. Technology advancement trends toward AI integration with enhanced predictive analytics, real-time monitoring, and multi-functional system capabilities enable next-generation product development that addresses multiple monitoring requirements simultaneously. However, the market thesis could face disruption if alternative maintenance technologies or significant changes in industrial practices minimize reliance on traditional condition monitoring approaches.
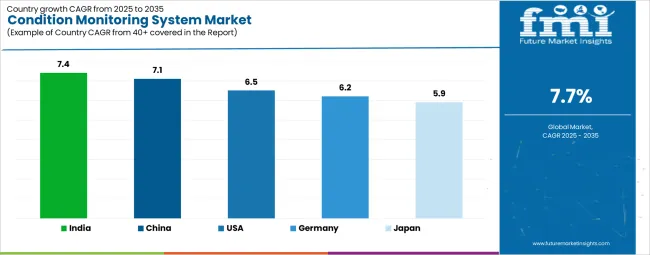
| Country | CAGR (2025-2035) |
|---|---|
| India | 7.4% |
| China | 7.1% |
| United States | 6.5% |
| Germany | 6.2% |
| Japan | 5.9% |
The condition monitoring system market is gaining momentum worldwide, with India taking the lead because of massive industrial expansion and government-backed manufacturing modernization programs. Close behind, China benefits from growing industrial automation and smart factory initiatives, positioning itself as a strategic growth hub in the Asian region. United States shows steady advancement, where integration of advanced monitoring technologies strengthens its role in the global industrial automation supply chain. Germany is focusing on precision manufacturing and Industry 4.0 development, signaling an ambition to capitalize on growing opportunities in European industrial markets. Japan stands out for its advanced automation technology development in existing industrial applications, recording consistent progress in manufacturing efficiency advancement. Together, India and China anchor the global expansion story, while the rest build stability and diversity into the market's growth path.
The report covers an in-depth analysis of 40+ countriestop-performing countries are highlighted below.
India demonstrates the strongest growth potential in the Condition Monitoring System Market with a CAGR of 7.4% through 2035. The country's leadership position stems from massive industrial expansion projects, government-backed manufacturing programs, and aggressive automation targets, driving the adoption of high-performance monitoring systems. Growth is concentrated in major industrial regions, including Maharashtra, Gujarat, Tamil Nadu, and Karnataka, where manufacturing companies and processing facilities are implementing advanced monitoring solutions for enhanced operational performance and international competitiveness. Distribution channels through established technology suppliers and direct manufacturer relationships expand deployment across manufacturing facilities and industrial processing centers. The country's industrial leadership strategy provides policy support for advanced monitoring development, including high-performance system adoption.
Key market factors:
In Beijing, Shanghai, Guangzhou, and Shenzhen, the adoption of condition monitoring systems is accelerating across manufacturing facilities and industrial processing centers, driven by smart manufacturing targets and government industrial modernization initiatives. The market demonstrates strong growth momentum with a CAGR of 7.1% through 2035, linked to comprehensive industrial capacity expansion and increasing focus on operational efficiency solutions. Chinese manufacturers are implementing advanced monitoring systems and predictive analytics platforms to enhance equipment performance while meeting growing demand for industrial products in domestic and export markets. The country's industrial development programs create continued demand for high-performance monitoring solutions, while increasing emphasis on local manufacturing drives adoption of advanced technologies and automation systems.
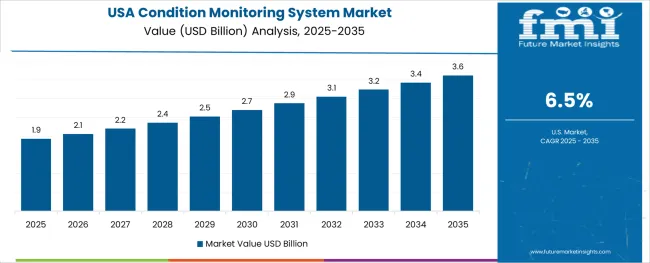
United States' advanced industrial sector demonstrates sophisticated implementation of condition monitoring systems, with documented case studies showing efficiency improvements in manufacturing applications through optimized monitoring solutions. The country's industrial infrastructure in major manufacturing centers, including Texas, California, Ohio, and Michigan, showcases integration of advanced monitoring technologies with existing operational systems, leveraging expertise in industrial automation and precision manufacturing. American manufacturers emphasize quality standards and operational compliance, creating demand for high-performance monitoring solutions that support efficiency initiatives and regulatory requirements. The market maintains steady growth through focus on industrial innovation and operational competitiveness, with a CAGR of 6.5% through 2035.
Key development areas:
The market in Germany expansion is driven by diverse industrial demand, including manufacturing automation in Munich and Stuttgart regions, chemical processing development in Rhine-Ruhr and Frankfurt, and comprehensive industrial modernization across multiple manufacturing areas. The country demonstrates promising growth potential with a CAGR of 6.2% through 2035, supported by national industrial programs and regional automation development initiatives. German manufacturers face implementation challenges related to technology integration and operational efficiency requirements, requiring monitoring system upgrade approaches and international partnership support. However, growing industrial targets and operational competitiveness requirements create compelling business cases for condition monitoring system adoption, particularly in manufacturing regions where efficiency performance has a direct impact on industrial competitiveness.
Market characteristics:
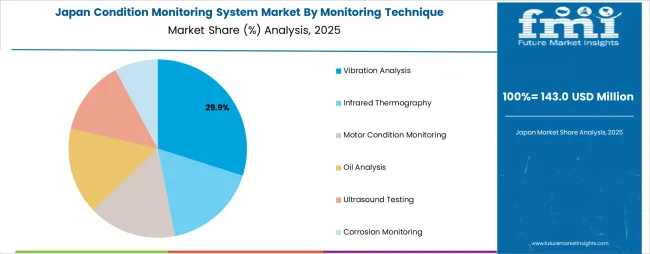
The market in Japan leads in advanced industrial innovation based on integration with next-generation automation technologies and sophisticated monitoring applications for enhanced performance characteristics. The country shows solid potential with a CAGR of 5.9% through 2035, driven by industrial modernization programs and advanced automation initiatives across major manufacturing regions, including Kanto, Kansai, Chubu, and Kyushu. Japanese manufacturers are adopting advanced monitoring systems for operational optimization and quality compliance, particularly in regions with industrial mandates and advanced processing facilities requiring superior performance differentiation. Technology deployment channels through established automation distributors and direct manufacturer relationships expand coverage across manufacturing facilities and industrial processing operations.
Leading market segments:
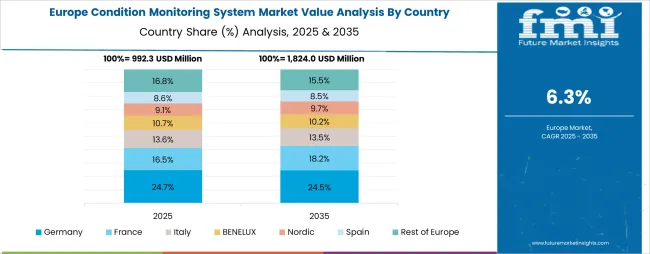
The condition monitoring system market in Europe is projected to grow from USD 1.1 billion in 2025 to USD 2.1 billion by 2035, registering a CAGR of 6.8% over the forecast period. Germany is expected to maintain its leadership position with a 26.4% market share in 2025, declining slightly to 26.0% by 2035, supported by its extensive manufacturing infrastructure and major industrial centers, including Bavaria, North Rhine-Westphalia, and Baden-Württemberg production facilities.
United Kingdom follows with a 22.8% share in 2025, projected to reach 23.2% by 2035, driven by comprehensive industrial development programs and advanced automation initiatives implementing monitoring technologies. France holds a 19.1% share in 2025, expected to maintain 18.7% by 2035 through ongoing manufacturing facility upgrades and industrial technology development. Italy commands a 15.9% share, while Netherlands accounts for 9.4% in 2025. The Rest of Europe region is anticipated to gain momentum, expanding its collective share from 6.4% to 7.6% by 2035, attributed to increasing condition monitoring system adoption in Nordic countries and emerging Eastern European manufacturing facilities implementing advanced monitoring programs.
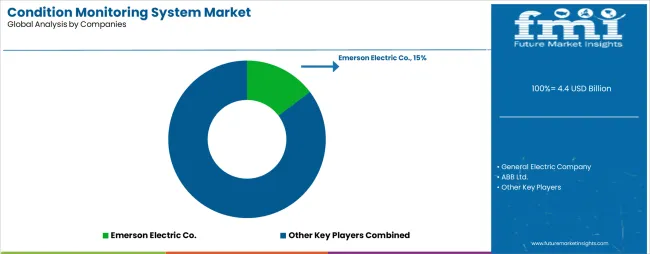
The condition monitoring system market features approximately 20-25 meaningful players with moderate concentration, where the top three companies control roughly 25-32% of global market share through established technology platforms and extensive industrial automation relationships. Competition centers on technological innovation, system reliability, and analytical capabilities rather than price competition alone.
Market leaders include Emerson Electric Co., General Electric Company, and ABB Ltd., which maintain competitive advantages through comprehensive monitoring solution portfolios, global manufacturing networks, and deep expertise in the industrial automation and predictive maintenance sectors, creating high switching costs for customers. These companies leverage research and development capabilities and ongoing technical support relationships to defend market positions while expanding into adjacent industrial and processing applications.
Challengers encompass Schneider Electric SE and Siemens AG, which compete through specialized monitoring solutions and strong regional presence in key industrial markets. Technology specialists, including Honeywell International Inc., SKF Group, and National Instruments Corporation, focus on specific monitoring configurations or vertical applications, offering differentiated capabilities in sensor technology, customization services, and specialized analytical characteristics.
Regional players and emerging technology providers create competitive pressure through cost-effective solutions and rapid customization capabilities, particularly in high-growth markets including India, China, and Southeast Asia, where local presence provides advantages in customer service and regulatory compliance. Market dynamics favor companies that combine advanced monitoring technologies with comprehensive technical support offerings that address the complete system lifecycle from design development through ongoing operational optimization.
Condition monitoring systems represent specialized industrial technologies that enable operators to achieve 20-30% improvement in maintenance cost reduction compared to conventional maintenance approaches, delivering superior equipment reliability and operational efficiency with enhanced predictive capabilities in demanding industrial applications. With the market projected to grow from USD 4.4 billion in 2025 to USD 9.2 billion by 2035 at a 7.7% CAGR, these monitoring systems offer compelling advantages - enhanced equipment reliability, customizable monitoring configurations, and operational durability - making them essential for manufacturing applications, energy operations, and industrial facilities seeking alternatives to reactive maintenance systems that compromise performance through unexpected failures. Scaling market adoption and technological advancement requires coordinated action across industrial policy, automation standards development, technology manufacturers, processing industries, and monitoring system investment capital.
| Items | Values |
|---|---|
| Quantitative Units | USD 4.4 billion |
| Monitoring Technique | Corrosion Monitoring, Infrared Thermography, Motor Condition Monitoring, Oil Analysis, Ultrasound Testing, Vibration Analysis |
| End-Use Industry | Power Generation, Oil & Gas, Automotive & Transportation, Aerospace & Defense, Metals & Mining, Chemical & Petrochemical |
| Regions Covered | North America, Latin America, Western Europe, Eastern Europe, East Asia, South Asia, Middle East & Africa |
| Country Covered | India, China, United States, Germany, Japan, and 40+ countries |
| Key Companies Profiled | Emerson Electric Co., General Electric Company, ABB Ltd., Schneider Electric SE, Siemens AG, Honeywell International Inc., SKF Group, National Instruments Corporation |
| Additional Attributes | Dollar sales by monitoring technique and end-use industry categories, regional adoption trends across East Asia, South Asia, and North America, competitive landscape with monitoring system providers and technology integrators, industrial facility requirements and specifications, integration with automation initiatives and industrial systems, innovations in monitoring technology and diagnostic systems, and development of specialized configurations with performance and reliability capabilities. |
The global condition monitoring system market is estimated to be valued at USD 4.4 billion in 2025.
The market size for the condition monitoring system market is projected to reach USD 9.2 billion by 2035.
The condition monitoring system market is expected to grow at a 7.7% CAGR between 2025 and 2035.
The key product types in condition monitoring system market are vibration analysis, infrared thermography, motor condition monitoring, oil analysis, ultrasound testing and corrosion monitoring.
In terms of end-use industry, oil & gas segment to command 25.3% share in the condition monitoring system market in 2025.


Our Research Products

The "Full Research Suite" delivers actionable market intel, deep dives on markets or technologies, so clients act faster, cut risk, and unlock growth.

The Leaderboard benchmarks and ranks top vendors, classifying them as Established Leaders, Leading Challengers, or Disruptors & Challengers.

Locates where complements amplify value and substitutes erode it, forecasting net impact by horizon

We deliver granular, decision-grade intel: market sizing, 5-year forecasts, pricing, adoption, usage, revenue, and operational KPIs—plus competitor tracking, regulation, and value chains—across 60 countries broadly.

Spot the shifts before they hit your P&L. We track inflection points, adoption curves, pricing moves, and ecosystem plays to show where demand is heading, why it is changing, and what to do next across high-growth markets and disruptive tech

Real-time reads of user behavior. We track shifting priorities, perceptions of today’s and next-gen services, and provider experience, then pace how fast tech moves from trial to adoption, blending buyer, consumer, and channel inputs with social signals (#WhySwitch, #UX).

Partner with our analyst team to build a custom report designed around your business priorities. From analysing market trends to assessing competitors or crafting bespoke datasets, we tailor insights to your needs.
Supplier Intelligence
Discovery & Profiling
Capacity & Footprint
Performance & Risk
Compliance & Governance
Commercial Readiness
Who Supplies Whom
Scorecards & Shortlists
Playbooks & Docs
Category Intelligence
Definition & Scope
Demand & Use Cases
Cost Drivers
Market Structure
Supply Chain Map
Trade & Policy
Operating Norms
Deliverables
Buyer Intelligence
Account Basics
Spend & Scope
Procurement Model
Vendor Requirements
Terms & Policies
Entry Strategy
Pain Points & Triggers
Outputs
Pricing Analysis
Benchmarks
Trends
Should-Cost
Indexation
Landed Cost
Commercial Terms
Deliverables
Brand Analysis
Positioning & Value Prop
Share & Presence
Customer Evidence
Go-to-Market
Digital & Reputation
Compliance & Trust
KPIs & Gaps
Outputs
Full Research Suite comprises of:
Market outlook & trends analysis
Interviews & case studies
Strategic recommendations
Vendor profiles & capabilities analysis
5-year forecasts
8 regions and 60+ country-level data splits
Market segment data splits
12 months of continuous data updates
DELIVERED AS:
PDF EXCEL ONLINE
Market Share Breakdown of Condition Monitoring System Providers
Condition Monitoring Service Market Growth - Trends, Demand & Innovations 2025 to 2035
Condition Monitoring Sensors Market
Air Conditioning System Market Size and Share Forecast Outlook 2025 to 2035
Neuro-monitoring System Market Size and Share Forecast Outlook 2025 to 2035
Urine Monitoring Systems Market Analysis - Size, Trends & Forecast 2025 to 2035
Brain Monitoring Systems Market is segmented by Lateral Flow Readers and Kits and Reagents from 2025 to 2035
Yield Monitoring Systems Market
Driver Monitoring System Market Growth - Trends & Forecast 2025 to 2035
Tunnel Monitoring System Market Growth - Trends & Forecast 2025 to 2035
Machine Condition Monitoring Market Size and Share Forecast Outlook 2025 to 2035
Patient Monitoring System Market Size and Share Forecast Outlook 2025 to 2035
FTIR Oil Condition Monitoring Market
B-Ketone Monitoring System Market Size and Share Forecast Outlook 2025 to 2035
Pipeline Monitoring System Market Size and Share Forecast Outlook 2025 to 2035
Air Flow Monitoring System Market
Emission Monitoring Systems Market
Livestock Monitoring System Market
Remote ICU Monitoring System Market Size and Share Forecast Outlook 2025 to 2035
Substation Monitoring System Market Size and Share Forecast Outlook 2025 to 2035

Thank you!
You will receive an email from our Business Development Manager. Please be sure to check your SPAM/JUNK folder too.
Chat With
MaRIA