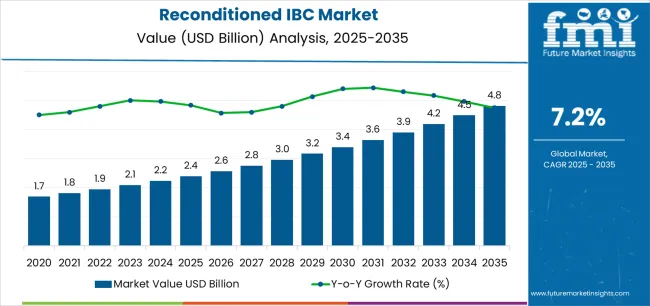
The reconditioned IBC market is valued at USD 2.4 billion in 2025 and is slated to reach USD 4.8 billion by 2035, recording an absolute increase of USD 2.4 billion over the forecast period. This translates into a total growth of 100.0%, with the market forecast to expand at a compound annual growth rate (CAGR) of 7.2% between 2025 and 2035. The overall market size is expected to grow by 2.00X during the same period, supported by increasing demand for cost-effective bulk liquid storage solutions, growing adoption of circular economy principles in industrial packaging, and rising preference for certified reprocessed containers across chemical, food & beverage, and pharmaceutical industries.
Between 2025 and 2030, the reconditioned IBC market is projected to expand from USD 2.4 billion to USD 3.5 billion, resulting in a value increase of USD 1.1 billion, which represents 45.8% of the total forecast growth for the decade. This phase of development will be shaped by increasing industrial focus on packaging cost reduction, rising adoption of UN-certified reconditioning processes, and growing demand for reconditioned containers with verified performance characteristics. Chemical manufacturers and food processors are expanding their reconditioned IBC sourcing capabilities to address the growing demand for economical bulk liquid transport solutions while maintaining quality and safety standards.
From 2030 to 2035, the market is forecast to grow from USD 3.5 billion to USD 4.8 billion, adding another USD 1.3 billion, which constitutes 54.2% of the overall ten-year expansion. This period is expected to be characterized by the expansion of advanced cleaning and inspection technologies, the integration of traceability systems and digital certification platforms, and the development of enhanced reconditioning protocols with improved quality assurance mechanisms. The growing adoption of circular economy principles in industrial operations will drive demand for reconditioned IBCs with documented reconditioning histories and comprehensive performance validation.
Plastic IBCs dominate the market with a 68% share in 2025 due to their ease of reconditioning, widespread availability, compatibility with chemical and food applications, and strong cost-effectiveness compared to steel and composite variants. Their lightweight structure, high chemical resistance after proper cleaning, and suitability for repeated usage cycles make them central to industrial bulk packaging strategies. By application, chemical and petrochemical sectors lead with a 42% share, reflecting their large-scale consumption of bulk liquid containers and consistent shift toward cost-efficient reconditioned alternatives with verified UN certification.
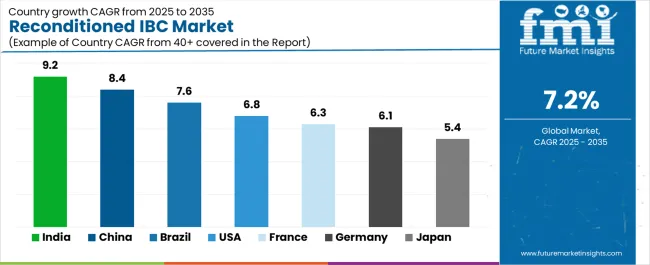
Geographically, the Asia-Pacific region is the fastest-expanding market due to rapid chemical production growth, rising food processing activity, and increasing circular economy adoption. India leads globally with a 9.2% CAGR through 2035, followed by China at 8.4%, supported by expansions in manufacturing capacity and government-backed sustainability initiatives. Developed markets such as the United States (6.8%), Germany (6.1%), and France (6.3%) emphasize high-quality reconditioning standards, digital certification systems, and advanced automation in cleaning to meet regulatory and safety expectations.
| Metric | Value |
|---|---|
| Estimated Value in (2025E) | USD 2.4 billion |
| Forecast Value in (2035F) | USD 4.8 billion |
| Forecast CAGR (2025 to 2035) | 7.2% |
Market expansion is being supported by the increasing global demand for economical bulk liquid packaging solutions and the corresponding need for certified reconditioned containers that can provide cost advantages while maintaining safety standards and enabling reliable performance across various industrial and commercial applications. Modern chemical manufacturers, food processors, and pharmaceutical companies are increasingly focused on implementing packaging solutions that can reduce procurement costs, minimize environmental impact, and provide consistent performance throughout multiple usage cycles. Reconditioned IBCs' proven ability to deliver substantial cost savings, enable resource efficiency, and support circular economy objectives make them essential packaging formats for contemporary industrial operations seeking economic and operational advantages.
The growing emphasis on packaging cost optimization and resource conservation is driving demand for reconditioned IBCs that can support multiple usage cycles, maintain structural integrity, and enable reliable containment performance. Manufacturers' preference for packaging that combines economic advantages with verified quality assurance and regulatory compliance is creating opportunities for professional reconditioning implementations. The rising influence of circular economy principles and industrial cost management is also contributing to increased demand for reconditioned IBCs that can provide documented reconditioning processes, certified performance characteristics, and assured product protection.
The reconditioned IBC market is poised for rapid growth and transformation. As industries across chemicals, food & beverage, pharmaceuticals, agriculture, and industrial manufacturing seek packaging that delivers economic advantages, verified quality, and environmental benefits, reconditioned IBCs are gaining prominence not just as commodity packaging but as strategic enablers of cost optimization and circular economy implementation.
Rising chemical production in Asia-Pacific and expanding food processing markets globally amplify demand, while reconditioning service providers are leveraging innovations in automated cleaning technologies, digital traceability systems, and advanced inspection methodologies.
Pathways like UN-certification services, specialized reconditioning protocols, and application-specific container grading promise strong margin uplift, especially in high-value segments. Geographic expansion and vertical integration will capture volume, particularly where local reconditioning capabilities and supply chain proximity are critical. Regulatory pressures around industrial packaging safety, food contact compliance, pharmaceutical container standards, and circular economy implementation give structural support.
The market is segmented by material type, application, capacity, reconditioning type, end-use industry, and region. By material type, the market is divided into plastic IBCs, steel IBCs, and composite IBCs. By application, it covers chemical & petrochemical, food & beverage, pharmaceutical, agriculture, and others. By capacity, the market is segmented into 500-800 liters, 800-1000 liters, and above 1000 liters. The reconditioning type includes standard cleaning, intensive cleaning, and specialized reconditioning. By end-use industry, it is categorized into chemical manufacturing, food processing, pharmaceutical production, agricultural operations, and others. By distribution channel, the market includes direct sales, reconditioning service providers, and industrial distributors. Regionally, the market is divided into North America, Europe, East Asia, South Asia & Pacific, Latin America, and the Middle East & Africa.
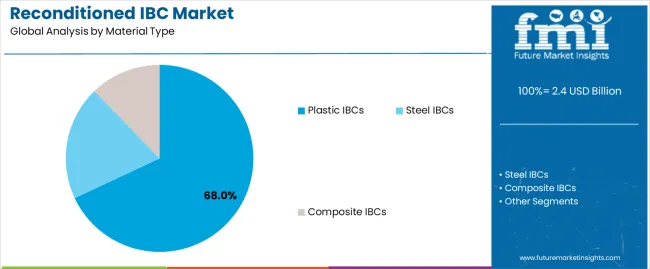
The plastic IBCs segment is projected to account for 68.0% of the reconditioned IBC market in 2025, reaffirming its position as the leading material category. Chemical manufacturers and food processors increasingly utilize reconditioned plastic IBCs for their excellent chemical resistance when properly cleaned and reconditioned, superior cost-effectiveness compared to steel alternatives, and widespread availability in applications ranging from industrial chemicals to food ingredients. Plastic IBC reconditioning technology's established cleaning protocols and consistent quality output directly address the industrial requirements for reliable containment performance in high-volume operations.
This material segment forms the foundation of modern industrial bulk packaging operations, as it represents the container type with the greatest reconditioning feasibility and established market acceptance across multiple application categories and industry sectors. Reconditioning facility investments in automated cleaning technologies and inspection capabilities continue to strengthen adoption among chemical and food industry buyers. With companies prioritizing packaging cost reduction and circular economy objectives, reconditioned plastic IBCs align with both economic requirements and resource efficiency goals, making them the central component of comprehensive bulk packaging strategies.
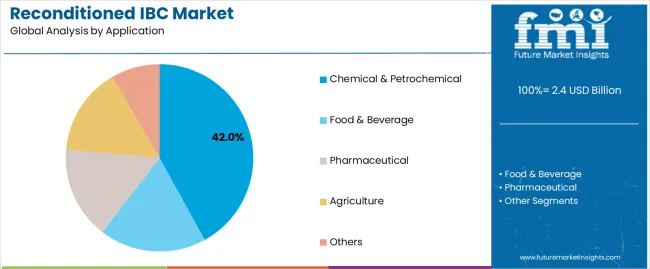
Chemical & petrochemical applications are projected to represent 42.0% of reconditioned IBC demand in 2025, underscoring their critical role as the primary industrial consumers of cost-effective bulk containers for industrial chemicals, solvents, and petrochemical intermediates. Chemical manufacturers prefer reconditioned IBCs for their substantial cost advantages over new containers, adequate performance characteristics when properly reconditioned, and ability to meet containment requirements while reducing packaging expenditures. Positioned as economical packaging alternatives for established industrial operations, reconditioned IBCs offer both financial benefits and operational reliability.
The segment is supported by continuous improvement in reconditioning standards and the growing availability of UN-certified reconditioning processes that enable hazardous material transport with validated container performance and regulatory compliance. Additionally, chemical manufacturers are investing in supplier partnerships to support large-volume reconditioned IBC procurement and quality verification. As chemical production volumes increase and cost management becomes more critical, chemical & petrochemical applications will continue to dominate the end-use market while supporting advanced reconditioning technology utilization and quality assurance strategies.
The reconditioned IBC market is advancing rapidly due to increasing demand for cost-effective bulk packaging solutions and growing adoption of circular economy principles that encourage container reuse while delivering economic advantages across diverse industrial applications. However, the market faces challenges, including quality variability concerns, contamination risk management requirements, and the need for specialized cleaning equipment investments. Innovation in automated reconditioning technologies and digital certification systems continues to influence service development and market expansion patterns.
The growing adoption of robotic cleaning systems, automated pressure washing equipment, and advanced non-destructive testing technologies is enabling reconditioning service providers to deliver consistent cleaning quality, enhanced contamination removal, and verified structural integrity assessment across diverse container types and contamination scenarios. Advanced automated systems provide improved reconditioning efficiency while allowing more reliable quality assurance and consistent output across various customer requirements and application specifications. Service providers are increasingly recognizing the competitive advantages of sophisticated cleaning capabilities for quality differentiation and premium market positioning.
Modern reconditioning facilities are incorporating RFID tracking systems, blockchain-based certification records, and digital inspection documentation to enhance container traceability, enable quality verification, and deliver transparent reconditioning history to industrial customers. These technologies improve supply chain visibility while enabling new service offerings, including container management programs, usage cycle tracking, and predictive maintenance scheduling. Advanced digital integration also allows reconditioning providers to support premium service positioning and customer relationship development beyond traditional container cleaning supply.
| Country | CAGR (2025-2035) |
|---|---|
| India | 9.2% |
| China | 8.4% |
| USA | 6.8% |
| Brazil | 7.6% |
| Germany | 6.1% |
| Japan | 5.4% |
| France | 6.3% |
The reconditioned IBC market is experiencing strong growth globally, with India leading at a 9.2% CAGR through 2035, driven by the expanding chemical manufacturing sector, growing food processing industry, and significant investment in industrial packaging infrastructure. China follows at 8.4%, supported by rapid chemical production growth, increasing circular economy initiatives, and growing domestic reconditioning capabilities.
The USA shows growth at 6.8%, emphasizing chemical industry cost optimization and industrial packaging efficiency. Brazil records 7.6%, focusing on agricultural chemicals expansion and food processing growth. Germany demonstrates 6.1% growth, prioritizing circular economy principles and advanced reconditioning technology adoption. Japan exhibits 5.4% growth, emphasizing quality reconditioning standards and precision cleaning processes. France shows 6.3% growth, supported by chemical industry concentration and industrial resource efficiency initiatives.
The report covers an in-depth analysis of 40+ countries top-performing countries are highlighted below.
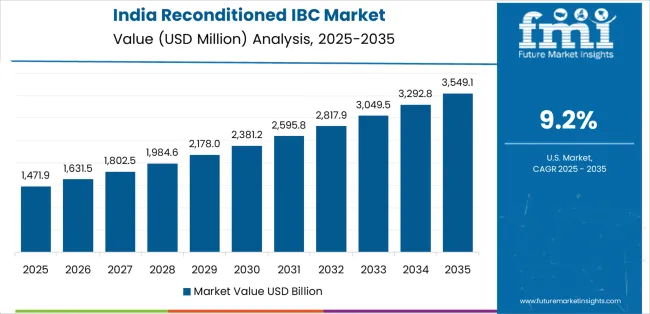
Revenue from reconditioned IBCs in India is projected to exhibit exceptional growth with a CAGR of 9.2% through 2035, driven by expanding chemical manufacturing capacity and rapidly growing industrial production supported by government initiatives promoting domestic manufacturing development. The country's strong position in global chemical production and increasing investment in food processing infrastructure are creating substantial demand for cost-effective IBC solutions. Major chemical companies and food processors are establishing comprehensive reconditioned IBC sourcing capabilities to serve both domestic demand and operational cost reduction objectives.
Revenue from reconditioned IBCs in China is expanding at a CAGR of 8.4%, supported by the country's growing chemical production sector, expanding circular economy policies, and increasing adoption of resource-efficient packaging solutions. The country's government initiatives promoting waste reduction and growing industrial cost consciousness are driving requirements for professional reconditioning capabilities. International reconditioning companies and domestic service providers are establishing extensive processing and distribution capabilities to address the growing demand for reconditioned IBC products.
Revenue from reconditioned IBCs in the USA is expanding at a CAGR of 6.8%, supported by the country's advanced chemical manufacturing sector, strong emphasis on quality reconditioning standards, and robust demand for cost-effective bulk packaging in chemical and food processing applications. The nation's mature reconditioning infrastructure and established certification frameworks are driving sophisticated reconditioning capabilities throughout the supply chain. Leading reconditioning service providers and technology suppliers are investing extensively in automated cleaning technologies and inspection systems to serve both domestic and export markets.
Revenue from reconditioned IBCs in Brazil is growing at a CAGR of 7.6%, driven by the country's vibrant agricultural chemicals industry, expanding food processing sector, and growing investment in industrial packaging efficiency. Brazil's strong agricultural economy and commitment to cost-effective operations are supporting demand for reconditioned IBC solutions across multiple industrial segments. Reconditioning facilities are establishing comprehensive processing capabilities to serve the large domestic market and growing regional industrial base.
Revenue from reconditioned IBCs in Germany is expanding at a CAGR of 6.1%, supported by the country's chemical industry leadership, advanced reconditioning capabilities, and strategic focus on circular economy implementation. Germany's engineering excellence and environmental commitment are driving demand for reconditioned IBCs in industrial chemicals, food ingredients, and pharmaceutical excipients. Reconditioning facilities are investing in comprehensive quality management capabilities to serve both domestic industrial producers and international specialty markets.
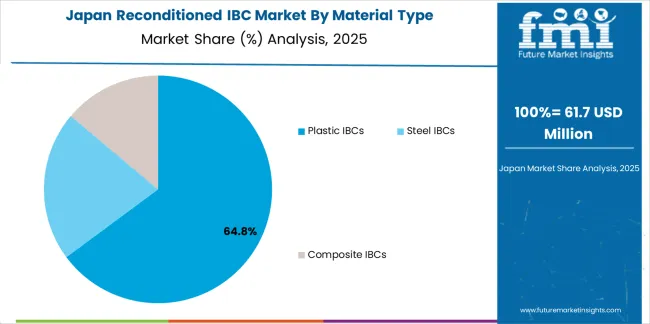
Revenue from reconditioned IBCs in Japan is growing at a CAGR of 5.4%, driven by the country's expertise in precision cleaning processes, emphasis on quality control, and strong position in industrial packaging management. Japan's established reconditioning technology capabilities and commitment to continuous improvement are supporting investment in advanced processing technologies throughout major industrial centers. Industry leaders are establishing comprehensive quality assurance systems to serve domestic chemical producers and food manufacturers.
Revenue from reconditioned IBCs in France is expanding at a CAGR of 6.3%, supported by the country's chemical manufacturing concentration, growing food processing operations, and strategic position in European industrial supply chains. France's diversified industrial base and integrated reconditioning ecosystem are driving demand for cost-effective reconditioned IBCs in chemical intermediates, food ingredients, and specialty industrial applications. Leading reconditioning facilities are investing in specialized capabilities to serve the stringent requirements of chemical and food industries.
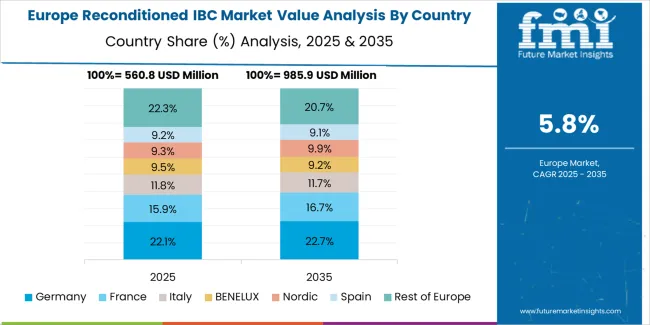
The reconditioned IBC market in Europe is projected to grow from USD 720 million in 2025 to USD 1.5 billion by 2035, registering a CAGR of 7.5% over the forecast period. Germany is expected to maintain its leadership position with a 32.0% market share in 2025, declining slightly to 31.5% by 2035, supported by its strong chemical industry, advanced reconditioning infrastructure, and comprehensive circular economy initiatives serving diverse reconditioned IBC applications across Europe.
France follows with a 19.0% share in 2025, projected to reach 19.5% by 2035, driven by robust demand for reconditioned IBCs in chemical manufacturing, food processing, and agricultural chemicals, combined with established reconditioning capabilities and industrial cost optimization focus. The United Kingdom holds a 15.0% share in 2025, expected to maintain 15.0% through 2035, supported by strong chemical manufacturing and growing circular economy adoption. Italy commands a 12.0% share in 2025, projected to reach 12.3% by 2035, while Spain accounts for 8.0% in 2025, expected to reach 8.2% by 2035.
The Netherlands maintains a 5.5% share in 2025, growing to 5.8% by 2035. The Rest of Europe region, including Nordic countries, Eastern Europe, Belgium, Switzerland, Austria, and Poland, is anticipated to gain momentum, expanding its collective share from 8.5% to 7.7% by 2035, attributed to increasing chemical manufacturing in Eastern Europe and growing reconditioning facility development in Nordic countries implementing circular economy programs.
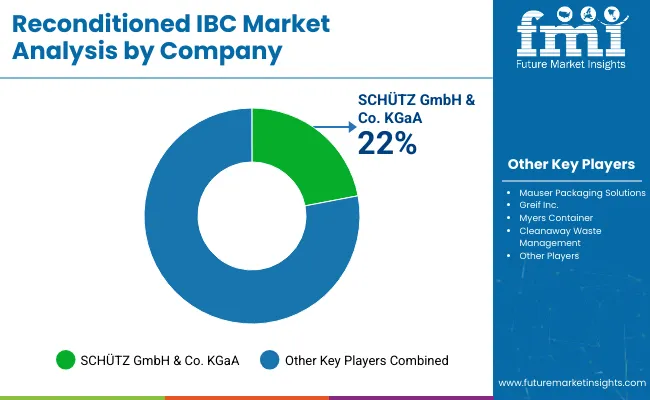
The reconditioned IBC market features 10–15 players with moderate concentration, where the top three companies collectively hold around 46–52% of global market share, driven by large-scale reconditioning networks, strong collection systems, and long-term partnerships with chemical, petrochemical, food, and pharmaceutical manufacturers. The leading company, Mauser Packaging Solutions, commands 8% market share, supported by its extensive reconditioning and recycling facilities across North America, Europe, and Asia. Competition centers on cleaning efficiency, container integrity, regulatory compliance (UN/DOT), and sustainability performance rather than price alone.
Market leaders such as Mauser Packaging Solutions, Greif Inc., and Schütz Container Systems maintain dominant positions with integrated “recollect, recondition, reuse” service models, rigid quality assurance processes, and the ability to provide certified, tested IBCs that meet global standards for hazardous and non-hazardous liquids. Their competitive strengths include automated cleaning lines, leak-proof testing, and strong logistics capabilities.
Challenger companies including BWAY Corporation, Snyder Industries, and Hoyer Group focus on region-specific reconditioning services, offering tailored solutions for chemical distributors, lubricant manufacturers, and food processors seeking cost-efficient, sustainable packaging.
Additional competitive pressure comes from Berry Global Inc., Time Technoplast Limited, Brambles Limited (CHEP), and CurTec Holdings BV, which strengthen their market presence through localized reconditioning operations, reusable packaging pools, and specialized high-purity IBC solutions for sensitive applications.
| Items | Values |
|---|---|
| Quantitative Units (2025) | USD 2.4 billion |
| Material Type | Plastic IBCs, Steel IBCs, Composite IBCs |
| Application | Chemical & Petrochemical, Food & Beverage, Pharmaceutical, Agriculture, Others |
| Capacity | 500-800 Liters, 800-1000 Liters, Above 1000 Liters |
| Reconditioning Type | Standard Cleaning, Intensive Cleaning, Specialized Reconditioning |
| End-Use Industry | Chemical Manufacturing, Food Processing, Pharmaceutical Production, Agricultural Operations, Others |
| Distribution Channel | Direct Sales, Reconditioning Service Providers, Industrial Distributors |
| Regions Covered | North America, Europe, East Asia, South Asia & Pacific, Latin America, Middle East & Africa |
| Countries Covered | United States, Canada, United Kingdom, Germany, France, China, Japan, South Korea, India, Brazil, Australia and 40+ countries |
| Key Companies Profiled | Mauser Packaging Solutions, Greif Inc., Schütz Container Systems, BWAY Corporation, Snyder Industries, Hoyer Group, Berry Global Inc., Time Technoplast Limited, Brambles Limited (CHEP), and CurTec Holdings BV |
| Additional Attributes | Dollar sales by material type and application category, regional demand trends, competitive landscape, technological advancements in cleaning systems, inspection technology development, certification program evolution, and supply chain integration |
The global reconditioned ibc market is estimated to be valued at USD 2.4 billion in 2025.
The market size for the reconditioned ibc market is projected to reach USD 4.8 billion by 2035.
The reconditioned ibc market is expected to grow at a 7.2% CAGR between 2025 and 2035.
The key product types in reconditioned ibc market are plastic ibcs, steel ibcs and composite ibcs.
In terms of application, chemical & petrochemical segment to command 42.0% share in the reconditioned ibc market in 2025.


Our Research Products

The "Full Research Suite" delivers actionable market intel, deep dives on markets or technologies, so clients act faster, cut risk, and unlock growth.

The Leaderboard benchmarks and ranks top vendors, classifying them as Established Leaders, Leading Challengers, or Disruptors & Challengers.

Locates where complements amplify value and substitutes erode it, forecasting net impact by horizon

We deliver granular, decision-grade intel: market sizing, 5-year forecasts, pricing, adoption, usage, revenue, and operational KPIs—plus competitor tracking, regulation, and value chains—across 60 countries broadly.

Spot the shifts before they hit your P&L. We track inflection points, adoption curves, pricing moves, and ecosystem plays to show where demand is heading, why it is changing, and what to do next across high-growth markets and disruptive tech

Real-time reads of user behavior. We track shifting priorities, perceptions of today’s and next-gen services, and provider experience, then pace how fast tech moves from trial to adoption, blending buyer, consumer, and channel inputs with social signals (#WhySwitch, #UX).

Partner with our analyst team to build a custom report designed around your business priorities. From analysing market trends to assessing competitors or crafting bespoke datasets, we tailor insights to your needs.
Supplier Intelligence
Discovery & Profiling
Capacity & Footprint
Performance & Risk
Compliance & Governance
Commercial Readiness
Who Supplies Whom
Scorecards & Shortlists
Playbooks & Docs
Category Intelligence
Definition & Scope
Demand & Use Cases
Cost Drivers
Market Structure
Supply Chain Map
Trade & Policy
Operating Norms
Deliverables
Buyer Intelligence
Account Basics
Spend & Scope
Procurement Model
Vendor Requirements
Terms & Policies
Entry Strategy
Pain Points & Triggers
Outputs
Pricing Analysis
Benchmarks
Trends
Should-Cost
Indexation
Landed Cost
Commercial Terms
Deliverables
Brand Analysis
Positioning & Value Prop
Share & Presence
Customer Evidence
Go-to-Market
Digital & Reputation
Compliance & Trust
KPIs & Gaps
Outputs
Full Research Suite comprises of:
Market outlook & trends analysis
Interviews & case studies
Strategic recommendations
Vendor profiles & capabilities analysis
5-year forecasts
8 regions and 60+ country-level data splits
Market segment data splits
12 months of continuous data updates
DELIVERED AS:
PDF EXCEL ONLINE
Competitive Landscape of Reconditioned IBC Providers
Reconditioned Steel Drum Market Size and Share Forecast Outlook 2025 to 2035
IBC Rental Business Market Size and Share Forecast Outlook 2025 to 2035
IBC Liner Market Size and Share Forecast Outlook 2025 to 2035
Breakdown for IBC Rental Business Market: Trends, Players, and Innovations
IBC Liner Market Share Insights & Industry Leaders
Industry Share Analysis for Reconditioned Steel Drum Providers
IBC Caps Market
Reconditioned Drums Market
Reconditioned Packaging Market
FIBC Market Size and Share Forecast Outlook 2025 to 2035
FIBC Industry Analysis in Japan Size and Share Forecast Outlook 2025 to 2035
Market Share Distribution Among FIBC (Flexible Intermediate Bulk Container) Manufacturers
Metal IBC Market Forecast and Outlook 2025 to 2035
Rigid IBC Market Size and Share Forecast Outlook 2025 to 2035
Competitive Overview of Rigid IBC Market Share
Aseptic IBC Market Size and Share Forecast Outlook 2025 to 2035
Folding IBC Market Size and Share Forecast Outlook 2025 to 2035
2 Loop FIBC Bags Market Size and Share Forecast Outlook 2025 to 2035
4-Loop FIBC Market Growth - Size, Demand & Forecast 2025 to 2035

Thank you!
You will receive an email from our Business Development Manager. Please be sure to check your SPAM/JUNK folder too.
Chat With
MaRIA