The Aseptic IBC market is witnessing significant growth driven by the increasing demand for safe and contamination-free bulk packaging solutions across the pharmaceutical, food and beverage, and chemical industries. The future outlook of the market is shaped by stringent regulatory requirements for hygiene and quality, particularly in the pharmaceutical sector, which mandates the use of aseptic containers for storage and transportation of sensitive liquids. Rising awareness regarding product safety and shelf-life preservation has further fueled the adoption of aseptic IBCs.
Advancements in container technology, including enhanced sealing mechanisms, chemical resistance, and compatibility with automated filling systems, have improved operational efficiency and reduced risks of contamination. The transition from traditional drums and barrels to bulk containers has also contributed to market expansion, providing cost-effective and scalable packaging solutions.
Additionally, the growing preference for sustainable and reusable packaging options is supporting the adoption of high-quality aseptic IBCs As global pharmaceutical production and distribution continue to expand, the demand for aseptic IBCs is expected to maintain a strong upward trajectory.

| Metric | Value |
|---|---|
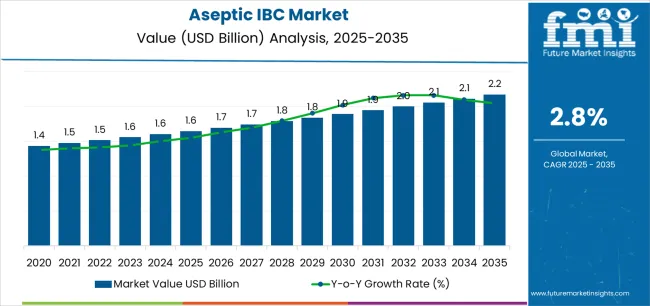
| Aseptic IBC Market Estimated Value in (2025E) | USD 1.6 billion |
| Aseptic IBC Market Forecast Value in (2035F) | USD 2.2 billion |
| Forecast CAGR (2025 to 2035) | 2.8% |
The market is segmented by Product Type, Capacity, and End Use and region. By Product Type, the market is divided into Plastic IBC, Metal IBC, Composite IBC, and Paper IBC. In terms of Capacity, the market is classified into 500 To 1000 Litres, Upto 500 Litres, and Above 1000 Litres. Based on End Use, the market is segmented into Pharmaceuticals, Food & Beverages, Cosmetic & Personal Care, and Chemicals. Regionally, the market is classified into North America, Latin America, Western Europe, Eastern Europe, Balkan & Baltic Countries, Russia & Belarus, Central Asia, East Asia, South Asia & Pacific, and the Middle East & Africa.

The plastic IBC segment is projected to hold 33.60% of the market revenue share in 2025, establishing it as the leading product type. This dominance is primarily attributed to the lightweight, durable, and chemically resistant nature of plastic containers, which allows for safe handling and transport of sensitive liquids.
The ability of plastic IBCs to integrate with automated filling and dispensing systems has improved operational efficiency in high-volume manufacturing environments. Their cost-effectiveness compared to metal alternatives and flexibility in storage and stacking also contribute to widespread adoption.
Additionally, plastic IBCs provide compatibility with multiple sterilization techniques, ensuring compliance with stringent hygiene standards, particularly in the pharmaceutical sector The segment’s growth is further supported by increasing demand for scalable packaging solutions that maintain product integrity while optimizing logistics and storage efficiency.

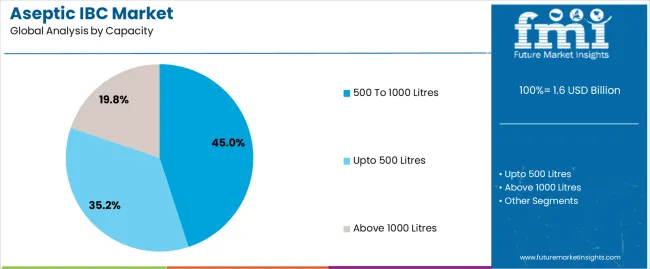
The 500 to 1000 litres capacity segment is expected to account for 45.00% of the market revenue share in 2025, positioning it as the preferred capacity range. The growth of this segment is driven by the balance it offers between storage efficiency and operational manageability, making it suitable for medium to large-scale production and distribution processes.
Containers within this capacity range allow for effective handling during transportation while minimizing the risk of contamination or spillage. The widespread adoption of semi-automated and fully automated filling lines has further reinforced the use of this capacity, as it aligns with standardized production volumes in pharmaceutical and food industries.
Additionally, the versatility of this capacity range allows companies to optimize storage space and reduce logistics costs, driving its prominence in the aseptic IBC market.

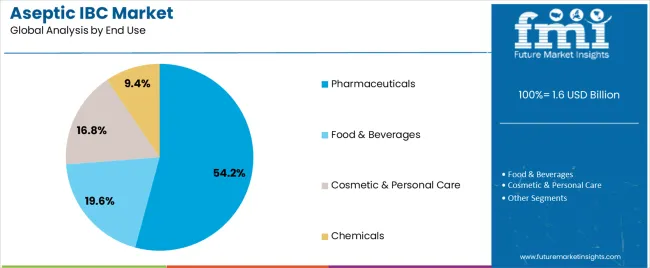
The pharmaceuticals end-use industry is anticipated to account for 54.20% of the market revenue in 2025, establishing it as the leading end-use segment. The growth of this segment is largely influenced by the stringent regulatory requirements for sterility and contamination-free handling of bulk liquids in pharmaceutical manufacturing.
Aseptic IBCs provide secure, tamper-evident storage and transport solutions that maintain the integrity of sensitive drugs, vaccines, and biologics. Increasing global pharmaceutical production and distribution, coupled with rising investments in biologics and sterile formulations, have accelerated the adoption of aseptic IBCs.
Furthermore, the focus on product safety, shelf-life extension, and compliance with international standards has reinforced the reliance on these containers The integration of aseptic IBCs into automated filling and monitoring systems has further enhanced operational efficiency, making them a preferred solution across pharmaceutical facilities worldwide.
Based on several semi-annual periods, the subsequent table projects a CAGR for the demand for aseptic intermediate bulk containers from 2025 to 2035. A lean regeneration is projected to propel the industry's growth, with a CAGR of 2.6% in the first half (H1) and 2.9% in the second half (H2) of the referenced decade.
| Particular | Value CAGR |
|---|---|
| H1 | 2.6% (2025 to 2035) |
| H2 | 2.9% (2025 to 2035) |
| H1 | 2.5% (2025 to 2035) |
| H2 | 2.7% (2025 to 2035) |
Over the succeeding decade, the growth trajectory of the aseptic IBC industry is anticipated to modify marginally. It is predicted that in the first half (H1) of the term, the CAGR will decline fairly from 2.9% to 2.5%. After that, a slight revival is expected to occur in the second half (H2) at a CAGR of 2.7%.
This industry trend predicts that the CAGR is scheduled to rise by 20 basis points in H2 and improve by 30 basis points in H1. A variety of factors, including the requirement for shipping containers to have historical packing in H1, which may have impacted demand, are attributed by industry analysts as the causes of the change. However, changes to the H2 sector or advancements in sterile IBC may stimulate sales in the projected period.
Ensuring Product Integrity and Shelf Life in Several Industries
The aseptic IBC market has grown significantly in recent years due to its paramount role in maintaining product quality, safety, and longevity across various industries. These sterile containers are essential for transporting and storing liquid food products, as well as pharmaceutical companies handling sensitive drug formulations and active ingredients, ensuring consistent cell growth and reliable experimental results.
Lotions, creams, and other liquid formulations are packaged in aseptic intermediate bulk containers in the cosmetics sector to avoid contamination and preserve product efficacy. Aseptic packaging enhances purity and exclusivity when luxury skincare businesses utilize it to deliver premium serums containing delicate plant extracts.
Additionally extending the shelf life of perishables, aseptic intermediate bulk containers minimize food waste and spoilage. They guarantee the stability of the product by withstanding changes in temperature and UV light. For instance, a multinational dairy corporation stores milk at extremely high temperatures using intermediate bulk containers, which improves distribution effectiveness and uses less energy.
Due to its vital role in upholding product integrity, adhering to hygiene regulations, and fulfilling sustainability goals, the aseptic IBC market is still growing today.
Specialized Refinements and Automation in Supply Chain Operation Blooms the Revenue
The combination of IoT, RFID, and automation is transforming the aseptic intermediate bulk container (IBC) trade, improving supply chain visibility, and operating efficiency. The Internet of Things (IoT) has made it feasible to create smart IBCs with real-time data-collecting features, such as temperature sensors for tracking perishable commodities during storage and transit. RFID technology allows for accurate tracking of aseptic IBCs, enhancing quality control and lowering losses across the supply chain.
IBC handling is made easier by automated technologies, which also lower the danger of contamination and labor-intensive tasks. Aseptic intermediate bulk containers may be effectively loaded and unloaded by robotic arms, speeding up production without sacrificing cleanliness.
Smart IBCs assures adherence to safety regulations by offering real-time insights into product status. Sensitive chemicals are transported by international logistics firms using IBCs fitted with sensors, which allow them to detect and handle irregularities in real-time. The aseptic IBC market is changing because of the convergence of IoT, RFID, and automation. This also improves product safety, lowers waste, and gives businesses more information to use when making choices along the supply chain.
Expensive Manufacturing of Hygienic Packaging Is Likely To Impede the Demand
Aseptic IBC production requires specialized materials and processes for sterility, leading to higher manufacturing costs. Manufacturers invest in quality control measures, aseptic filling technology, and sterile packaging materials, making the cost higher compared to conventional containers.
Aseptic packaging solutions, while popular in developed markets, are underutilized in emerging regions due to infrastructure voids, lack of awareness, and inadequate distribution networks, posing challenges for companies in these regions in sourcing reliable packaging options.
Manufacturers in Asia Pacific and Latin America may be hesitant to transition to aseptic intermediate bulk containers due to operational adjustments, capital investments, and consumer acceptance uncertainties, potentially hindering market growth.
The aseptic IBC market holds promise, but companies must balance cost-effectiveness with quality to encourage wider adoption and overcome regional disparities for sustained growth.
The rise of the sector is being fueled by variables such as the rising population and disposable income, the demand for more sanitary packaging options, improvements in aseptic intermediate bulk containers, and consumer knowledge of how packaging affects the lifespan of products.
Between 2020 and 2025, the demand is foreseen to fluctuate at a CAGR of 2.3%, reaching a total of USD 1.6 billion in 2025.
The longevity, affordability, and resistance to spills, bacteria, and other degrading agents of sterile IBCs have made them more popular in a variety of sectors. The containers are an affordable and dependable option since they have established themselves as standard packaging solutions for the transportation and storage of bulk materials.
A significant USD 1.6 billion additional potential is projected to arise from the aseptic IBC market, which is predicted to boom at a CAGR of 3.2% between 2025 and 2035.
A wide variety of delicate items, such as alcohol, fruit concentrates, medications, paints, colors, animal oils, and food additives, are being transported more and more often using aseptic intermediate bulk containers.
The sales prospects of aseptic intermediate bulk containers are being enhanced by the worldwide expansion of the import and export industry, and the trend is anticipated to persist in the forthcoming decade.
Growing consumer awareness of aseptic IBC's eco-friendliness and the need for sophisticated logistics and transportation infrastructure in emerging nations such as China and India are projected to fuel the aseptic IBC market's expansion.
In the packaging sector, tier 1 companies comprised Sealed Air Corporation and International Paper Company are industry leaders renowned for their significant market presence and wide recognition. International Paper Company excels in sustainable sterile packaging solutions with a transnational footprint, while Sealed Air Corporation specializes in high-quality sanitized packaging products, catering to diverse sectors with innovative and reliable offerings.
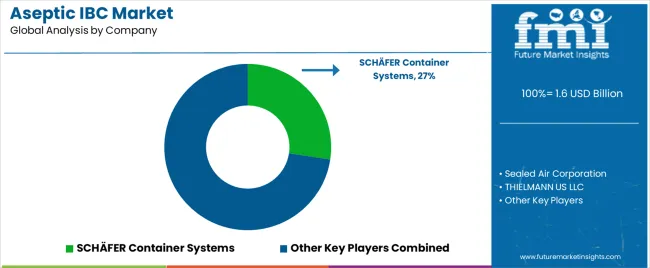
Tier 2 companies in the packaging sector, such as THIELMANN US LLC, HOYER GmbH, SCHÄFER Container Systems, and CDF Corporation, are gaining significance through innovation, customization, and competitive pricing. The firms are leveraging advanced technologies and sustainable practices to meet evolving consumer demands. The firm regional presence and commitment to quality enable them to effectively compete with larger firms, intensifying their influence and revenue share.
By providing specialized and custom packaging solutions, Tier 3 packaging firms such as RULAND Engineering & Consulting GmbH, Black Forest Container Systems, LLC, and TPS Rental Systems Ltd are specializing in certain features of the industry. To set themselves apart, they emphasize innovative design, adaptability, and individualized customer service. They are gradually developing a devoted clientele and gaining traction by serving the demands of particular industries and smaller-scale businesses.
The subsequent section contains the industry analysis for the aseptic IBC market in each of the many nations. With a predicted 2.6% CAGR until 2035, Spain is going to persist to be the dominant sector in Europe. India is predicted to report a CAGR of 5.6% in the Asia Pacific region by 2035, while China's shipping trade is envisioned to exhibit a CAGR of 4.9%. The Asia Pacific region's improvements in shipping trades is desired to rise in the future, according to forecasts.
| Countries | Value CAGR (2025 to 2035) |
|---|---|
| United States | 1.8% |
| Canada | 1.3% |
| France | 2.1% |
| Spain | 2.6% |
| India | 5.6% |
| China | 4.9% |
Through creative joint ventures and collaborations, Spain's aseptic IBC trade firms are forging strategic alliances to broaden their product lines, get access to cutting-edge technology and new markets, encourage innovation, and accelerate growth. The demand is anticipated to register a CAGR of 2.6% from 2025 to 2035.
Working together enables businesses to combine resources, exchange knowledge, and expedite research and development, resulting in aseptic intermediate bulk containers that are more sophisticated and reasonably priced.
Prominent technology businesses and packaging companies have collaborated to create intermediate bulk containers (IBCs) that can be monitored in real-time, guaranteeing both industry compliance and product quality.
To meet the growing need for aseptic packaging solutions in developing countries like Asia-Pacific and Latin America, firms in Spain are utilizing partnerships to extend their reach. Their competitiveness is increased by this strategic approach, which also promotes the use of creative and environmentally friendly packaging solutions.
The fast expansion of end-use sectors like chemicals and food & beverage is driving up demand for aseptic intermediate bulk containers throughout China. By 2035, the demand for sterile packaging for chemicals in China is anticipated to record a CAGR of 4.9%.
China, the world's largest chemical exporter, needs cutting-edge packaging solutions that ensure the secure and hygienic transportation of valuable goods. Aseptic IBCs are the perfect answer since they offer the best defense against contamination and maintain the integrity of the contents.
IBC adoption is accelerated by the need for dependable packaging that satisfies global standards due to the increase in import and export activity. Preferred for bulk storage and transit, these cutting-edge packaging options are widely used because of their efficacy and affordability. To enhance their standing in the international market and encourage long-term expansion, Chinese producers are devoting resources to the creation of inventive aseptic IBCs.
Given to the substantial exports of food and beverage items and its important position as a major pharmaceutical producer, India now holds the largest market share in the Asia-Pacific region for aseptic intermediate bulk containers. The need for durable packaging is projected to nurture a CAGR of 5.6% through 2035.
Aseptic IBCs are being used by manufacturers and logistics businesses in India to safeguard and advance the shelf life of products, ensuring the safety and quality of perishable and sensitive items. Because of their sophisticated design, which guards against contamination, they are perfect for carrying expensive foods, drinks, and medications. The robust export industry in India is fueling such a trend by requiring dependable packaging solutions.
Companies like CDF Corporation and local innovators are responding to this demand by offering cutting-edge aseptic intermediate bulk containers tailored to the needs of Indian industries. The aseptic IBC sector in India is experiencing substantial growth, reinforcing the country's leadership in packaging innovation and export capabilities.
Details on the top industrial categories are provided in the section that follows. According to estimates, the format for plastic IBCs is predicted to generate 33.6% of the total revenue in 2025. Manufacturers are foreseen for end use of pharmaceutical packing in 2025, accounting for 54.2% of the market.
| Product Type | Plastic IBC |
|---|---|
| Value Share (2025) | 33.6% |
In 2025, the plastic IBC section is anticipated to generate 33.6% of total revenue, based on the product type. Because they provide economical, long-lasting, and ecologically responsible packaging options, plastic rigid IBCs are becoming more and more popular across a range of sectors. These packaging options save shipping costs and increase efficiency by storing hazardous goods according to safety regulations. The need for plastic rigid IBC is being compelled by the food and beverage industry, e-commerce, and chemical industrial sectors.
Global plastic rigid IBC market trends are impacted by factors such as urbanization, growing infrastructure development, and improved packaging solutions. The food and beverage industry is also emphasizing bulk food storage for transportation, along with boosting safety, hygiene, and cleanliness standards. Plastic rigid IBCs are in high demand due to e-commerce and retail, but material design innovations are also improving performance and durability.
| End Use | Pharmaceuticals |
|---|---|
| Value Share (2025) | 54.2% |
Aseptic IBCs are essential in the pharmaceutical industry, as they adhere to strict sterility requirements to prevent microbial contamination during storage, transportation, and dispensing of pharmaceutical liquids. The market share of the pharmaceutical sector is anticipated to acquire 54.2% in 2025. Biopharmaceutical companies for vaccine production, ensuring the integrity of critical vaccines, use hygienic containers.
Compliance with safety standards minimizes the risk of product recalls, reducing the likelihood of contamination-related recalls. Aseptic IBCs are part of a traceable supply chain, with each container documented for stakeholders to track its journey and compliance status. International bodies like the FDA, EMA, and WHO harmonize guidelines to ensure consistent safety practices, facilitating cross-border trade. Aseptic IBCs serve as guardians of product quality, aligning with the industry's commitment to regulatory excellence.

The global shipping trade industry is filled with a multitude of companies, all contending for international prominence. These companies have a vast market reach and a very well-established network of suppliers, customers, and trade partners. The Aseptic IBC market is a competitive and fragmented sector, with considerable domestic and regional players. Companies are utilizing strategies like geographic expansion, mergers and acquisitions, partnerships, and collaborations to develop their demand reach and strengthen their positions.
Top players are focusing on developing innovative products to enhance their industry presence and cater to evolving consumer preferences. The strategies aim to differentiate them from competitors and augment their product portfolios. As these initiatives gain traction, competition in the industry is envisioned to intensify, navigating continuous improvements in packaging designs, materials, and functionalities to meet diverse market demands. The augmenting research and development in the shipping sector is anticipated to boost the improvements in the forthcoming decade.
Recent Industry Developments in Aseptic IBC Market
Based on the product types, the industry is divided into plastic IBC, paper IBC, metal IBC, and composite IBC.
In terms of capacity, the industry is segregated as up to 500 litres, 500 to 1000 litres, and above 1000 litres.
Based on the end use of the containers, the demand is categorized into pharmaceuticals, food and beverages, cosmetic and personal care, and chemicals.
Key countries of North America, Latin America, Europe, East Asia, South Asia & Pacific, Middle East and Africa (MEA) have been covered in the report.
The global aseptic ibc market is estimated to be valued at USD 1.6 billion in 2025.
The market size for the aseptic ibc market is projected to reach USD 2.2 billion by 2035.
The aseptic ibc market is expected to grow at a 2.8% CAGR between 2025 and 2035.
The key product types in aseptic ibc market are plastic ibc, metal ibc, composite ibc and paper ibc.
In terms of capacity, 500 to 1000 litres segment to command 45.0% share in the aseptic ibc market in 2025.


Our Research Products

The "Full Research Suite" delivers actionable market intel, deep dives on markets or technologies, so clients act faster, cut risk, and unlock growth.

The Leaderboard benchmarks and ranks top vendors, classifying them as Established Leaders, Leading Challengers, or Disruptors & Challengers.

Locates where complements amplify value and substitutes erode it, forecasting net impact by horizon

We deliver granular, decision-grade intel: market sizing, 5-year forecasts, pricing, adoption, usage, revenue, and operational KPIs—plus competitor tracking, regulation, and value chains—across 60 countries broadly.

Spot the shifts before they hit your P&L. We track inflection points, adoption curves, pricing moves, and ecosystem plays to show where demand is heading, why it is changing, and what to do next across high-growth markets and disruptive tech

Real-time reads of user behavior. We track shifting priorities, perceptions of today’s and next-gen services, and provider experience, then pace how fast tech moves from trial to adoption, blending buyer, consumer, and channel inputs with social signals (#WhySwitch, #UX).

Partner with our analyst team to build a custom report designed around your business priorities. From analysing market trends to assessing competitors or crafting bespoke datasets, we tailor insights to your needs.
Supplier Intelligence
Discovery & Profiling
Capacity & Footprint
Performance & Risk
Compliance & Governance
Commercial Readiness
Who Supplies Whom
Scorecards & Shortlists
Playbooks & Docs
Category Intelligence
Definition & Scope
Demand & Use Cases
Cost Drivers
Market Structure
Supply Chain Map
Trade & Policy
Operating Norms
Deliverables
Buyer Intelligence
Account Basics
Spend & Scope
Procurement Model
Vendor Requirements
Terms & Policies
Entry Strategy
Pain Points & Triggers
Outputs
Pricing Analysis
Benchmarks
Trends
Should-Cost
Indexation
Landed Cost
Commercial Terms
Deliverables
Brand Analysis
Positioning & Value Prop
Share & Presence
Customer Evidence
Go-to-Market
Digital & Reputation
Compliance & Trust
KPIs & Gaps
Outputs
Full Research Suite comprises of:
Market outlook & trends analysis
Interviews & case studies
Strategic recommendations
Vendor profiles & capabilities analysis
5-year forecasts
8 regions and 60+ country-level data splits
Market segment data splits
12 months of continuous data updates
DELIVERED AS:
PDF EXCEL ONLINE
Aseptic Packaging Paperboard Market Size and Share Forecast Outlook 2025 to 2035
Aseptic Liquid Packaging Boards Market Size and Share Forecast Outlook 2025 to 2035
IBC Rental Business Market Size and Share Forecast Outlook 2025 to 2035
IBC Liner Market Size and Share Forecast Outlook 2025 to 2035
Aseptic Formulation Processing Market Size and Share Forecast Outlook 2025 to 2035
Aseptic Containment Systems Market Size and Share Forecast Outlook 2025 to 2035
Aseptic Packaging Market Size and Share Forecast Outlook 2025 to 2035
Aseptic Processing Market Growth - Trends & Forecast 2025 to 2035
Aseptic Packaging Equipment Market Trends - Growth & Forecast 2025 to 2035
Aseptic Fillers Market Growth - Trends & Forecast 2025 to 2035
Breakdown for IBC Rental Business Market: Trends, Players, and Innovations
IBC Liner Market Share Insights & Industry Leaders
Market Share Insights of Leading Aseptic Carton Providers
Aseptic Paper for Packaging Market from 2023 to 2033
IBC Caps Market
FIBC Market Size and Share Forecast Outlook 2025 to 2035
FIBC Industry Analysis in Japan Size and Share Forecast Outlook 2025 to 2035
Market Share Distribution Among FIBC (Flexible Intermediate Bulk Container) Manufacturers
Metal IBC Market Forecast and Outlook 2025 to 2035
Rigid IBC Market Size and Share Forecast Outlook 2025 to 2035

Thank you!
You will receive an email from our Business Development Manager. Please be sure to check your SPAM/JUNK folder too.
Chat With
MaRIA