IBC Rental Business Market
Market Insights on IBC Rental Business covering sales outlook, demand forecast & up-to-date key trends
IBC Rental Business Market By Material (Carbon Steel, Stainless Steel, Plastic), Product (Flexitanks, Stainless Steel IBC, Carbon Steel IBC,Plastic IBC), Content (Liquids, Solids & Semi-solids) & Region - Forecast to 2022 - 2029
IBC Rental Business Market Snapshot
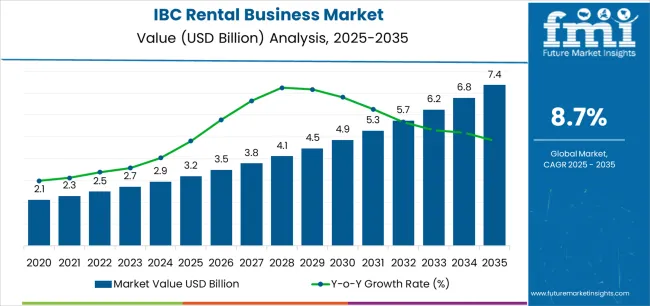
[246 Pages Report] The IBC rental business market is estimated at US$ ~1,218.0 Mn in 2022 and is projected to reach US$ ~1,790.0 Mn by 2029, at a CAGR of 5.7% from 2022 to 2029.
Market Size 2022 |
US$ 1,218.0 Mn |
Market Size 2029 |
US$ 1,790.0 Mn |
Value CAGR (2022-2029) |
5.7% |
Collective Value Share: Top 3 Countries (2022E) |
29.4% |
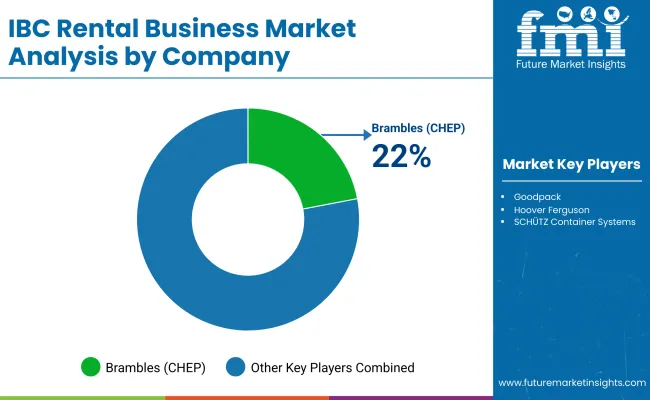
The IBC rental business market revenue totaled US$ ~1,218.0 Mn for 2022, according to FMI. The overall IBC rental business market is expected to expand 1.6x times the current market value by the end of 2029. The demand for IBC rental business will increase with the top 5 providers holding 45-50% of the IBC rental business market in 2022.
The IBC rental business market experienced soaring growth in 2022 with worldwide revenues up 5.4% year over year. A new forecast by FMI estimates that IBC rental business will increase between 2022 and 2029 along with creating an incremental opportunity of US$ ~635 Mn during 2022-2029
Attributing to the competitive chemical industry and its rising industrial output in Europe and North America, these prominent regions are anticipated to hold around 60% portion of the market share by the end of 2022.
Let us know your requirement to get
100% FREE customization
How The Market Progressed Till June 2022?
Particulars |
Details |
H1 2021 |
5.4% |
H1 2022 Projected |
5.6% |
H1 2022 Expected |
6.0% |
BPS Change - H1, 2022 (O) – H1, 2022 (P) |
(+) 40 ↑ |
BPS Change – H1, 2022 (O) – H1, 2021 |
(+) 60 ↑ |
Future Market Insights predict a comparison and review analysis for the dynamics of the IBC rental market, which is principally subjected to an array of industry factors along with a few definite influences concerning increase in the price variance of raw materials and rise in the cost for R&D.
Some new advances that have taken place in the market include the use of tracking systems in IBCs to maintain accountability. In Jan 2022, HOYER Group invested in safety equipment for heavy goods road transport which will indirectly benefit the IBC rental market.
The market for IBC rental is expected to rise by 60 basis share points (BPS) in H1-2022 (O) against comparison with H1-2021, according to an FMI analysis. However, when comparing the H1-2022 projected and H1-2022 outlook period, a rise in BPS change by 40 BPS has been noticed.
IBC is used to transport and store large quantities of liquids cheaply compared to drums. The IBC rental business help the end use industries reduce the cost of new IBC otherwise required during transport of different products.
As stainless steel is gaining attention as a material in the IBC rental market, the market share of IBC rentals has increased in recent years due to the outstanding versatility and durability of these metal containers.
Historic and Forecast Market Outlook for IBC Rental Business
IBC rental business is defined as services of renting IBCs for a long or short time period as per the requirement of customers. Companies with low capital and having a temporary need for IBCs are opting for rental IBCs. In the last couple of years, the demand for IBC rental business and services related to it has witnessed a significant spike as industry players take these rental services for both industrial and non-industrial activities.
Along with this, crucial factors such as the benefits of renting big IBC’s overs buying new ones and reduced cleaning and maintenance challenges incurred in IBC handling and shipping owing to renting it are driving the IBC rental business market growth substantially. The future IBC rental business market growth outlook seems positive and lucrative as industry players from the food & beverage and pharmaceuticals industries are started to utilize rental services on a larger scale.
How Chemical industry and its daily Functioning Reshape the Global IBC Rental Business Market Growth?
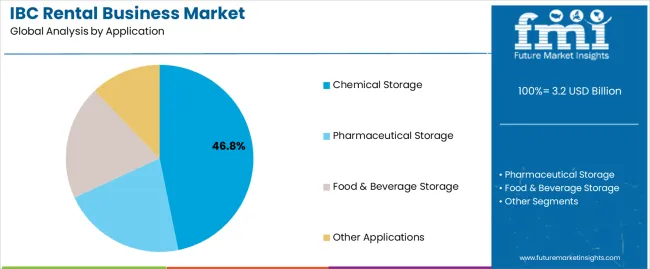
The global IBC rental business market is mainly driven by the demand generated from the chemical industry. A range of chemical companies operating across the globe is renting and adopting IBC's to store and transport hazardous and non-hazardous chemicals on the back of its high safety features and easy warehousing.
Currently, in the global packaging industry especially industrial packaging, IBC’s are a highly used packaging format for storing and shipping liquid and semi-liquid chemical and non-chemical products. Considering the current and future manufacturing output from the global chemical sector, the demand for IBC’s are anticipated to increase and so for the IBC rental business services. Rental services of these bulk containers act as a catalyst to raise the adoption of IBC’s in the chemical industries. Furthermore, the capital benefits and savings associated with these services are further bolstering the global IBC rental business market growth.
Find your sweet spots for generating winning opportunities in this market.
Talk to AnalystHow Incorporation of Track and Trace Technologies in IBC Rental Services Supplement the Market Growth?
The various types of IBC’s with different capacities are predominantly used in the food and beverages, chemical, pharmaceuticals, and cosmetics industries for effective and efficient transportation of goods. The IBC rental business services are cost-effective and efficient, but it is also difficult to maintain its accountability. To tackle the problem, many companies operating in the market are incorporating tracking systems in IBCs. The tracking companies are providing affordable cloud-based inventory management software solutions to track, manage, and maintain your IBC totes and other equipment. The new technologies to collect information with rugged handheld scanners, smartphones or tablets are adding value in the track and trace solutions provided by rental IBC services. This addition of track and trace technologies in IBC’s also help to manage and control overall inventory management. Such technological advancement in IBC rental business market is raising its popularity among the industry players.
How COVID-19 Pandemic Slowdown the Economic Growth of IBC Rental Business Market?
The global spread of the COVID-19 pandemic has damaged the financial growth of the global IBC rental business market. Amid the peak pandemic period, the global IBC rental business market is mainly affected by the reduced demand generation from end-use industries, especially from the industrial chemical sector. Restriction on import and export activities across the countries disrupted supply chains, halt in production in manufacturing plants further dent the demand for IBC rental business services during the peak pandemic period. Nevertheless, the target market is getting recover from the COVID setback, as industrial and non-industrial companies are started to resume their manufacturing activities with required precautionary measures.

An unified Market Research Subscription Platform, built for today’s disparate research needs.
Country-wise Insights
How German Chemical and Pharmaceutical Sectors are Offering Revenue Generating Opportunities for Rental Service Providers?
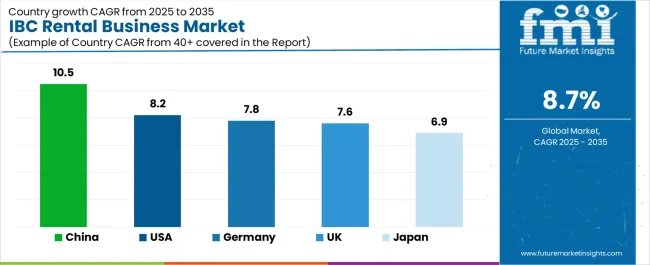
The chemical industry is estimated to remain at the forefront in terms of creating demand for IBC rental business services. The European chemical industry is well known for its massive manufacturing output and economic growth and the German chemical sector is no exception to this. As per the European Chemical Industry Council, the German chemical and pharmaceutical industries turnover was more than US$ 210 Bn in 2020 with heavy manufacturing output. In terms of revenue generation, these industries are the 3rd largest industries in Germany after automotive & machinery and equipment. Along with this, the research and development spending on the German chemical industry was around US$ 17 Bn in 2020. Such factors are projected to induce a positive impact on the demand for IBC rental business in Germany.
What Impact will Unites States Automotive Industry Create on the IBC Rental Business Market in foreseeable Future?
Tires & auto components is one of the major segment that drives the demand for IBC rental business services. United State automotive industry is one of the leading car manufacturers and sells its cars worldwide. As per the International Labour Organization, the United States is second in terms of vehicle production after China. In 2018, the United States has produced over 11 Mn units of vehicles which is way higher than many Asian and European countries. Such factor is fuelling the demand for IBC rental services in the United States and will uplift the IBC rental business market growth during the coming years. Back on the mentioned factors, the country is estimated to offer an incremental opportunity of US$ 90 Mn during the forecast period.
Category-wise Insights
Which Product is Gaining Significant Traction in the Global IBC Rental Business Market?
In terms of market share and sales, the stainless steel IBC product segment is driving the global IBC rental business market. Back on its high durability and affordable pricing the target segment is predominantly used in chemical, automotive and other industries for safer and efficient shipping and transportation. With its robust and cost-effective outlook, the stainless steel IBC product segment is estimated to offer a total incremental opportunity of US$ ~205 Mn by the end of 2029.
Which End Use Segment is Offering Maximum Revenue Generating Opportunities for Service Providers?
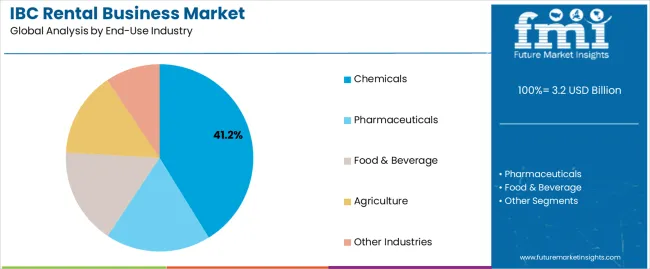
The industrial chemicals end-use segment is estimated to remain at the forefront in terms of revenue generation for IBC rental business service providers. The requirement of IBC’s on a daily basis for shipping and storing hazardous and non-hazardous chemicals is creating massive demand among the industry players for IBC rental business services. Back on this factor, the target segment is projected to expand by 1.5x times the current market value by the end of 2029.
Competitive Landscape
Leading service providers and manufacturers dealing in the global IBC rental business market are adopting key market strategies such as expansion, product development and others to compete and maximize its sales in the market. Manufacturers and service providers operating in the IBC rental business market are also focusing on innovation and development to lure a major portion of the industry players in the market.
- For instance, In 2020, Hoover Ferguson Group, one of the leaders in the IBC rental business market has announced that Company is expanding its range of wine and distillery IBC’s into the Australian and New Zealand.
- In 2020, the same company was announced as the Environmental Leader Product of the Year winner for their Liquitote® stainless steel Intermediate bulk container.
Scope Of Report
Attribute |
Details |
Forecast Period |
2022-2029 |
Historical Data Available for |
2014-2021 |
Market Analysis |
US$ Million for Value and 000’ Units for Volume |
Key Regions Covered |
North America, Latin America, Europe, Middle East & Africa, East Asia, South Asia and Oceania |
Key Countries Covered |
US, Canada, Brazil, Mexico, Germany, Spain, Italy, France, U.K., Russia, China, India, Australia & New Zealand, GCC Countries, and South Africa |
Key Segments Covered |
Product, Material, Content, Capacity, End Use and Region |
Key Companies Profiled |
|
Report Coverage |
Market Forecast, Company Share Analysis, Competition Intelligence, DROT Analysis, Market Dynamics and Challenges, and Strategic Growth Initiatives |
Customization & Pricing |
Available upon Request |
IBC Rental Business Market By Category
By Material:
- Carbon Steel
- Stainless Steel
- Plastic
By Product:
- Flexitanks
- Stainless Steel IBC
- Carbon Steel IBC
- Plastic IBC
- Composite IBC
By Content:
- Liquids
- Solids & Semi-solids
By Capacity:
- Upto 1000 liters
- 1001-1500 liters
- 1501-2000 liters
- Above 2000 liters
By End Use:
- Industrial Chemicals
- Petroleum & Lubricants
- Paints, Inks & Dyes
- Food & Beverages
- Personal Care & Cosmetics
- Synthetic & Natural Rubber
- Tires & Auto Components
- Pharmaceuticals
- Others
By Region:
- North America
- Latin America
- Europe
- MEA
- South Asia
- East Asia
- Oceania
Frequently Asked Questions
The global IBC rental business market was worth US$ ~1,218.0 Mn in 2022.
The global IBC rental business market registered a CAGR of 4.7% during 2014-2021.
The global IBC rental business market is projected to expand at a CAGR of 5.7% during the forecast period (2022-2029).
The increasing international trade activities, especially after pandemic period is accelerating the market growth to a significant extent.
Track and trace technologies to add value in the IBC rental services is currently gaining significant traction in the market.
As per FMI analysis, the Indian IBC rental business market is estimated to expand at a CAGR of 7.5% between 2022 and 2029.
Table of Content
1. Executive Summary
1.1. Global Market Outlook
1.2. Demand Side Trends
1.3. Supply Side Trends
1.4. Analysis and Recommendations
2. Market Overview
2.1. Market Coverage / Taxonomy
2.2. Market Definition / Scope / Limitations
3. Key Market Trends
3.1. Key Trends Impacting the Market
3.2. Product Innovation / Development Trends
4. Key Success Factors
4.1. Product Adoption / Usage Analysis
4.2. Product USPs / Features
4.3. Strategic Promotional Strategies
5. Global IBC Rental Business Market Demand Analysis 2014–2021 and Forecast, 2022–2029
5.1. Historical Market Volume (000’ Units) Analysis, 2014–2021
5.2. Current and Future Market Volume (000’ Units) Projections, 2022–2029
5.3. Y-o-Y Growth Trend Analysis
6. Global IBC Rental Business Market - Pricing Analysis
6.1. Regional Pricing Analysis
6.2. Global Average Pricing Analysis Benchmark
7. Global IBC Rental Business Market Demand (in Value or Size in US$ Mn) Analysis 2014–2021 and Forecast, 2022–2029
7.1. Historical Market Value (US$ Mn) Analysis, 2014–2021
7.2. Current and Future Market Value (US$ Mn) Projections, 2022–2029
7.2.1. Y-o-Y Growth Trend Analysis
7.2.2. Absolute $ Opportunity Analysis
8. Market Background
8.1.1. Global Packaging Market Overview
8.1.2. Global Petroleum & Lubricants Industry Outlook
8.1.3. Global Chemical Industry Growth Outlook
8.1.4. Macro-Economic Factors
8.1.5. Forecast Factors - Relevance & Impact
8.2. Value Chain
8.2.1. Raw Product Suppliers
8.2.2. IBC Rental Business Service Providers
8.2.3. End User
8.3. COVID-19 Crisis – Impact Assessment
8.3.1. Current Statistics
8.3.2. Short-Mid-Long Term Outlook
8.3.3. Likely Rebound
8.4. Market Dynamics
8.4.1. Drivers
8.4.2. Restraints
8.4.3. Opportunity Analysis
8.5. Global Supply Demand Analysis
9. Global IBC Rental Business Market Analysis 2014–2021 and Forecast 2022–2029, by Material
9.1. Introduction / Key Findings
9.2. Historical Market Size (US$ Mn) and Volume (000’ Units) Analysis By Material, 2014–2021
9.3. Current and Future Market Size (US$ Mn) and Volume (000’ Units) Analysis and Forecast By Material, 2022–2029
9.3.1. Carbon Steel
9.3.2. Stainless Steel
9.3.3. Plastic
9.4. Market Attractiveness Analysis By Material
10. Global IBC Rental Business Market Analysis 2014–2021 and Forecast 2022–2029, by Product
10.1. Introduction / Key Findings
10.2. Historical Market Size (US$ Mn) and Volume (000’ Units) Analysis By Product, 2014–2021
10.3. Current and Future Market Size (US$ Mn) and Volume (000’ Units) Analysis and Forecast By Product, 2022–2029
10.3.1. Flexitanks
10.3.2. Stainless Steel IBC
10.3.3. Carbon Steel IBC
10.3.4. Plastic IBC
10.3.5. Composite IBC
10.4. Market Attractiveness Analysis By Product
11. Global IBC Rental Business Market Analysis 2014–2021 and Forecast 2022–2029, by Content
11.1. Introduction / Key Findings
11.2. Historical Market Size (US$ Mn) and Volume (000’ Units) Analysis By Content, 2014–2021
11.3. Current and Future Market Size (US$ Mn) and Volume (000’ Units) Analysis and Forecast By Content, 2022–2029
11.3.1. Liquids
11.3.2. Solids & Semi-solids
11.4. Market Attractiveness Analysis By Content
12. Global IBC Rental Business Market Analysis 2014–2021 and Forecast 2022–2029, by Capacity
12.1. Introduction / Key Findings
12.2. Historical Market Size (US$ Mn) and Volume (000’ Units) Analysis By Capacity, 2014–2021
12.3. Current and Future Market Size (US$ Mn) and Volume (000’ Units) Analysis and Forecast By Capacity, 2022–2029
12.3.1. Upto 1000 liters
12.3.2. 1001-1500 liters
12.3.3. 1501-2000 liters
12.3.4. Above 2000 liters
12.4. Market Attractiveness Analysis By Capacity
13. Global IBC Rental Business Market Analysis 2014–2021 and Forecast 2022–2029, by End Use
13.1. Introduction / Key Findings
13.2. Historical Market Size (US$ Mn) and Volume (000’ Units) Analysis By End Use, 2014–2021
13.3. Current and Future Market Size (US$ Mn) and Volume (000’ Units) Analysis and Forecast By End Use, 2022–2029
13.3.1. Industrial Chemicals
13.3.2. Petroleum & Lubricants
13.3.3. Paints, Inks & Dyes
13.3.4. Food & Beverages
13.3.5. Personal Care & Cosmetics
13.3.6. Synthetic & Natural Rubber
13.3.7. Tires & Auto Components
13.3.8. Pharmaceuticals
13.3.9. Others
13.4. Market Attractiveness Analysis By End Use
14. Global IBC Rental Business Market Analysis 2014–2021 and Forecast 2022–2029, by Region
14.1. Introduction / Key Findings
14.2. Historical Market Size (US$ Mn) and Volume (000’ Units) Analysis By Region, 2014–2021
14.3. Current and Future Market Size (US$ Mn) and Volume (000’ Units) Analysis and Forecast By Region, 2022–2029
14.3.1. North America
14.3.2. Latin America
14.3.3. Europe
14.3.4. Middle East and Africa (MEA)
14.3.5. East Asia
14.3.6. South Asia
14.3.7. Oceania
14.4. Market Attractiveness Analysis By Region
15. North America IBC Rental Business Market Analysis 2014–2021 and Forecast 2022–2029
15.1. Introduction / Key Findings
15.2. Historical Market Size (US$ Mn) and Volume (000’ Units) Analysis by Market Taxonomy, 2014–2021
15.3. Current Market Size (US$ Mn) and Volume (000’ Units) Analysis and Forecast by Market Taxonomy, 2022–2029
15.3.1. By Country
15.3.1.1. U.S.
15.3.1.2. Canada
15.3.2. By Material
15.3.3. By Product
15.3.4. By Content
15.3.5. By Capacity
15.3.6. By End Use
15.4. Market Attractiveness Analysis
15.4.1. By Country
15.4.2. By Material
15.4.3. By Product
15.4.4. By Content
15.4.5. By Capacity
15.4.6. By End Use
16. Latin America IBC Rental Business Market Analysis 2014–2021 and Forecast 2022–2029
16.1. Introduction / Key Findings
16.2. Historical Market Size (US$ Mn) and Volume (000’ Units) Analysis by Market Taxonomy, 2014–2021
16.3. Current Market Size (US$ Mn) and Volume (000’ Units) Analysis and Forecast by Market Taxonomy, 2022–2029
16.3.1. By Country
16.3.1.1. Brazil
16.3.1.2. Mexico
16.3.1.3. Argentina
16.3.1.4. Chile
16.3.1.5. Peru
16.3.1.6. Rest of Latin America
16.3.2. By Material
16.3.3. By Product
16.3.4. By Content
16.3.5. By Capacity
16.3.6. By End Use
16.4. Market Attractiveness Analysis
16.4.1. By Country
16.4.2. By Material
16.4.3. By Product
16.4.4. By Content
16.4.5. By Capacity
16.4.6. By End Use
17. Europe IBC Rental Business Market Analysis 2014–2021 and Forecast 2022–2029
17.1. Introduction / Key Findings
17.2. Historical Market Size (US$ Mn) and Volume (000’ Units) Analysis by Market Taxonomy, 2014–2021
17.3. Current Market Size (US$ Mn) and Volume (000’ Units) Analysis and Forecast by Market Taxonomy, 2022–2029
17.3.1. By Country
17.3.1.1. Germany
17.3.1.2. Italy
17.3.1.3. France
17.3.1.4. U.K.
17.3.1.5. Spain
17.3.1.6. BENELUX
17.3.1.7. Nordic
17.3.1.8. Poland
17.3.1.9. Russia
17.3.1.10. Rest of Europe
17.3.2. By Material
17.3.3. By Product
17.3.4. By Content
17.3.5. By Capacity
17.3.6. By End Use
17.4. Market Attractiveness Analysis
17.4.1. By Country
17.4.2. By Material
17.4.3. By Product
17.4.4. By Content
17.4.5. By Capacity
17.4.6. By End Use
18. Middle East & Africa IBC Rental Business Market Analysis 2014–2021 and Forecast 2022–2029
18.1. Introduction / Key Findings
18.2. Historical Market Size (US$ Mn) and Volume (000’ Units) Analysis by Market Taxonomy, 2014–2021
18.3. Current Market Size (US$ Mn) and Volume (000’ Units) Analysis and Forecast by Market Taxonomy, 2022–2029
18.3.1. By Country
18.3.1.1. GCC Countries
18.3.1.2. Turkey
18.3.1.3. Northern Africa
18.3.1.4. South Africa
18.3.1.5. Rest of Middle East and Africa
18.3.2. By Material
18.3.3. By Product
18.3.4. By Content
18.3.5. By Capacity
18.3.6. By End Use
18.4. Market Attractiveness Analysis
18.4.1. By Country
18.4.2. By Material
18.4.3. By Product
18.4.4. By Content
18.4.5. By Capacity
18.4.6. By End Use
19. East Asia IBC Rental Business Market Analysis 2014–2021 and Forecast 2022–2029
19.1. Introduction / Key Findings
19.2. Historical Market Size (US$ Mn) and Volume (000’ Units) Analysis by Market Taxonomy, 2014–2021
19.3. Current Market Size (US$ Mn) and Volume (000’ Units) Analysis and Forecast by Market Taxonomy, 2022–2029
19.3.1. By Country
19.3.1.1. China
19.3.1.2. Japan
19.3.1.3. South Korea
19.3.2. By Material
19.3.3. By Product
19.3.4. By Content
19.3.5. By Capacity
19.3.6. By End Use
19.4. Market Attractiveness Analysis
19.4.1. By Country
19.4.2. By Material
19.4.3. By Product
19.4.4. By Content
19.4.5. By Capacity
19.4.6. By End Use
20. South Asia IBC Rental Business Market Analysis 2014–2021 and Forecast 2022–2029
20.1. Introduction / Key Findings
20.2. Historical Market Size (US$ Mn) and Volume (000’ Units) Analysis by Market Taxonomy, 2014–2021
20.3. Current Market Size (US$ Mn) and Volume (000’ Units) Analysis and Forecast by Market Taxonomy, 2022–2029
20.3.1. By Country
20.3.1.1. India
20.3.1.2. Thailand
20.3.1.3. Indonesia
20.3.1.4. Malaysia
20.3.1.5. Singapore
20.3.1.6. Rest of South Asia
20.3.2. By Material
20.3.3. By Product
20.3.4. By Content
20.3.5. By Capacity
20.3.6. By End Use
20.4. Market Attractiveness Analysis
20.4.1. By Country
20.4.2. By Material
20.4.3. By Product
20.4.4. By Content
20.4.5. By Capacity
20.4.6. By End Use
21. Oceania IBC Rental Business Market Analysis 2014–2021 and Forecast 2022–2029
21.1. Introduction / Key Findings
21.2. Historical Market Size (US$ Mn) and Volume (000’ Units) Analysis by Market Taxonomy, 2014–2021
21.3. Current Market Size (US$ Mn) and Volume (000’ Units) Analysis and Forecast by Market Taxonomy, 2022–2029
21.3.1. By Country
21.3.1.1. Australia
21.3.1.2. New Zealand
21.3.2. By Material
21.3.3. By Product
21.3.4. By Content
21.3.5. By Capacity
21.3.6. By End Use
21.4. Market Attractiveness Analysis
21.4.1. By Country
21.4.2. By Material
21.4.3. By Product
21.4.4. By Content
21.4.5. By Capacity
21.4.6. By End Use
22. Global Country wise IBC Rental Business Market Analysis
22.1. Introduction
22.2. USA IBC Rental Business Market Analysis
22.2.1. By Material
22.2.2. By Product
22.2.3. By Content
22.2.4. By Capacity
22.2.5. By End Use
22.3. Canada IBC Rental Business Market Analysis
22.3.1. By Material
22.3.2. By Product
22.3.3. By Content
22.3.4. By Capacity
22.3.5. By End Use
22.4. Brazil IBC Rental Business Market Analysis
22.4.1. By Material
22.4.2. By Product
22.4.3. By Content
22.4.4. By Capacity
22.4.5. By End Use
22.5. Mexico IBC Rental Business Market Analysis
22.5.1. By Material
22.5.2. By Product
22.5.3. By Content
22.5.4. By Capacity
22.5.5. By End Use
22.6. Germany IBC Rental Business Market Analysis
22.6.1. By Material
22.6.2. By Product
22.6.3. By Content
22.6.4. By Capacity
22.6.5. By End Use
22.7. U.K. IBC Rental Business Market Analysis
22.7.1. By Material
22.7.2. By Product
22.7.3. By Content
22.7.4. By Capacity
22.7.5. By End Use
22.8. Spain IBC Rental Business Market Analysis
22.8.1. By Material
22.8.2. By Product
22.8.3. By Content
22.8.4. By Capacity
22.8.5. By End Use
22.9. France IBC Rental Business Market Analysis
22.9.1. By Material
22.9.2. By Product
22.9.3. By Content
22.9.4. By Capacity
22.9.5. By End Use
22.10. Russia IBC Rental Business Market Analysis
22.10.1. By Material
22.10.2. By Material
22.10.3. By Product
22.10.4. By Content
22.10.5. By Capacity
22.10.6. By End Use
22.11. China IBC Rental Business Market Analysis
22.11.1. By Material
22.11.2. By Product
22.11.3. By Content
22.11.4. By Capacity
22.11.5. By End Use
22.12. Japan IBC Rental Business Market Analysis
22.12.1. By Material
22.12.2. By Product
22.12.3. By Content
22.12.4. By Capacity
22.12.5. By End Use
22.13. India IBC Rental Business Market Analysis
22.13.1. By Material
22.13.2. By Product
22.13.3. By Content
22.13.4. By Capacity
22.13.5. By End Use
22.14. GCC IBC Rental Business Market Analysis
22.14.1. By Material
22.14.2. By Product
22.14.3. By Content
22.14.4. By Capacity
22.14.5. By End Use
22.15. Australia IBC Rental Business Market Analysis
22.15.1. By Material
22.15.2. By Product
22.15.3. By Content
22.15.4. By Capacity
22.15.5. By End Use
23. Market Structure Analysis
23.1. Market Analysis by Tier of Companies (IBC Rental Business)
23.2. Market Share Analysis of Top Players
23.3. Market Presence Analysis
24. Competition Analysis
24.1. Competition Dashboard
24.2. Competition Benchmarking
24.3. Competition Deep Dive
(Global Based/Operating Key Market Players)
24.3.1. Brambles Ltd
24.3.1.1. Overview
24.3.1.2. Product Portfolio
24.3.1.3. Profitability by Market Segments (Product/Channel/Region)
24.3.1.4. Sales Footprint
24.3.1.5. Strategy Overview
24.3.2. Hoover Ferguson Group
24.3.2.1. Overview
24.3.2.2. Product Portfolio
24.3.2.3. Profitability by Market Segments (Product/Channel/Region)
24.3.2.4. Sales Footprint
24.3.2.5. Strategy Overview
24.3.3. HOYER GmbH
24.3.3.1. Overview
24.3.3.2. Product Portfolio
24.3.3.3. Profitability by Market Segments (Product/Channel/Region)
24.3.3.4. Sales Footprint
24.3.3.5. Strategy Overview
24.3.4. Americold Realty Trust, Inc
24.3.4.1. Overview
24.3.4.2. Product Portfolio
24.3.4.3. Profitability by Market Segments (Product/Channel/Region)
24.3.4.4. Sales Footprint
24.3.4.5. Strategy Overview
24.3.5. Envirotainer AB
24.3.5.1. Overview
24.3.5.2. Product Portfolio
24.3.5.3. Profitability by Market Segments (Product/Channel/Region)
24.3.5.4. Sales Footprint
24.3.5.5. Strategy Overview
24.3.6. Goodpack Ltd
24.3.6.1. Overview
24.3.6.2. Product Portfolio
24.3.6.3. Profitability by Market Segments (Product/Channel/Region)
24.3.6.4. Sales Footprint
24.3.6.5. Strategy Overview
24.3.7. TPS Rental Systems Ltd
24.3.7.1. Overview
24.3.7.2. Product Portfolio
24.3.7.3. Profitability by Market Segments (Product/Channel/Region)
24.3.7.4. Sales Footprint
24.3.7.5. Strategy Overview
24.3.8. CMO Enterprises, Inc
24.3.8.1. Overview
24.3.8.2. Product Portfolio
24.3.8.3. Profitability by Market Segments (Product/Channel/Region)
24.3.8.4. Sales Footprint
24.3.8.5. Strategy Overview
24.3.9. Hawman Container Services
24.3.9.1. Overview
24.3.9.2. Product Portfolio
24.3.9.3. Profitability by Market Segments (Product/Channel/Region)
24.3.9.4. Sales Footprint
24.3.9.5. Strategy Overview
24.3.10. SCHÄFER Werke GmbH
24.3.10.1. Overview
24.3.10.2. Product Portfolio
24.3.10.3. Profitability by Market Segments (Product/Channel/Region)
24.3.10.4. Sales Footprint
24.3.10.5. Strategy Overview
24.3.11. Metano IBC Services, Inc
24.3.11.1. Overview
24.3.11.2. Product Portfolio
24.3.11.3. Profitability by Market Segments (Product/Channel/Region)
24.3.11.4. Sales Footprint
24.3.11.5. Strategy Overview
24.3.12. Mitchell Container Services Inc
24.3.12.1. Overview
24.3.12.2. Product Portfolio
24.3.12.3. Profitability by Market Segments (Product/Channel/Region)
24.3.12.4. Sales Footprint
24.3.12.5. Strategy Overview
24.3.13. Precision IBC, Inc
24.3.13.1. Overview
24.3.13.2. Product Portfolio
24.3.13.3. Profitability by Market Segments (Product/Channel/Region)
24.3.13.4. Sales Footprint
24.3.13.5. Strategy Overview
*The above list is indicative in nature and is subject to change during the course of research
25. Assumptions and Acronyms Used
26. Research Methodology
Let us know your requirement to get
100% FREE customization
List of Tables
Table 01: Global IBC Rental Business Market Value (US$ Mn) by Material, 2014H-2029F
Table 02: Global IBC Rental Business Market Volume (000’ Units) by Material, 2014H-2029F
Table 03: Global IBC Rental Business Market Value (US$ Mn) by Product, 2014H-2029F
Table 04: Global IBC Rental Business Market Volume (000’ Units) by Product, 2014H-2029F
Table 05: Global IBC Rental Business Market Value (US$ Mn) by Content, 2014H-2029F
Table 06: Global IBC Rental Business Market Volume (000’ Units) by Content, 2014H-2029F
Table 07: Global IBC Rental Business Market Value (US$ Mn) by Capacity, 2014H-2029F
Table 08: Global IBC Rental Business Market Volume (000’ Units) by Capacity, 2014H-2029F
Table 09: Global IBC Rental Business Market Value (US$ Mn) by End Use, 2014H-2029F
Table 10: Global IBC Rental Business Market Volume (000’ Units) by End Use, 2014H-2029F
Table 11: Global IBC Rental Business Market Value (US$ Mn) by Region, 2014H-2029F
Table 12: Global IBC Rental Business Market Volume (000’ Units) by Region, 2014H-2029F
Table 13: North America IBC Rental Business Market Value (US$ Mn) by Material, 2014H-2029F
Table 14: North America IBC Rental Business Market Volume (000’ Units) by Material, 2014H-2029F
Table 15: North America IBC Rental Business Market Value (US$ Mn) by Product, 2014H-2029F
Table 16: North America IBC Rental Business Market Volume (000’ Units) by Product, 2014H-2029F
Table 17: North America IBC Rental Business Market Value (US$ Mn) by Content, 2014H-2029F
Table 18: North America IBC Rental Business Market Volume (000’ Units) by Content, 2014H-2029F
Table 19: North America IBC Rental Business Market Value (US$ Mn) by Capacity, 2014H-2029F
Table 20: North America IBC Rental Business Market Volume (000’ Units) by Capacity, 2014H-2029F
Table 21: North America IBC Rental Business Market Value (US$ Mn) by End Use, 2014H-2029F
Table 22: North America IBC Rental Business Market Volume (000’ Units) by End Use, 2014H-2029F
Table 23: North America IBC Rental Business Market Value (US$ Mn) by Country, 2014H-2029F
Table 24: North America IBC Rental Business Market Volume (000’ Units) by Country, 2014H-2029F
Table 25: Latin America IBC Rental Business Market Value (US$ Mn) by Material, 2014H-2029F
Table 26: Latin America IBC Rental Business Market Volume (000’ Units) by Material, 2014H-2029F
Table 27: Latin America IBC Rental Business Market Value (US$ Mn) by Product, 2014H-2029F
Table 28: Latin America IBC Rental Business Market Volume (000’ Units) by Product, 2014H-2029F
Table 29: Latin America IBC Rental Business Market Value (US$ Mn) by Content, 2014H-2029F
Table 30: Latin America IBC Rental Business Market Volume (000’ Units) by Content, 2014H-2029F
Table 31: Latin America IBC Rental Business Market Value (US$ Mn) by Capacity, 2014H-2029F
Table 32: Latin America IBC Rental Business Market Volume (000’ Units) by Capacity, 2014H-2029F
Table 33: Latin America IBC Rental Business Market Value (US$ Mn) by End Use, 2014H-2029F
Table 34: Latin America IBC Rental Business Market Volume (000’ Units) by End Use, 2014H-2029F
Table 35: Latin America IBC Rental Business Market Value (US$ Mn) by Country, 2014H-2029F
Table 36: Latin America IBC Rental Business Market Volume (000’ Units) by Country, 2014H-2029F
Table 37: Europe IBC Rental Business Market Value (US$ Mn) by Material, 2014H-2029F
Table 38: Europe IBC Rental Business Market Volume (000’ Units) by Material, 2014H-2029F
Table 39: Europe IBC Rental Business Market Value (US$ Mn) by Product, 2014H-2029F
Table 40: Europe IBC Rental Business Market Volume (000’ Units) by Product, 2014H-2029F
Table 41: Europe IBC Rental Business Market Value (US$ Mn) by Content, 2014H-2029F
Table 42: Europe IBC Rental Business Market Volume (000’ Units) by Content, 2014H-2029F
Table 43: Europe IBC Rental Business Market Value (US$ Mn) by Capacity, 2014H-2029F
Table 44: Europe IBC Rental Business Market Volume (000’ Units) by Capacity, 2014H-2029F
Table 45: Europe IBC Rental Business Market Value (US$ Mn) by End Use, 2014H-2029F
Table 46: Europe IBC Rental Business Market Volume (000’ Units) by End Use, 2014H-2029F
Table 47: Europe IBC Rental Business Market Value (US$ Mn) by Country, 2014H-2029F
Table 48: Europe IBC Rental Business Market Volume (000’ Units) by Country, 2014H-2029F
Table 49: Middle East & Africa IBC Rental Business Market Value (US$ Mn) by Material, 2014H-2029F
Table 50: Middle East & Africa IBC Rental Business Market Volume (000’ Units) by Material, 2014H-2029F
Table 51: Middle East & Africa IBC Rental Business Market Value (US$ Mn) by Product, 2014H-2029F
Table 52: Middle East & Africa IBC Rental Business Market Volume (000’ Units) by Product, 2014H-2029F
Table 53: Middle East & Africa IBC Rental Business Market Value (US$ Mn) by Content, 2014H-2029F
Table 55: Middle East & Africa IBC Rental Business Market Volume (000’ Units) by Content, 2014H-2029F
Table 56: Middle East & Africa IBC Rental Business Market Value (US$ Mn) by Capacity, 2014H-2029F
Table 57: Middle East & Africa IBC Rental Business Market Volume (000’ Units) by Capacity, 2014H-2029F
Table 58: Middle East & Africa IBC Rental Business Market Value (US$ Mn) by End Use, 2014H-2029F
Table 59: Middle East & Africa IBC Rental Business Market Volume (000’ Units) by End Use, 2014H-2029F
Table 60: Middle East & Africa IBC Rental Business Market Value (US$ Mn) by Country, 2014H-2029F
Table 61: Middle East & Africa IBC Rental Business Market Volume (000’ Units) by Country, 2014H-2029F
Table 62: East Asia IBC Rental Business Market Value (US$ Mn) by Material, 2014H-2029F
Table 63: East Asia IBC Rental Business Market Volume (000’ Units) by Material, 2014H-2029F
Table 64: East Asia IBC Rental Business Market Value (US$ Mn) by Product, 2014H-2029F
Table 65: East Asia IBC Rental Business Market Volume (000’ Units) by Product, 2014H-2029F
Table 66: East Asia IBC Rental Business Market Value (US$ Mn) by Content, 2014H-2029F
Table 67: East Asia IBC Rental Business Market Volume (000’ Units) by Content, 2014H-2029F
Table 68: East Asia IBC Rental Business Market Value (US$ Mn) by Capacity, 2014H-2029F
Table 69: East Asia IBC Rental Business Market Volume (000’ Units) by Capacity, 2014H-2029F
Table 70: East Asia IBC Rental Business Market Value (US$ Mn) by End Use, 2014H-2029F
Table 71: East Asia IBC Rental Business Market Volume (000’ Units) by End Use, 2014H-2029F
Table 72: East Asia IBC Rental Business Market Value (US$ Mn) by Country, 2014H-2029F
Table 73: East Asia IBC Rental Business Market Volume (000’ Units) by Country, 2014H-2029F
Table 74: South Asia IBC Rental Business Market Value (US$ Mn) by Material, 2014H-2029F
Table 75: South Asia IBC Rental Business Market Volume (000’ Units) by Material, 2014H-2029F
Table 76: South Asia IBC Rental Business Market Value (US$ Mn) by Product, 2014H-2029F
Table 77: South Asia IBC Rental Business Market Volume (000’ Units) by Product, 2014H-2029F
Table 78: South Asia IBC Rental Business Market Value (US$ Mn) by Content, 2014H-2029F
Table 79: South Asia IBC Rental Business Market Volume (000’ Units) by Content, 2014H-2029F
Table 80: South Asia IBC Rental Business Market Value (US$ Mn) by Capacity, 2014H-2029F
Table 81: South Asia IBC Rental Business Market Volume (000’ Units) by Capacity, 2014H-2029F
Table 82: South Asia IBC Rental Business Market Value (US$ Mn) by End Use, 2014H-2029F
Table 83: South Asia IBC Rental Business Market Volume (000’ Units) by End Use, 2014H-2029F
Table 84: South Asia IBC Rental Business Market Value (US$ Mn) by Country, 2014H-2029F
Table 85: South Asia IBC Rental Business Market Volume (000’ Units) by Country, 2014H-2029F
Table 86: Oceania IBC Rental Business Market Value (US$ Mn) by Material, 2014H-2029F
Table 87: Oceania IBC Rental Business Market Volume (000’ Units) by Material, 2014H-2029F
Table 88: Oceania IBC Rental Business Market Value (US$ Mn) by Product, 2014H-2029F
Table 89: Oceania IBC Rental Business Market Volume (000’ Units) by Product, 2014H-2029F
Table 90: Oceania IBC Rental Business Market Value (US$ Mn) by Content, 2014H-2029F
Table 91: Oceania IBC Rental Business Market Volume (000’ Units) by Content, 2014H-2029F
Table 92: Oceania IBC Rental Business Market Value (US$ Mn) by Capacity, 2014H-2029F
Table 93: Oceania IBC Rental Business Market Volume (000’ Units) by Capacity, 2014H-2029F
Table 94: Oceania IBC Rental Business Market Value (US$ Mn) by End Use, 2014H-2029F
Table 95: Oceania IBC Rental Business Market Volume (000’ Units) by End Use, 2014H-2029F
Table 96: Oceania IBC Rental Business Market Value (US$ Mn) by Country, 2014H-2029F
Table 97: Oceania IBC Rental Business Market Volume (000’ Units) by Country, 2014H-2029F
Table 98: USA IBC Rental Business Market Analysis by Product, Material, Content, Capacity and End Use
Table 99: Canada IBC Rental Business Market Analysis by Product, Material, Content, Capacity and End Use
Table 100: Brazil IBC Rental Business Market Analysis by Product, Material, Content, Capacity and End Use
Table 101: Mexico IBC Rental Business Market Analysis by Product, Material, Content, Capacity and End Use
Table 102: U.K. IBC Rental Business Market Analysis by Product, Material, Content, Capacity and End Use
Table 103: Germany IBC Rental Business Market Analysis by Product, Material, Content, Capacity and End Use
Table 104: Spain IBC Rental Business Market Analysis by Product, Material, Content, Capacity and End Use
Table 105: France IBC Rental Business Market Analysis by Product, Material, Content, Capacity and End Use
Table 106: Russia IBC Rental Business Market Analysis by Product, Material, Content, Capacity and End Use
Table 107: China IBC Rental Business Market Analysis by Product, Material, Content, Capacity and End Use
Table 108: Japan IBC Rental Business Market Analysis by Product, Material, Content, Capacity and End Use
Table 109: India IBC Rental Business Market Analysis by Product, Material, Content, Capacity and End Use
Table 110: GCC IBC Rental Business Market Analysis by Product, Material, Content, Capacity and End Use
Table 111: Australia IBC Rental Business Market Analysis by Product, Material, Content, Capacity and End Use
Find your sweet spots for generating winning opportunities in this market.
Talk to AnalystList of Charts
Figure 01: Global IBC Rental Business Market Share Analysis by Material, 2022E & 2029F
Figure 02: Global IBC Rental Business Market Attractiveness Analysis by Material, 2022E-2029F
Figure 03: Global IBC Rental Business Market Y-o-Y Analysis by Material, 2020H-2029F
Figure 04: Global IBC Rental Business Market Share Analysis by Product, 2022E & 2029F
Figure 05: Global IBC Rental Business Market Attractiveness Analysis by Product, 2022E-2029F
Figure 06: Global IBC Rental Business Market Y-o-Y Analysis by Product, 2020H-2029F
Figure 07: Global IBC Rental Business Market Share Analysis by Content, 2022E & 2029F
Figure 08: Global IBC Rental Business Market Attractiveness Analysis by Content, 2022E-2029F
Figure 09: Global IBC Rental Business Market Y-o-Y Analysis by Content, 2020H-2029F
Figure 10: Global IBC Rental Business Market Share Analysis by Capacity, 2022E & 2029F
Figure 11: Global IBC Rental Business Market Attractiveness Analysis by Capacity, 2022E-2029F
Figure 12: Global IBC Rental Business Market Y-o-Y Analysis by Capacity, 2020H-2029F
Figure 13: Global IBC Rental Business Market Share Analysis by End Use, 2022E & 2029F
Figure 14: Global IBC Rental Business Market Attractiveness Analysis by End Use, 2022E-2029F
Figure 15: Global IBC Rental Business Market Y-o-Y Analysis by End Use, 2020H-2029F
Figure 16: Global IBC Rental Business Market Share Analysis by Region, 2022E & 2029F
Figure 17: Global IBC Rental Business Market Attractiveness Analysis by Region, 2022E-2029F
Figure 18: Global IBC Rental Business Market Y-o-Y Analysis by Region, 2020H-2029F
Figure 19: North America IBC Rental Business Market Share Analysis by Product, 2022E & 2029F
Figure 20: North America IBC Rental Business Market Attractiveness Analysis by Content, 2022E-2029F
Figure 21: North America IBC Rental Business Market Y-o-Y Analysis by Material, 2020H-2029F
Figure 22: North America IBC Rental Business Market Share Analysis by Capacity, 2022E
Figure 23: North America IBC Rental Business Market Share Analysis by End Use, 2022E
Figure 24: North America IBC Rental Business Market Share Analysis by Country, 2022(E)
Figure 25: Latin America IBC Rental Business Market Share Analysis by Product, 2022E & 2029F
Figure 26: Latin America IBC Rental Business Market Attractiveness Analysis by Content, 2022E-2029F
Figure 27: Latin America IBC Rental Business Market Y-o-Y Analysis by Material, 2020H-2029F
Figure 28: Latin America IBC Rental Business Market Share Analysis by Capacity, 2022E
Figure 29: Latin America IBC Rental Business Market Share Analysis by End Use, 2022E
Figure 30: Latin America IBC Rental Business Market Share Analysis by Country, 2022(E)
Figure 31: Europe IBC Rental Business Market Share Analysis by Product, 2022E & 2029F
Figure 32: Europe IBC Rental Business Market Attractiveness Analysis by Content, 2022E-2029F
Figure 33: Europe IBC Rental Business Market Y-o-Y Analysis by Material, 2020H-2029F
Figure 34: Europe IBC Rental Business Market Share Analysis by Capacity, 2022E
Figure 35: Europe IBC Rental Business Market Share Analysis by End Use, 2022E
Figure 36: Europe IBC Rental Business Market Share Analysis by Country, 2022(E)
Figure 37: Middle East & Africa IBC Rental Business Market Share Analysis by Product, 2022E & 2029F
Figure 38: Middle East & Africa IBC Rental Business Market Attractiveness Analysis by Content, 2022E-2029F
Figure 39: Middle East & Africa IBC Rental Business Market Y-o-Y Analysis by Material, 2020H-2029F
Figure 40: Middle East & Africa IBC Rental Business Market Share Analysis by Capacity, 2022E
Figure 41: Middle East & Africa IBC Rental Business Market Share Analysis by End Use, 2022E
Figure 42: Middle East & Africa IBC Rental Business Market Share Analysis by Country, 2022(E)
Figure 43: East Asia IBC Rental Business Market Share Analysis by Product, 2022E & 2029F
Figure 44: East Asia IBC Rental Business Market Attractiveness Analysis by Content, 2022E-2029F
Figure 45: East Asia IBC Rental Business Market Y-o-Y Analysis by Material, 2020H-2029F
Figure 46: East Asia IBC Rental Business Market Share Analysis by Capacity, 2022E
Figure 47: East Asia IBC Rental Business Market Share Analysis by End Use, 2022E
Figure 48: East Asia IBC Rental Business Market Share Analysis by Country, 2022(E)
Figure 49: South Asia IBC Rental Business Market Share Analysis by Product, 2022E & 2029F
Figure 50: South Asia IBC Rental Business Market Attractiveness Analysis by Content, 2022E-2029F
Figure 51: South Asia IBC Rental Business Market Y-o-Y Analysis by Material, 2020H-2029F
Figure 52: South Asia IBC Rental Business Market Share Analysis by Capacity, 2022E
Figure 53: South Asia IBC Rental Business Market Share Analysis by End Use, 2022E
Figure 54: South Asia IBC Rental Business Market Share Analysis by Country, 2022(E)
Figure 55: Oceania IBC Rental Business Market Share Analysis by Product, 2022E & 2029F
Figure 56: Oceania IBC Rental Business Market Attractiveness Analysis by Content, 2022E-2029F
Figure 57: Oceania IBC Rental Business Market Y-o-Y Analysis by Material, 2020H-2029F
Figure 58: Oceania IBC Rental Business Market Share Analysis by Capacity, 2022E
Figure 59: Oceania IBC Rental Business Market Share Analysis by End Use, 2022E
Figure 60: Oceania IBC Rental Business Market Share Analysis by Country, 2022(E)
Need specific information?
Request CustomizationExplore Packaging Insights
View Reports