FIBC Market Size and Share Forecast Outlook 2025 to 2035

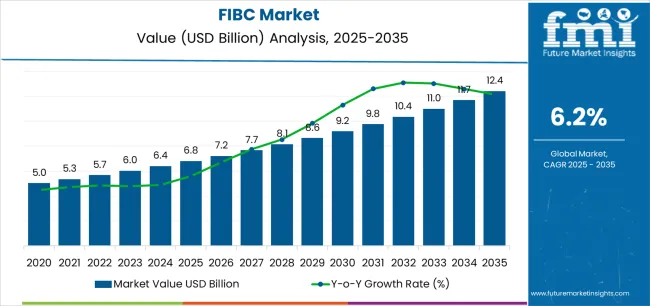
The global FIBC market is valued at USD 6.8 billion in 2025 and is slated to reach USD 12.4 billion by 2035, recording an absolute increase of USD 5.6 billion over the forecast period. This translates into a total growth of 82.4%, with the market forecast to expand at a compound annual growth rate (CAGR) of 6.2% between 2025 and 2035. Based on Future Market Insights (FMI)’s verified data on biopolymer, flexible, and rigid packaging adoption, the overall market size is expected to grow by nearly 1.82X during the same period, supported by increasing demand for cost-effective bulk packaging solutions, growing adoption in chemical and pharmaceutical industries, and rising preference for efficient material handling across construction and mining applications.

Quick Stats for FIBC Market

  • FIBC Market Value (2025): USD 6.8 billion
  • FIBC Market Forecast Value (2035): USD 12.4 billion
  • FIBC Market Forecast CAGR: 6.2%
  • Leading Application in FIBC Market: Food & Agriculture (36%)
  • Key Growth Regions in FIBC Market: Asia Pacific, North America, and Europe
  • Key Players in FIBC Market: Berry Global, Greif Inc., BAG Corp, LC Packaging, Emmbi Industries, Conitex Sonoco

Fibc Market Market Value Analysis

Between 2025 and 2030, the FIBC market is projected to expand from USD 6.8 billion to USD 9.1 billion, resulting in a value increase of USD 2.3 billion, which represents 41.1% of the total forecast growth for the decade. This phase of development will be shaped by increasing agricultural commodity exports, rising adoption of specialized anti-static and conductive FIBCs, and growing demand for safe handling solutions in pharmaceutical powder manufacturing. Chemical manufacturers are expanding their FIBC sourcing capabilities to address the growing demand for contamination-free transport, UN-certified hazardous material handling, and efficient warehouse space optimization.

FIBC Market Key Takeaways

Metric Value
Estimated Value in (2025E) USD 6.8 billion
Forecast Value in (2035F) USD 12.4 billion
Forecast CAGR (2025 to 2035) 6.2%

From 2030 to 2035, the market is forecast to grow from USD 9.1 billion to USD 12.4 billion, adding another USD 3.3 billion, which constitutes 58.9% of the overall ten-year expansion. This period is expected to be characterized by the expansion of circular economy initiatives for FIBC recycling, the integration of smart tracking technologies with RFID tags, and the development of hybrid FIBCs with enhanced moisture barrier properties. The growing adoption of automation in material handling and increasing focus on worker safety will drive demand for FIBCs with improved lifting mechanisms and certified load-bearing capabilities.

Between 2020 and 2025, the FIBC market experienced steady growth, driven by increasing global trade of agricultural commodities and growing recognition of FIBCs as cost-effective alternatives to traditional rigid packaging in bulk material handling across multiple industries. The market developed as manufacturers recognized the potential for FIBCs to reduce transportation costs while improving loading efficiency and enabling safer handling of hazardous materials. Technological advancement in polypropylene weaving processes and coating methods began emphasizing the critical importance of maintaining structural integrity and compliance with international packaging standards.

Why is the FIBC Market Growing?

Market expansion is being supported by the increasing global demand for efficient bulk packaging solutions and the corresponding need for lightweight containers that can reduce transportation costs, improve warehouse space utilization, and provide safe handling capabilities across various industrial applications. Modern chemical manufacturers are increasingly focused on implementing packaging solutions that can support hazardous material transport, enhance product protection during storage, and provide consistent performance in diverse operational environments. FIBCs' proven ability to deliver exceptional strength-to-weight ratios, customizable design features, and compliance with international transport regulations make them essential packaging solutions for contemporary industrial operations and agricultural commodity handling.

The growing emphasis on logistics efficiency and material handling optimization is driving demand for FIBCs that can support faster loading and unloading operations, reduce packaging waste, and enable automated filling systems. Manufacturers' preference for packaging that combines durability with processing efficiency and design flexibility is creating opportunities for innovative FIBC implementations. The rising influence of construction activity expansion and mining operations growth is also contributing to increased demand for FIBCs that can provide reliable containment, easy transport handling, and protection against contamination.

Opportunity Pathways - FIBC Market

The FIBC market is poised for steady growth and transformation. As industries across food processing, chemicals, construction, pharmaceuticals, and agriculture seek packaging that delivers exceptional efficiency, safety, and handling advantages, FIBCs are gaining prominence not just as commodity packaging but as strategic enablers of logistics optimization and cost reduction.

Rising agricultural exports in Asia-Pacific and expanding construction activity globally amplify demand, while manufacturers are leveraging innovations in fabric coating technologies, specialized liner systems, and certified safety features.

Pathways like specialized anti-static solutions, enhanced barrier properties, and application-specific customization promise strong margin uplift, especially in high-value segments. Geographic expansion and vertical integration will capture volume, particularly where local manufacturing capabilities and supply chain proximity are critical. Regulatory pressures around food safety, chemical transport standards, pharmaceutical handling requirements, and worker safety give structural support.

  • Pathway A - Specialized Anti-Static & Conductive FIBCs. Chemical and pharmaceutical manufacturers increasingly require FIBCs with certified electrostatic discharge prevention for handling flammable powders and sensitive materials. FIBC producers who develop Type C and Type D solutions with validated safety performance can command premium pricing. Expected revenue pool: USD 800 million to USD 1.2 billion.
  • Pathway B - Food-Grade & Hygienic FIBCs. Growing demand for certified food-contact packaging, UN-approved hygienic designs, and BRC-certified manufacturing drives need for FIBCs with validated cleanliness and contamination prevention. Opportunity: USD 900 million to USD 1.4 billion.
  • Pathway C - Liner System Integration. Advanced liner technologies including aluminum foil barriers, polyethylene moisture protection, and form-fit designs enable enhanced product protection for moisture-sensitive materials and oxygen-sensitive chemicals. Revenue lift: USD 600 million to USD 950 million.
  • Pathway D - Construction & Mining Applications. Expanding reach into aggregates transport, mineral handling, and construction waste management. Manufacturers will seek partners who supply durable, UV-resistant FIBCs with reinforced construction. Pool: USD 750 million to USD 1.1 billion.
  • Pathway E - Geographic Expansion & Regional Manufacturing. Strong growth in APAC, particularly India, China, and Southeast Asia. Local production lowers costs, reduces logistics complexity, and enables faster response to customer requirements. Expected upside: USD 1.2 billion to USD 1.8 billion.
  • Pathway F - Pharmaceutical & Nutraceutical Packaging. Increasing demand for GMP-certified FIBCs, pharmaceutical-grade materials, and validated contamination control for active pharmaceutical ingredients and supplement powders. USD 700 million to USD 1.0 billion.
  • Pathway G - Circular Economy & Recycling Programs. Developing collection systems for used FIBCs, establishing recycling infrastructure, and designing for multiple-use applications creates differentiation and addresses waste reduction requirements. Growing regulatory support and customer preferences. Pool: USD 500 million to USD 800 million.

Segmental Analysis

The market is segmented by product type, capacity, fabric type, filling method, application, and region. By product type, the market is divided into Type A (standard), Type B (anti-static), Type C (conductive), and Type D (static dissipative). By capacity, it covers below 500 kg, 500-1000 kg, 1000-1500 kg, and above 1500 kg. By fabric type, it is segmented into coated fabric and uncoated fabric. The filling method includes top filling, bottom filling, and side filling. By application, the market covers food & agriculture, chemicals & pharmaceuticals, construction & mining, and others. Based on end use loops, the market is categorized into single-trip and multi-trip. By distribution channel, the market includes direct sales, distributors, and online channels. Regionally, the market is divided into North America, Europe, East Asia, South Asia & Pacific, Latin America, and the Middle East & Africa.
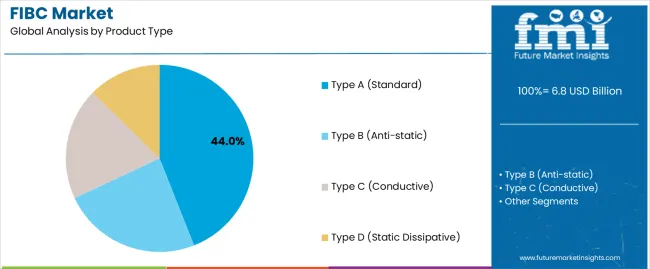
By Product Type, the Type A (Standard) FIBCs Segment Accounts for 44.0% Market Share

Fibc Market Analysis By Product Type

The Type A (standard) FIBCs segment is projected to account for 44.0% of the FIBC market in 2025, reaffirming its position as the leading product category. Agricultural commodity handlers increasingly utilize Type A FIBCs for their cost-effectiveness, reliable performance in non-hazardous material transport, and versatility across applications ranging from grain storage to fertilizer distribution. Type A FIBC technology's straightforward manufacturing process and proven durability directly address the industrial requirements for economical bulk packaging and efficient material handling in high-volume distribution environments.

This product segment forms the foundation of modern agricultural logistics operations, as it represents the FIBC type with the greatest market penetration and established demand across multiple application categories and industry sectors. Manufacturer investments in advanced weaving technologies and quality control systems continue to strengthen adoption among commodity traders. With companies prioritizing load-bearing capacity and storage efficiency, Type A FIBCs align with both operational performance requirements and cost optimization objectives, making them the central component of comprehensive bulk packaging strategies.
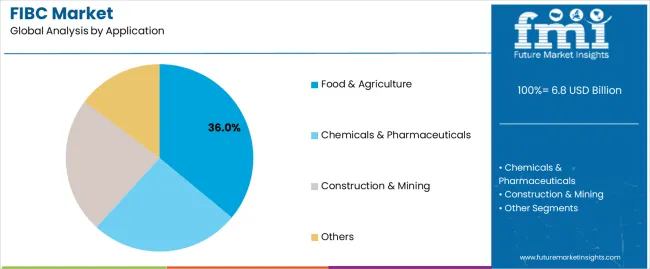
By Application, the Food & Agriculture Segment Accounts for 36.0% Market Share

Fibc Market Analysis By Application

Food & agriculture applications are projected to represent 36.0% of FIBC demand in 2025, underscoring their critical role as the primary industrial consumers of bulk packaging solutions for grain transport, seed distribution, and agricultural commodity handling. Agricultural processors prefer FIBCs for their exceptional loading efficiency, storage space optimization, and ability to maintain product integrity during transport and storage. Positioned as essential packaging for modern agricultural supply chains, FIBCs offer both economic advantages and handling efficiency benefits.

The segment is supported by continuous growth in agricultural exports and the growing availability of food-grade certified FIBCs that enable safe handling of consumable products with validated hygienic manufacturing. Additionally, agricultural cooperatives are investing in standardized FIBC specifications to support large-volume procurement and quality assurance. As global food trade becomes more prevalent and commodity handling requirements increase, food & agriculture applications will continue to dominate the end-use market while supporting efficient material distribution and product safety strategies.

What are the Drivers, Restraints, and Key Trends of the FIBC Market?

The FIBC market is advancing steadily due to increasing demand for cost-effective bulk packaging and growing adoption of efficient material handling solutions that provide weight reduction, storage optimization, and transport cost savings across diverse industrial applications. However, the market faces challenges, including competition from rigid intermediate bulk containers, concerns about single-use plastic waste, and the need for specialized manufacturing equipment investments. Innovation in fabric coating technologies and safety certification development continues to influence product development and market expansion patterns.

Expansion of Safety Certification and Compliance Standards

The growing adoption of UN certification requirements, Safe Quality Food (SQF) standards, and industry-specific safety protocols is enabling FIBC manufacturers to produce certified solutions with validated performance characteristics, enhanced safety features, and documented quality assurance. Comprehensive certification programs provide improved market access while allowing more efficient entry into regulated industries and consistent compliance across various application requirements and geographic markets. Manufacturers are increasingly recognizing the competitive advantages of certified capabilities for product differentiation and premium market positioning.

Integration of Smart Tracking and Supply Chain Visibility

Modern FIBC suppliers are incorporating RFID tags, barcode integration, and digital tracking systems to enhance inventory management, enable real-time location monitoring, and deliver value-added supply chain solutions to end users. These technologies improve operational efficiency while enabling new service models, including returnable FIBC programs, automated inventory replenishment, and predictive maintenance scheduling. Advanced tracking integration also allows manufacturers to support premium service positioning and operational transparency beyond traditional bulk packaging supply.
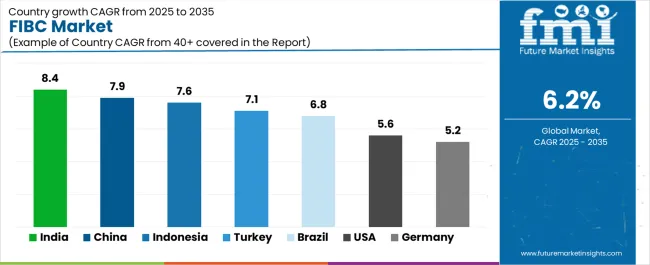
Analysis of the FIBC Market by Key Countries

Fibc Market Cagr Analysis By Country

Country CAGR (2025-2035)
India 8.4%
China 7.9%
USA 5.6%
Germany 5.2%
Brazil 6.8%
Turkey 7.1%
Indonesia 7.6%

The FIBC market is experiencing solid growth globally, with India leading at an 8.4% CAGR through 2035, driven by the expanding agricultural export sector, growing chemical manufacturing base, and significant investment in construction infrastructure development. China follows at 7.9%, supported by robust chemical production growth, increasing mining operations, and growing domestic commodity handling requirements. The USA shows growth at 5.6%, emphasizing food safety standards and specialty chemical packaging. Brazil records 6.8%, focusing on agricultural commodity exports and fertilizer distribution. Germany demonstrates 5.2% growth, prioritizing chemical industry applications and quality manufacturing standards. Turkey exhibits 7.1% growth, emphasizing construction material handling and agricultural processing. Indonesia shows 7.6% growth, supported by palm oil industry demand and construction sector expansion.

The report covers an in-depth analysis of 40+ countries top-performing countries are highlighted below.
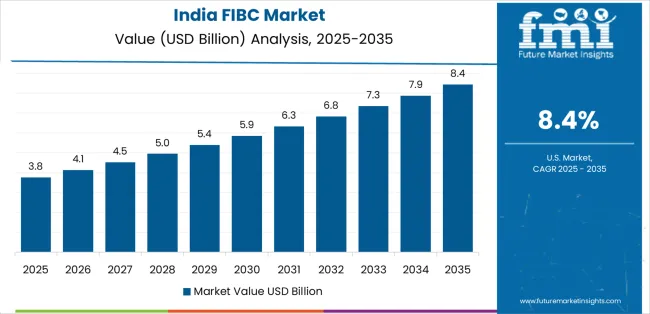
India Leads Global Market Growth with Agricultural Export Dominance

Fibc Market Country Value Analysis

Revenue from FIBCs in India is projected to exhibit exceptional growth with a CAGR of 8.4% through 2035, driven by expanding agricultural commodity exports and rapidly growing chemical manufacturing supported by government initiatives promoting domestic production capacity development. The country's dominant position in rice, wheat, and sugar exports and increasing investment in fertilizer manufacturing are creating substantial demand for efficient bulk packaging solutions. Major agricultural cooperatives and chemical manufacturers are establishing comprehensive FIBC sourcing capabilities to serve both domestic distribution and international export requirements.

  • Government support for farmer-producer organizations and agricultural infrastructure development is driving demand for standardized FIBCs throughout major grain-producing regions and commodity trading hubs.
  • Strong pharmaceutical ingredient manufacturing growth and an expanding network of specialty chemical facilities are supporting the rapid adoption of specialized FIBCs among manufacturers seeking contamination control and regulatory compliance.

China Demonstrates Strong Market Presence with Industrial Manufacturing

Revenue from FIBCs in China is expanding at a CAGR of 7.9%, supported by the country's extensive chemical production capacity, expanding mining operations, and increasing adoption of mechanized material handling solutions. The country's massive construction activity and growing demand for efficient logistics solutions are driving requirements for sophisticated FIBC capabilities. International suppliers and domestic manufacturers are establishing extensive production and distribution capabilities to address the growing demand for bulk packaging products.

  • Rising resin production and expanding mineral processing operations are creating opportunities for FIBC adoption across chemical manufacturers, mining companies, and construction material suppliers in major industrial regions.
  • Growing focus on workplace safety standards and hazardous material handling regulations is driving adoption of certified FIBCs among industrial manufacturers seeking enhanced worker protection and regulatory compliance.

USA Demonstrates Mature Market with Food Safety Focus

Revenue from FIBCs in the USA is expanding at a CAGR of 5.6%, supported by the country's stringent food safety requirements, strong emphasis on quality certification, and robust demand for specialized packaging in pharmaceutical and chemical applications. The nation's mature agricultural sector and high-value specialty chemical focus are driving sophisticated FIBC capabilities throughout the supply chain. Leading manufacturers and packaging distributors are investing extensively in certified production capabilities and traceability systems to serve both domestic and export markets.

  • Rising demand for food-grade certified FIBCs and clean room manufacturing capabilities is creating requirements for validated hygienic packaging among food processors seeking enhanced quality assurance and regulatory compliance.
  • Strong chemical industry requirements and growing emphasis on hazardous material safety are supporting adoption of specialty Type C and Type D conductive FIBCs across chemical manufacturers and pharmaceutical ingredient suppliers in major production clusters.

Brazil Focuses on Agricultural Commodity Export Growth

Revenue from FIBCs in Brazil is growing at a CAGR of 6.8%, driven by the country's leadership in agricultural commodity exports, expanding sugar and coffee production, and growing investment in fertilizer distribution infrastructure. Brazil's position as a major soybean and corn exporter and commitment to agricultural modernization are supporting demand for efficient bulk packaging solutions across multiple commodity segments. Manufacturers are establishing comprehensive distribution capabilities to serve the vast agricultural interior regions and port facilities.

  • Large-scale grain production and expanding protein meal exports are driving adoption of high-capacity FIBCs with moisture protection features among agricultural cooperatives and commodity trading companies.
  • Growing domestic fertilizer manufacturing and increasing agricultural input distribution are supporting market expansion for durable FIBCs with UV resistance throughout the country's extensive agricultural supply chain network.

Germany Emphasizes Chemical Industry and Quality Standards

Revenue from FIBCs in Germany is expanding at a CAGR of 5.2%, supported by the country's chemical industry leadership, advanced manufacturing capabilities, and strategic focus on high-quality certified packaging solutions. Germany's engineering excellence and regulatory compliance emphasis are driving demand for FIBCs in pharmaceutical ingredients, specialty chemicals, and industrial powder applications. Manufacturers are investing in comprehensive testing capabilities to serve both domestic chemical producers and international pharmaceutical markets.

  • Chemical industry concentration and stringent quality requirements are creating opportunities for FIBC adoption in active pharmaceutical ingredient handling, specialty polymer transport, and fine chemical distribution among precision manufacturers.
  • Growing emphasis on supply chain traceability and pharmaceutical good distribution practices is driving adoption of validated FIBCs with complete documentation and batch tracking capabilities throughout the country's pharmaceutical manufacturing sector.

Turkey Exhibits Construction-Driven Growth Momentum

Revenue from FIBCs in Turkey is growing at a CAGR of 7.1%, driven by the country's robust construction activity, expanding mining operations, and strategic position bridging European and Asian markets. Turkey's cement production capacity and aggregate processing infrastructure are supporting investment in efficient bulk packaging throughout major construction material supply chains. Industry participants are establishing comprehensive manufacturing capabilities to serve domestic demand and regional export opportunities.

  • Large-scale infrastructure projects and residential construction growth are creating demand for durable FIBCs in cement, sand, and aggregate transport across construction material suppliers and ready-mix concrete producers.
  • Growing mineral exports and expanding marble production are driving adoption of heavy-duty FIBCs with reinforced construction and moisture protection among mining companies and stone processing facilities throughout the country.

Indonesia Shows Palm Oil Industry-Driven Expansion

Revenue from FIBCs in Indonesia is expanding at a CAGR of 7.6%, supported by the country's palm oil industry dominance, growing construction sector, and expanding chemical manufacturing base. Indonesia's position as the world's largest palm oil producer and integrated agricultural processing capabilities are driving demand for specialized FIBCs in agricultural commodity handling and oleochemical transport applications. Leading manufacturers are investing in localized production capabilities to serve the stringent requirements of food processing and chemical industries.
  • Palm kernel meal transport and crude palm oil derivatives handling are creating requirements for food-grade FIBCs with liner systems among plantation companies and palm oil refiners throughout major production regions.
  • Strong growth in construction materials distribution and expanding cement production capacity are supporting adoption of cost-effective FIBCs throughout the country's developing infrastructure supply chain network.

Europe Market Split by Countries

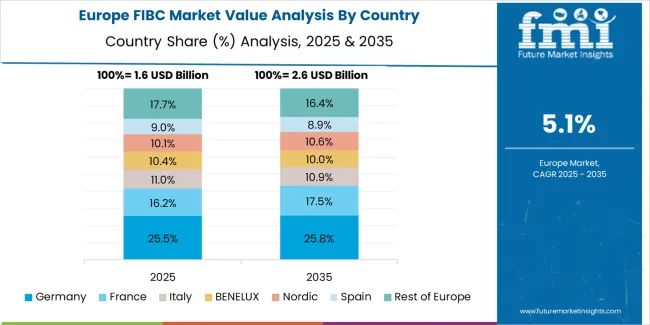
Fibc Market Europe Country Market Share Analysis, 2025 & 2035

The FIBC market in Europe is projected to grow from USD 1.4 billion in 2025 to USD 2.6 billion by 2035, registering a CAGR of 6.4% over the forecast period. Germany is expected to maintain its leadership position with a 28.0% market share in 2025, declining slightly to 27.5% by 2035, supported by its strong chemical industry, advanced manufacturing capabilities, and comprehensive industrial base serving diverse FIBC applications across Europe.

France follows with a 18.0% share in 2025, projected to reach 18.5% by 2035, driven by robust demand for FIBCs in agricultural commodity handling, chemical manufacturing, and pharmaceutical ingredient packaging, combined with established food safety standards and specialty packaging expertise. The United Kingdom holds a 15.0% share in 2025, expected to maintain 15.0% through 2035, supported by strong pharmaceutical manufacturing and growing construction materials distribution. Italy commands a 13.0% share in 2025, projected to reach 13.5% by 2035, while Spain accounts for 9.0% in 2025, expected to reach 9.5% by 2035. The Netherlands maintains a 5.5% share in 2025, growing to 6.0% by 2035. The Rest of Europe region, including Nordic countries, Eastern Europe, Belgium, Switzerland, Austria, and Poland, is anticipated to gain momentum, expanding its collective share from 11.5% to 10.0% by 2035, attributed to increasing construction activity in Eastern Europe and growing chemical manufacturing in Poland implementing efficient bulk packaging programs.
Competitive Landscape of the FIBC Market

Fibc Market Analysis By Company

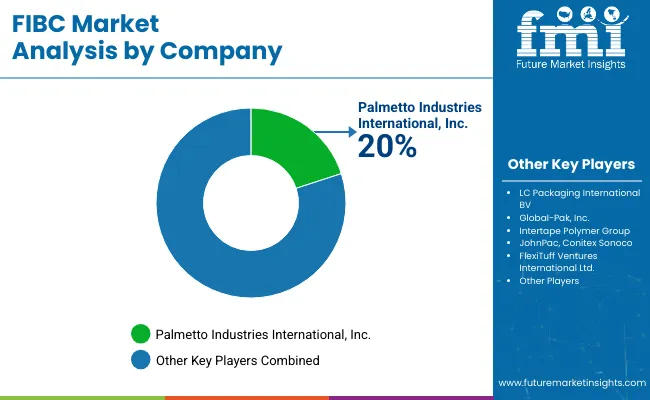
The FIBC market is characterized by competition among established packaging companies, specialized woven fabric manufacturers, and integrated polypropylene processors. Companies are investing in advanced weaving technology research, coating process optimization, quality control systems, and comprehensive product portfolios to deliver consistent, safe, and application-specific FIBC solutions. Innovation in safety certification, liner systems, and specialty fabric treatments is central to strengthening market position and competitive advantage.

Berry Global leads the market with a strong market share, offering comprehensive FIBC solutions with a focus on industrial applications and certified safety products. Greif Inc. provides specialized bulk packaging capabilities with an emphasis on multi-trip systems and circular economy models. BAG Corp delivers innovative FIBC products with a focus on food-grade certification and custom design solutions. LC Packaging specializes in agricultural and food industry FIBCs with comprehensive quality assurance. Emmbi Industries focuses on technical fabrics and specialized coatings for demanding applications. Conitex Sonoco offers diverse FIBC solutions with emphasis on chemical industry requirements and UN certification.

Key Players in the FIBC Market

  • Berry Global Inc.
  • Greif, Inc.
  • BAG Corp
  • LC Packaging International BV
  • Emmbi Industries Limited
  • Conitex Sonoco
  • Bulk Lift International
  • Taihua Group
  • Halsted Corporation
  • MiniBulk Inc.

Scope of the Report

Items Values
Quantitative Units (2025) USD 6.8 billion
Product Type Type A (Standard), Type B (Anti-static), Type C (Conductive), Type D (Static Dissipative)
Capacity Below 500 kg, 500-1000 kg, 1000-1500 kg, Above 1500 kg
Fabric Type Coated Fabric, Uncoated Fabric
Filling Method Top Filling, Bottom Filling, Side Filling
Application Food & Agriculture, Chemicals & Pharmaceuticals, Construction & Mining, Others
End Use Loops Single-trip, Multi-trip
Distribution Channel Direct Sales, Distributors, Online Channels
Regions Covered North America, Europe, East Asia, South Asia & Pacific, Latin America, Middle East & Africa
Countries Covered United States, Canada, United Kingdom, Germany, France, China, Japan, South Korea, India, Brazil, Turkey, Indonesia and 40+ countries
Key Companies Profiled Berry Global, Greif Inc., BAG Corp, LC Packaging, Emmbi Industries, and Conitex Sonoco
Additional Attributes Dollar sales by product type and application category, regional demand trends, competitive landscape, technological advancements in fabric coating systems, safety certification development, liner integration innovation, and supply chain optimization

FIBC Market by Segments

Product Type:

  • Type A (Standard)
  • Type B (Anti-static)
  • Type C (Conductive)
  • Type D (Static Dissipative)

Capacity:

  • Below 500 kg
  • 500-1000 kg
  • 1000-1500 kg
  • Above 1500 kg

Fabric Type:

  • Coated Fabric
  • Uncoated Fabric

Filling Method:

  • Top Filling
  • Bottom Filling
  • Side Filling

Application:

  • Food & Agriculture
  • Chemicals & Pharmaceuticals
  • Construction & Mining
  • Others

End Use Loops:

  • Single-trip
  • Multi-trip

Distribution Channel:

  • Direct Sales
  • Distributors
  • Online Channels

Region:

  • North America
    • United States
    • Canada
    • Mexico
  • Europe
    • Germany
    • United Kingdom
    • France
    • Italy
    • Spain
    • Nordic
    • BENELUX
    • Rest of Europe
  • East Asia
    • China
    • Japan
    • South Korea
    • Taiwan
  • South Asia & Pacific
    • India
    • ASEAN
    • Australia & New Zealand
    • Rest of South Asia & Pacific
  • Latin America
    • Brazil
    • Chile
    • Argentina
    • Rest of Latin America
  • Middle East & Africa
    • Kingdom of Saudi Arabia
    • Other GCC Countries
    • Turkey
    • South Africa
    • Other African Union
    • Rest of Middle East & Africa

Frequently Asked Questions

How big is the fibc market in 2025?

The global fibc market is estimated to be valued at USD 6.8 billion in 2025.

What will be the size of fibc market in 2035?

The market size for the fibc market is projected to reach USD 12.4 billion by 2035.

How much will be the fibc market growth between 2025 and 2035?

The fibc market is expected to grow at a 6.2% CAGR between 2025 and 2035.

What are the key product types in the fibc market?

The key product types in fibc market are type a (standard), type b (anti-static), type c (conductive) and type d (static dissipative).

Which application segment to contribute significant share in the fibc market in 2025?

In terms of application, food & agriculture segment to command 36.0% share in the fibc market in 2025.

Table of Content

  1. Executive Summary
    • Global Market Outlook
    • Demand to side Trends
    • Supply to side Trends
    • Technology Roadmap Analysis
    • Analysis and Recommendations
  2. Market Overview
    • Market Coverage / Taxonomy
    • Market Definition / Scope / Limitations
  3. Market Background
    • Market Dynamics
      • Drivers
      • Restraints
      • Opportunity
      • Trends
    • Scenario Forecast
      • Demand in Optimistic Scenario
      • Demand in Likely Scenario
      • Demand in Conservative Scenario
    • Opportunity Map Analysis
    • Product Life Cycle Analysis
    • Supply Chain Analysis
    • Investment Feasibility Matrix
    • Value Chain Analysis
    • PESTLE and Porter’s Analysis
    • Regulatory Landscape
    • Regional Parent Market Outlook
    • Production and Consumption Statistics
    • Import and Export Statistics
  4. Global Market Analysis 2020 to 2024 and Forecast, 2025 to 2035
    • Historical Market Size Value (USD Million) Analysis, 2020 to 2024
    • Current and Future Market Size Value (USD Million) Projections, 2025 to 2035
      • Y to o to Y Growth Trend Analysis
      • Absolute $ Opportunity Analysis
  5. Global Market Pricing Analysis 2020 to 2024 and Forecast 2025 to 2035
  6. Global Market Analysis 2020 to 2024 and Forecast 2025 to 2035, By Product Type
    • Introduction / Key Findings
    • Historical Market Size Value (USD Million) Analysis By Product Type , 2020 to 2024
    • Current and Future Market Size Value (USD Million) Analysis and Forecast By Product Type , 2025 to 2035
      • Type A (Standard)
      • Type B (Anti-static)
      • Type C (Conductive)
      • Type D (Static Dissipative)
    • Y to o to Y Growth Trend Analysis By Product Type , 2020 to 2024
    • Absolute $ Opportunity Analysis By Product Type , 2025 to 2035
  7. Global Market Analysis 2020 to 2024 and Forecast 2025 to 2035, By Application
    • Introduction / Key Findings
    • Historical Market Size Value (USD Million) Analysis By Application, 2020 to 2024
    • Current and Future Market Size Value (USD Million) Analysis and Forecast By Application, 2025 to 2035
      • Food & Agriculture
      • Chemicals & Pharmaceuticals
      • Construction & Mining
      • Others
    • Y to o to Y Growth Trend Analysis By Application, 2020 to 2024
    • Absolute $ Opportunity Analysis By Application, 2025 to 2035
  8. Global Market Analysis 2020 to 2024 and Forecast 2025 to 2035, By Region
    • Introduction
    • Historical Market Size Value (USD Million) Analysis By Region, 2020 to 2024
    • Current Market Size Value (USD Million) Analysis and Forecast By Region, 2025 to 2035
      • North America
      • Latin America
      • Western Europe
      • Eastern Europe
      • East Asia
      • South Asia and Pacific
      • Middle East & Africa
    • Market Attractiveness Analysis By Region
  9. North America Market Analysis 2020 to 2024 and Forecast 2025 to 2035, By Country
    • Historical Market Size Value (USD Million) Trend Analysis By Market Taxonomy, 2020 to 2024
    • Market Size Value (USD Million) Forecast By Market Taxonomy, 2025 to 2035
      • By Country
        • USA
        • Canada
        • Mexico
      • By Product Type
      • By Application
    • Market Attractiveness Analysis
      • By Country
      • By Product Type
      • By Application
    • Key Takeaways
  10. Latin America Market Analysis 2020 to 2024 and Forecast 2025 to 2035, By Country
    • Historical Market Size Value (USD Million) Trend Analysis By Market Taxonomy, 2020 to 2024
    • Market Size Value (USD Million) Forecast By Market Taxonomy, 2025 to 2035
      • By Country
        • Brazil
        • Chile
        • Rest of Latin America
      • By Product Type
      • By Application
    • Market Attractiveness Analysis
      • By Country
      • By Product Type
      • By Application
    • Key Takeaways
  11. Western Europe Market Analysis 2020 to 2024 and Forecast 2025 to 2035, By Country
    • Historical Market Size Value (USD Million) Trend Analysis By Market Taxonomy, 2020 to 2024
    • Market Size Value (USD Million) Forecast By Market Taxonomy, 2025 to 2035
      • By Country
        • Germany
        • UK
        • Italy
        • Spain
        • France
        • Nordic
        • BENELUX
        • Rest of Western Europe
      • By Product Type
      • By Application
    • Market Attractiveness Analysis
      • By Country
      • By Product Type
      • By Application
    • Key Takeaways
  12. Eastern Europe Market Analysis 2020 to 2024 and Forecast 2025 to 2035, By Country
    • Historical Market Size Value (USD Million) Trend Analysis By Market Taxonomy, 2020 to 2024
    • Market Size Value (USD Million) Forecast By Market Taxonomy, 2025 to 2035
      • By Country
        • Russia
        • Poland
        • Hungary
        • Balkan & Baltic
        • Rest of Eastern Europe
      • By Product Type
      • By Application
    • Market Attractiveness Analysis
      • By Country
      • By Product Type
      • By Application
    • Key Takeaways
  13. East Asia Market Analysis 2020 to 2024 and Forecast 2025 to 2035, By Country
    • Historical Market Size Value (USD Million) Trend Analysis By Market Taxonomy, 2020 to 2024
    • Market Size Value (USD Million) Forecast By Market Taxonomy, 2025 to 2035
      • By Country
        • China
        • Japan
        • South Korea
      • By Product Type
      • By Application
    • Market Attractiveness Analysis
      • By Country
      • By Product Type
      • By Application
    • Key Takeaways
  14. South Asia and Pacific Market Analysis 2020 to 2024 and Forecast 2025 to 2035, By Country
    • Historical Market Size Value (USD Million) Trend Analysis By Market Taxonomy, 2020 to 2024
    • Market Size Value (USD Million) Forecast By Market Taxonomy, 2025 to 2035
      • By Country
        • India
        • ASEAN
        • Australia & New Zealand
        • Rest of South Asia and Pacific
      • By Product Type
      • By Application
    • Market Attractiveness Analysis
      • By Country
      • By Product Type
      • By Application
    • Key Takeaways
  15. Middle East & Africa Market Analysis 2020 to 2024 and Forecast 2025 to 2035, By Country
    • Historical Market Size Value (USD Million) Trend Analysis By Market Taxonomy, 2020 to 2024
    • Market Size Value (USD Million) Forecast By Market Taxonomy, 2025 to 2035
      • By Country
        • Kingdom of Saudi Arabia
        • Other GCC Countries
        • Turkiye
        • South Africa
        • Other African Union
        • Rest of Middle East & Africa
      • By Product Type
      • By Application
    • Market Attractiveness Analysis
      • By Country
      • By Product Type
      • By Application
    • Key Takeaways
  16. Key Countries Market Analysis
    • USA
      • Pricing Analysis
      • Market Share Analysis, 2024
        • By Product Type
        • By Application
    • Canada
      • Pricing Analysis
      • Market Share Analysis, 2024
        • By Product Type
        • By Application
    • Mexico
      • Pricing Analysis
      • Market Share Analysis, 2024
        • By Product Type
        • By Application
    • Brazil
      • Pricing Analysis
      • Market Share Analysis, 2024
        • By Product Type
        • By Application
    • Chile
      • Pricing Analysis
      • Market Share Analysis, 2024
        • By Product Type
        • By Application
    • Germany
      • Pricing Analysis
      • Market Share Analysis, 2024
        • By Product Type
        • By Application
    • UK
      • Pricing Analysis
      • Market Share Analysis, 2024
        • By Product Type
        • By Application
    • Italy
      • Pricing Analysis
      • Market Share Analysis, 2024
        • By Product Type
        • By Application
    • Spain
      • Pricing Analysis
      • Market Share Analysis, 2024
        • By Product Type
        • By Application
    • France
      • Pricing Analysis
      • Market Share Analysis, 2024
        • By Product Type
        • By Application
    • India
      • Pricing Analysis
      • Market Share Analysis, 2024
        • By Product Type
        • By Application
    • ASEAN
      • Pricing Analysis
      • Market Share Analysis, 2024
        • By Product Type
        • By Application
    • Australia & New Zealand
      • Pricing Analysis
      • Market Share Analysis, 2024
        • By Product Type
        • By Application
    • China
      • Pricing Analysis
      • Market Share Analysis, 2024
        • By Product Type
        • By Application
    • Japan
      • Pricing Analysis
      • Market Share Analysis, 2024
        • By Product Type
        • By Application
    • South Korea
      • Pricing Analysis
      • Market Share Analysis, 2024
        • By Product Type
        • By Application
    • Russia
      • Pricing Analysis
      • Market Share Analysis, 2024
        • By Product Type
        • By Application
    • Poland
      • Pricing Analysis
      • Market Share Analysis, 2024
        • By Product Type
        • By Application
    • Hungary
      • Pricing Analysis
      • Market Share Analysis, 2024
        • By Product Type
        • By Application
    • Kingdom of Saudi Arabia
      • Pricing Analysis
      • Market Share Analysis, 2024
        • By Product Type
        • By Application
    • Turkiye
      • Pricing Analysis
      • Market Share Analysis, 2024
        • By Product Type
        • By Application
    • South Africa
      • Pricing Analysis
      • Market Share Analysis, 2024
        • By Product Type
        • By Application
  17. Market Structure Analysis
    • Competition Dashboard
    • Competition Benchmarking
    • Market Share Analysis of Top Players
      • By Regional
      • By Product Type
      • By Application
  18. Competition Analysis
    • Competition Deep Dive
      • Berry Global Inc.
        • Overview
        • Product Portfolio
        • Profitability by Market Segments (Product/Age /Sales Channel/Region)
        • Sales Footprint
        • Strategy Overview
          • Marketing Strategy
          • Product Strategy
          • Channel Strategy
      • Greif, Inc.
      • BAG Corp
      • LC Packaging International BV
      • Emmbi Industries Limited
      • Conitex Sonoco
      • Bulk Lift International
      • Taihua Group
      • Halsted Corporation
      • MiniBulk Inc.
  19. Assumptions & Acronyms Used
  20. Research Methodology

List of Tables

  • Table 1: Global Market Value (USD Million) Forecast by Region, 2020 to 2035
  • Table 2: Global Market Value (USD Million) Forecast by Product Type , 2020 to 2035
  • Table 3: Global Market Value (USD Million) Forecast by Application, 2020 to 2035
  • Table 4: North America Market Value (USD Million) Forecast by Country, 2020 to 2035
  • Table 5: North America Market Value (USD Million) Forecast by Product Type , 2020 to 2035
  • Table 6: North America Market Value (USD Million) Forecast by Application, 2020 to 2035
  • Table 7: Latin America Market Value (USD Million) Forecast by Country, 2020 to 2035
  • Table 8: Latin America Market Value (USD Million) Forecast by Product Type , 2020 to 2035
  • Table 9: Latin America Market Value (USD Million) Forecast by Application, 2020 to 2035
  • Table 10: Western Europe Market Value (USD Million) Forecast by Country, 2020 to 2035
  • Table 11: Western Europe Market Value (USD Million) Forecast by Product Type , 2020 to 2035
  • Table 12: Western Europe Market Value (USD Million) Forecast by Application, 2020 to 2035
  • Table 13: Eastern Europe Market Value (USD Million) Forecast by Country, 2020 to 2035
  • Table 14: Eastern Europe Market Value (USD Million) Forecast by Product Type , 2020 to 2035
  • Table 15: Eastern Europe Market Value (USD Million) Forecast by Application, 2020 to 2035
  • Table 16: East Asia Market Value (USD Million) Forecast by Country, 2020 to 2035
  • Table 17: East Asia Market Value (USD Million) Forecast by Product Type , 2020 to 2035
  • Table 18: East Asia Market Value (USD Million) Forecast by Application, 2020 to 2035
  • Table 19: South Asia and Pacific Market Value (USD Million) Forecast by Country, 2020 to 2035
  • Table 20: South Asia and Pacific Market Value (USD Million) Forecast by Product Type , 2020 to 2035
  • Table 21: South Asia and Pacific Market Value (USD Million) Forecast by Application, 2020 to 2035
  • Table 22: Middle East & Africa Market Value (USD Million) Forecast by Country, 2020 to 2035
  • Table 23: Middle East & Africa Market Value (USD Million) Forecast by Product Type , 2020 to 2035
  • Table 24: Middle East & Africa Market Value (USD Million) Forecast by Application, 2020 to 2035

List of Figures

  • Figure 1: Global Market Pricing Analysis
  • Figure 2: Global Market Value (USD Million) Forecast 2020-2035
  • Figure 3: Global Market Value Share and BPS Analysis by Product Type , 2025 and 2035
  • Figure 4: Global Market Y to o to Y Growth Comparison by Product Type , 2025-2035
  • Figure 5: Global Market Attractiveness Analysis by Product Type
  • Figure 6: Global Market Value Share and BPS Analysis by Application, 2025 and 2035
  • Figure 7: Global Market Y to o to Y Growth Comparison by Application, 2025-2035
  • Figure 8: Global Market Attractiveness Analysis by Application
  • Figure 9: Global Market Value (USD Million) Share and BPS Analysis by Region, 2025 and 2035
  • Figure 10: Global Market Y to o to Y Growth Comparison by Region, 2025-2035
  • Figure 11: Global Market Attractiveness Analysis by Region
  • Figure 12: North America Market Incremental Dollar Opportunity, 2025-2035
  • Figure 13: Latin America Market Incremental Dollar Opportunity, 2025-2035
  • Figure 14: Western Europe Market Incremental Dollar Opportunity, 2025-2035
  • Figure 15: Eastern Europe Market Incremental Dollar Opportunity, 2025-2035
  • Figure 16: East Asia Market Incremental Dollar Opportunity, 2025-2035
  • Figure 17: South Asia and Pacific Market Incremental Dollar Opportunity, 2025-2035
  • Figure 18: Middle East & Africa Market Incremental Dollar Opportunity, 2025-2035
  • Figure 19: North America Market Value Share and BPS Analysis by Country, 2025 and 2035
  • Figure 20: North America Market Value Share and BPS Analysis by Product Type , 2025 and 2035
  • Figure 21: North America Market Y to o to Y Growth Comparison by Product Type , 2025-2035
  • Figure 22: North America Market Attractiveness Analysis by Product Type
  • Figure 23: North America Market Value Share and BPS Analysis by Application, 2025 and 2035
  • Figure 24: North America Market Y to o to Y Growth Comparison by Application, 2025-2035
  • Figure 25: North America Market Attractiveness Analysis by Application
  • Figure 26: Latin America Market Value Share and BPS Analysis by Country, 2025 and 2035
  • Figure 27: Latin America Market Value Share and BPS Analysis by Product Type , 2025 and 2035
  • Figure 28: Latin America Market Y to o to Y Growth Comparison by Product Type , 2025-2035
  • Figure 29: Latin America Market Attractiveness Analysis by Product Type
  • Figure 30: Latin America Market Value Share and BPS Analysis by Application, 2025 and 2035
  • Figure 31: Latin America Market Y to o to Y Growth Comparison by Application, 2025-2035
  • Figure 32: Latin America Market Attractiveness Analysis by Application
  • Figure 33: Western Europe Market Value Share and BPS Analysis by Country, 2025 and 2035
  • Figure 34: Western Europe Market Value Share and BPS Analysis by Product Type , 2025 and 2035
  • Figure 35: Western Europe Market Y to o to Y Growth Comparison by Product Type , 2025-2035
  • Figure 36: Western Europe Market Attractiveness Analysis by Product Type
  • Figure 37: Western Europe Market Value Share and BPS Analysis by Application, 2025 and 2035
  • Figure 38: Western Europe Market Y to o to Y Growth Comparison by Application, 2025-2035
  • Figure 39: Western Europe Market Attractiveness Analysis by Application
  • Figure 40: Eastern Europe Market Value Share and BPS Analysis by Country, 2025 and 2035
  • Figure 41: Eastern Europe Market Value Share and BPS Analysis by Product Type , 2025 and 2035
  • Figure 42: Eastern Europe Market Y to o to Y Growth Comparison by Product Type , 2025-2035
  • Figure 43: Eastern Europe Market Attractiveness Analysis by Product Type
  • Figure 44: Eastern Europe Market Value Share and BPS Analysis by Application, 2025 and 2035
  • Figure 45: Eastern Europe Market Y to o to Y Growth Comparison by Application, 2025-2035
  • Figure 46: Eastern Europe Market Attractiveness Analysis by Application
  • Figure 47: East Asia Market Value Share and BPS Analysis by Country, 2025 and 2035
  • Figure 48: East Asia Market Value Share and BPS Analysis by Product Type , 2025 and 2035
  • Figure 49: East Asia Market Y to o to Y Growth Comparison by Product Type , 2025-2035
  • Figure 50: East Asia Market Attractiveness Analysis by Product Type
  • Figure 51: East Asia Market Value Share and BPS Analysis by Application, 2025 and 2035
  • Figure 52: East Asia Market Y to o to Y Growth Comparison by Application, 2025-2035
  • Figure 53: East Asia Market Attractiveness Analysis by Application
  • Figure 54: South Asia and Pacific Market Value Share and BPS Analysis by Country, 2025 and 2035
  • Figure 55: South Asia and Pacific Market Value Share and BPS Analysis by Product Type , 2025 and 2035
  • Figure 56: South Asia and Pacific Market Y to o to Y Growth Comparison by Product Type , 2025-2035
  • Figure 57: South Asia and Pacific Market Attractiveness Analysis by Product Type
  • Figure 58: South Asia and Pacific Market Value Share and BPS Analysis by Application, 2025 and 2035
  • Figure 59: South Asia and Pacific Market Y to o to Y Growth Comparison by Application, 2025-2035
  • Figure 60: South Asia and Pacific Market Attractiveness Analysis by Application
  • Figure 61: Middle East & Africa Market Value Share and BPS Analysis by Country, 2025 and 2035
  • Figure 62: Middle East & Africa Market Value Share and BPS Analysis by Product Type , 2025 and 2035
  • Figure 63: Middle East & Africa Market Y to o to Y Growth Comparison by Product Type , 2025-2035
  • Figure 64: Middle East & Africa Market Attractiveness Analysis by Product Type
  • Figure 65: Middle East & Africa Market Value Share and BPS Analysis by Application, 2025 and 2035
  • Figure 66: Middle East & Africa Market Y to o to Y Growth Comparison by Application, 2025-2035
  • Figure 67: Middle East & Africa Market Attractiveness Analysis by Application
  • Figure 68: Global Market - Tier Structure Analysis
  • Figure 69: Global Market - Company Share Analysis
Dashboard
Dashboard
Dashboard
Dashboard
Dashboard
Dashboard

Full Research Suite comprises of:

Market outlook & trends analysis

Market outlook & trends analysis

Interviews & case studies

Interviews & case studies

Strategic recommendations

Strategic recommendations

Vendor profiles & capabilities analysis

Vendor profiles & capabilities analysis

5-year forecasts

5-year forecasts

8 regions and 60+ country-level data splits

8 regions and 60+ country-level data splits

Market segment data splits

Market segment data splits

12 months of continuous data updates

12 months of continuous data updates

DELIVERED AS:

PDF EXCEL ONLINE

Full Research Suite


$5000

$7500

$10000

Buy Report Now
Similar Industry Reports

Similar Industry Reports

FIBC Industry Analysis in Japan

FIBC Industry Analysis in Japan Size and Share Forecast Outlook 2025 to 2035

FIBC (Flexible Intermediate Bulk Container) Market Share Analysis

Market Share Distribution Among FIBC (Flexible Intermediate Bulk Container) Manufacturers

2 Loop FIBC Bags Market

2 Loop FIBC Bags Market Size and Share Forecast Outlook 2025 to 2035

4-Loop FIBC Market
4-Loop FIBC Market

4-Loop FIBC Market Growth - Size, Demand & Forecast 2025 to 2035

2 Loop FIBC Bags Market Share Analysis

Breaking Down Market Share in 2 Loop FIBC Bags

4-Loop FIBC Market Share Analysis

Competitive Landscape of 4-Loop FIBC Providers

Ventilated FIBC Market

Ventilated FIBC Market Size, Share & Forecast 2025 to 2035

Future Market Insights

FIBC Market

Chat With MaRIA

Chat With

MaRIA

Hi There, I am MaRIA, Your Market Research Intelligence Assistant. How may I help you?