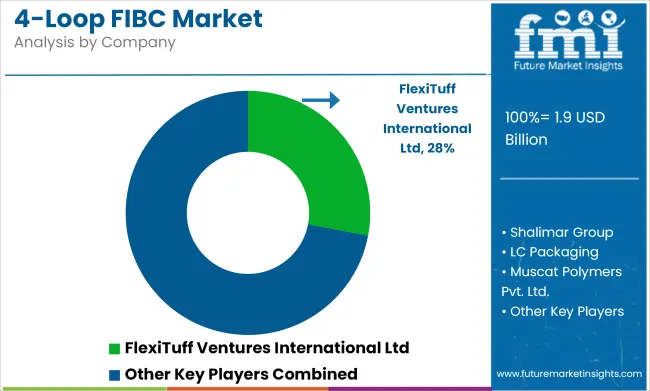
4-Loop FIBC Market Snapshot (2023 to 2033)

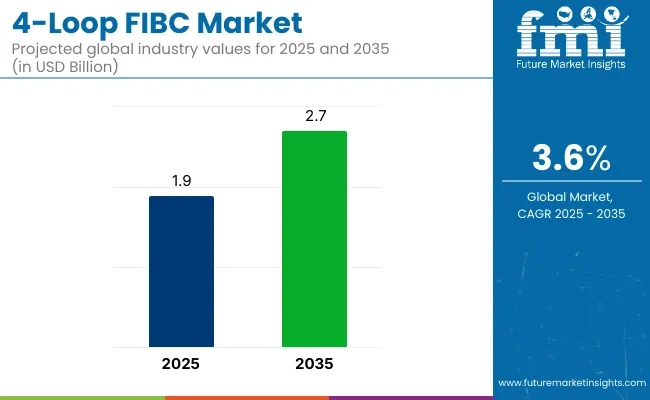
The global 4-loop FIBC market size is expected to be valued at US$ 18.1 billion in 2023. Adaptability to automated systems, bolsters the overall scope for 4-loop FIBC market, which is projected to grow at a CAGR of 4.0% between 2023 and 2033, totaling around US$ 26.9 billion by 2033.

Data Points Key Statistics
4-Loop FIBC Market Value 2023 US$ 18.1 billion
4-Loop FIBC Market Projected Value (2033) US$ 26.9 billion
4-Loop FIBC Market CAGR (2023 to 2033) 4.0%

Enhanced safety features in 4-loop FIBCs (Flexible Intermediate Bulk Containers) represent a significant advancement in packaging technology, catering to the diverse needs of industries and applications where safety and protection are paramount. The features have gained prominence due to the growing emphasis on workplace safety, regulatory compliance, and the need to mitigate potential hazards associated with bulk material transportation and storage.

Industries dealing with flammable or explosive materials, such as chemicals, pharmaceuticals, and electronics, require packaging that can prevent static electricity buildup. Anti-static 4-loop FIBCs are designed to dissipate static charges, minimizing the risk of sparks that could lead to ignition. The feature enhances worker safety and reduces the potential for accidents in environments where static electricity can pose a significant danger.

For applications where bulk materials need to be stored or transported outdoors, exposure to ultraviolet (UV) radiation can degrade the structural integrity of traditional FIBCs over time. UV-resistant 4-loop FIBCs are engineered to withstand prolonged sun exposure, maintaining their strength and durability, which makes them suitable for construction, agriculture, and other industries where outdoor storage and transportation are common.

Industries dealing with combustible materials or operating in environments with elevated fire risks, such as construction, chemicals, and mining, benefit from flame-retardant 4-loop FIBCs. The containers are designed to inhibit the spread of flames and combustion, providing an added layer of protection against fire hazards.

Don't pay for what you don't need

Customize your report by selecting specific countries or regions and save 30%!

Global 4-Loop FIBC Market Historical Analysis (2018 To 2022) Vs. Forecast Outlook (2023 To 2033)

The global demand for 4-loop FIBC increased at a CAGR of 2.2% during the forecast period between 2018 and 2022, reaching a total of US$ 26.9 billion in 2033.

According to Future Market Insights, a market research and competitive intelligence provider, the 4-loop FIBC market was valued at US$ 17.4 billion in 2022.

The integration of 4-loop FIBCs with automated material handling systems represents a significant advancement in the logistics and supply chain operations of various industries. The trend is driven by the need for increased efficiency, reduced labor costs, enhanced productivity, and improved safety in material transportation, storage, and distribution.

Automated material handling systems enable seamless and precise movement of 4-loop FIBCs within a facility or along a production line, which minimizes delays, bottlenecks, and manual errors associated with traditional material handling methods.

Automation enhances the speed and accuracy of material handling processes. 4-loop FIBCs, when integrated with automated systems, can be efficiently loaded, transported, and unloaded, reducing handling time and optimizing overall workflow.

Automated material handling systems significantly reduce the reliance on manual labor for tasks such as loading, unloading, and transferring 4-loop FIBCs, which results in cost savings associated with labor, as well as decreased potential for worker injuries.

Automated systems ensure consistent and precise handling of 4-loop FIBCs, minimizing the risk of human error and product damage, which is especially crucial for industries dealing with sensitive or hazardous materials.

Factors Driving the Market for 4-Loop FIBC

eCommerce and Logistics is Likely to be Beneficial for Market Growth

The rapid growth of e-commerce and online retail has brought about a fundamental shift in the way goods are packaged, transported, and delivered. The transformation has led to an increased demand for packaging solutions that are not only efficient but also secure, especially when it comes to bulk materials. 4-loop FIBCs are emerging as a valuable tool to optimize the e-commerce and logistics landscape.

4-loop FIBCs are designed for easy handling and storage, making them well-suited for the dynamic and fast-paced environment of e-commerce fulfillment centers and warehouses. Their large capacity allows for the consolidation of multiple smaller units into a single container, optimizing space utilization.

E-commerce often involves the movement of bulk materials, whether it's for shipping products from manufacturers to distribution centers or from distribution centers to end customers. 4-loop FIBCs provide a convenient and efficient means of transporting larger quantities of goods in a single container.

4-loop FIBCs can be customized to meet the specific requirements of different products and industries. They are available in various sizes, capacities, and specifications, allowing e-commerce businesses to tailor the packaging to their needs.

Rise of Specialty Chemicals and Pharmaceuticals to Fuel the Market Growth

The rise of specialty chemicals and pharmaceutical industries has brought about unique challenges and requirements in terms of packaging and transportation of their products. The industries deal with a wide range of sensitive and valuable materials, including chemicals, pharmaceutical ingredients, and hazardous substances, which necessitate specialized packaging solutions that ensure safety, security, and efficiency. 4-loop FIBCs have emerged as a valuable asset, offering tailored designs and features that cater to the distinct needs of these sectors.

Specialty chemicals and pharmaceuticals often require containment solutions that prevent cross-contamination, spills, and leaks during transportation and storage. 4-loop FIBCs are designed with reinforced seams, robust construction, and secure closure mechanisms to ensure the safe containment of these sensitive materials.

Some specialty chemicals and pharmaceuticals are classified as hazardous materials due to their potential risks to health, safety, and the environment. 4-loop FIBCs can be customized with features such as anti-static properties and UV resistance to mitigate these risks and ensure compliance with regulatory standards.

4-loop FIBCs can be designed and customized to accommodate the specific characteristics of specialty chemicals and pharmaceuticals, which includes considerations such as material compatibility, weight distribution, and protection against external factors like moisture and contamination.

Ismail Sutaria
Ismail Sutaria

Principal Consultant

Talk to Analyst

Find your sweet spots for generating winning opportunities in this market.

Category-wise Insights

Spout Top and Spout Bottom to Take the Lion’s Share

By filling & discharge, spout top & spout bottom segment is estimated to be the leading segment at a CAGR of 3.9% during the forecast period.

The spout top and spout bottom configuration of 4-loop FIBCs allows for efficient and controlled loading and unloading of materials. The presence of spouts facilitates the controlled release of contents, reducing the risk of spills, waste, and manual handling.

The configuration is particularly suitable for applications where precise dispensing of materials is required. The spout design enables accurate and controlled pouring of contents, making it ideal for processes that demand accurate measurements.

Spout top and spout bottom FIBCs contribute to a dust-free working environment during filling and discharge. The controlled flow of materials through the spout minimizes airborne particles, enhancing worker safety and hygiene.

The spout top and spout bottom design minimizes the exposure of materials to external contaminants during loading and unloading, which is crucial for industries dealing with sensitive or hazardous materials.

Many industries utilize automated filling and discharge systems. The spout top and spout bottom configuration is well-suited for integration into automated equipment, streamlining the handling process and increasing operational efficiency.

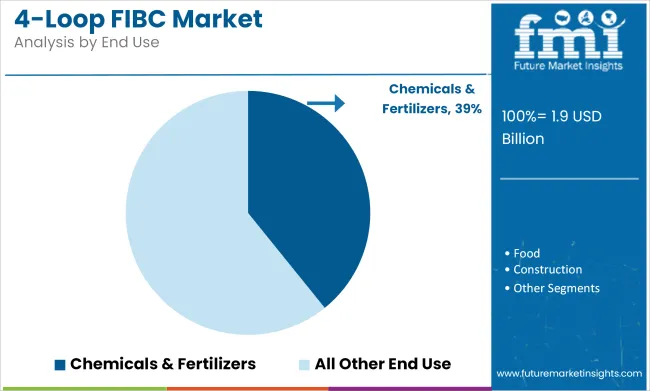
Chemicals & Fertilizers to be the Most Lucrative End Use Segment

By end use, chemicals & fertilizers segment is estimated to be the leading segment at a CAGR of 3.9% during the forecast period.

The chemicals and fertilizers industry involves the handling of a wide range of raw materials, including powders, granules, and pellets. 4-loop FIBCs provide a versatile and efficient solution for the bulk transportation and storage of these materials.

Many chemicals and fertilizers are sensitive to moisture, contaminants, and external elements. 4-loop FIBCs are designed to protect the contents from environmental factors, ensuring product integrity during storage, transportation, and handling.

The chemicals industry often deals with hazardous materials that require special handling and containment. 4-loop FIBCs with advanced safety features, such as antistatic properties and flame retardancy, contribute to safe material handling and prevent accidents.

The chemicals and fertilizers sector is subject to strict regulations related to packaging, labeling, and transportation of materials. 4-loop FIBCs can be customized to meet these regulatory requirements, ensuring compliance and preventing legal issues.

Region-wise Insights

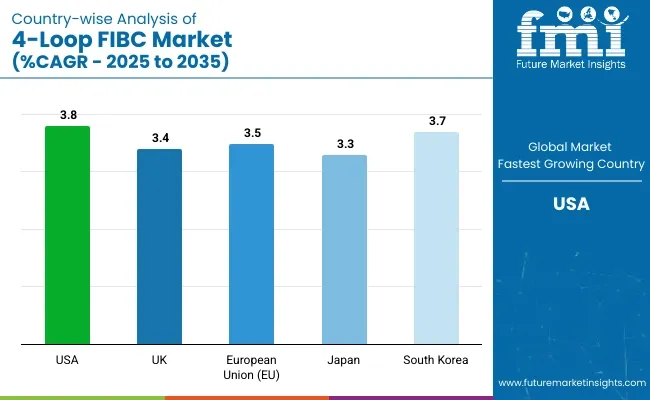
The United States to Hold the Major Share

During the projection period, the demand for 4-loop FIBC bags in North America is likely to remain the highest in terms of both value and volume. The United States is predicted to have the largest 4-loop FIBC market share, while Canada is expected to rise significantly throughout the projection period.

During the forecast period, the Europe 4- loop FIBC market is predicted to closely follow the North America 4- loop FIBC market in terms of market size. During the projected period, the Asia Pacific 4 – loop FIBC is predicted to see considerable growth in terms of both volume and sales of 4- loop FIBC.

The global 4-loop FIBC market has a lot of room for growth in countries like India, China, and Brazil, as well as the ASEAN region. Sales of 4-loop FIBC have risen, as the items being carried are better protected, and procurement is easier. The region is expected to hold a CAGR of 3.9% over the analysis period.

Get the data you need at a Fraction of the cost

Personalize your report by choosing insights you need
and save 40%!

Competitive Landscape

Key players in the 4-loop FIBC market are strongly focusing on profit generation from their existing product portfolios along while exploring potential new applications. The players are emphasizing on increasing their 4-loop FIBC production capacities, to cater to the demand from numerous end use industries. Prominent players are also pushing for geographical expansion to decrease the dependency on imported 4-loop FIBC.

Recent Developments

  • In 2023, Alpine FIBC acquired Shalimar Group, a leading manufacturer of 4-Loop FIBCs in India.
  • In the same year, LC Packaging launched its new line of sustainable 4-Loop FIBCs made from recycled materials.
  • In 2022, LARE FIBC introduced its new line of high-performance 4-Loop FIBCs for the construction industry.
  • In the same year, Umasree Texplast launched its new line of 4-Loop FIBCs for the food and beverage industry.
  • In 2021, ATEA introduced its new line of 4-Loop FIBCs for the mining industry.

Scope of the Report

Attribute Details
Forecast Period 2023 to 2033
Historical Data Available for 2018 to 2022
Market Analysis US$ Billion for value and Tons for Volume
Key Regions Covered North America, Latin America, Western Europe, Eastern Europe, South Asia & Pacific, East Asia, and Middle East & Africa
Key Countries Covered United States, Canada, Brazil, Mexico, Germany, UK, France, Spain, Italy, Poland, Russia, Czech Republic, Romania, India, Bangladesh, Australia, New Zealand, China, Japan, South Korea, GCC Countries, South Africa, Israel.
Key Segments Covered Capacity, Filling & Discharge, End Use, and Region
Key Companies Profiled
  • FlexiTuff Ventures International Ltd
  • ALPINE FIBC PVT.LTD
  • Shalimar Group
  • LC Packaging
  • Muscat Polymers Pvt. Ltd.
  • LARE FIBC
  • CHK Manufacturing Inc.
  • Bulk Corp International
  • TechnoPac GmbH
  • Yuze Pack Limited
Report Coverage Market Forecast, brand share analysis, competition intelligence, DROT analysis, Market Dynamics and Challenges, Strategic Growth Initiatives
Customization & Pricing Available upon Request

Key Segments Profiled In The Global 4-Loop FIBC Market

By Capacity:

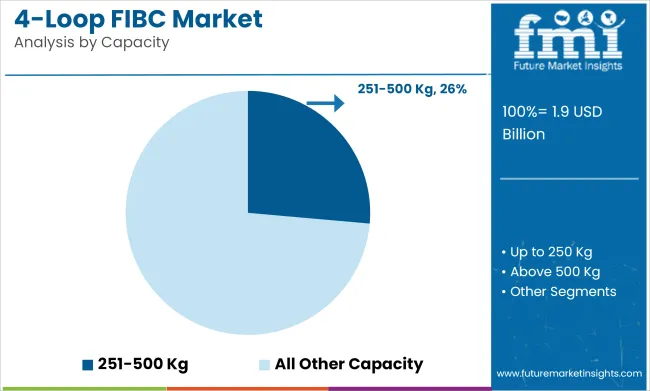
  • Up to 250 Kg
  • 251-500 Kg
  • Above 500 Kg

By Filling & Discharge:

  • Open Top & Flat Bottom
  • Duffle Top & Flat Bottom
  • Open Top & Spout Bottom
  • Spout Top & Spout Bottom
  • Spout Top & Flat Bottom

By End Use:

  • Chemicals & Fertilizers
  • Food
  • Construction
  • Agriculture

Region:

  • North America
  • Latin America
  • Western Europe
  • Eastern Europe
  • South Asia and Pacific
  • East Asia
  • Middle East and Africa (MEA)

Frequently Asked Questions

What is the Size of the Global 4-Loop FIBC Market?

The global market value is likely to be around US$ 18.1 billion in 2023.

What is the Future Scope for the 4-Loop FIBC Market?

4-Loop FIBC demand is expected to rise at 4% CAGR through 2033.

What will be the Global 4-Loop FIBC Industry Size in the Next Ten Years?

The global industry is forecasted to accrue US$ 26.9 billion by 2033.

What is the Contribution of the United States in the Global 4-Loop FIBC Market?

The United States is the leading market that could exhibit a 3.9% CAGR through 2033.

Which Segment is Going to Augment the Global 4-Loop FIBC Market?

Spout top and spout bottom segment could augment the market surging at 3.9% CAGR through 2033.

Table of Content
1. Executive Summary

    1.1. Global Market Outlook

    1.2. Demand-side Trends

    1.3. Supply-side Trends

    1.4. Technology Roadmap Analysis

    1.5. Analysis and Recommendations

2. Market Overview

    2.1. Market Coverage / Taxonomy

    2.2. Market Definition / Scope / Limitations

3. Market Background

    3.1. Market Dynamics

        3.1.1. Drivers

        3.1.2. Restraints

        3.1.3. Opportunity

        3.1.4. Trends

    3.2. Scenario Forecast

        3.2.1. Demand in Optimistic Scenario

        3.2.2. Demand in Likely Scenario

        3.2.3. Demand in Conservative Scenario

    3.3. Opportunity Map Analysis

    3.4. Product Life Cycle Analysis

    3.5. Supply Chain Analysis

        3.5.1. Supply Side Participants and their Roles

            3.5.1.1. Producers

            3.5.1.2. Mid-Level Participants (Traders/ Agents/ Brokers)

            3.5.1.3. Wholesalers and Distributors

        3.5.2. Value Added and Value Created at Node in the Supply Chain

        3.5.3. List of Raw Material Suppliers

        3.5.4. List of Existing and Potential Buyer’s

    3.6. Investment Feasibility Matrix

    3.7. Value Chain Analysis

        3.7.1. Profit Margin Analysis

        3.7.2. Wholesalers and Distributors

        3.7.3. Retailers

    3.8. PESTLE and Porter’s Analysis

    3.9. Regulatory Landscape

        3.9.1. By Key Regions

        3.9.2. By Key Countries

    3.10. Regional Parent Market Outlook

    3.11. Production and Consumption Statistics

    3.12. Import and Export Statistics

4. Global Market Analysis 2018 to 2022 and Forecast, 2023 to 2033

    4.1. Historical Market Size Value (US$ Million) & Volume (Units) Analysis, 2018 to 2022

    4.2. Current and Future Market Size Value (US$ Million) & Volume (Units) Projections, 2023 to 2033

        4.2.1. Y-o-Y Growth Trend Analysis

        4.2.2. Absolute $ Opportunity Analysis

5. Global Market Analysis 2018 to 2022 and Forecast 2023 to 2033, By Capacity

    5.1. Introduction / Key Findings

    5.2. Historical Market Size Value (US$ Million) & Volume (Units) Analysis By Capacity, 2018 to 2022

    5.3. Current and Future Market Size Value (US$ Million) & Volume (Units) Analysis and Forecast By Capacity, 2023 to 2033

        5.3.1. Up to 250 Kg

        5.3.2. 251-500 Kg

        5.3.3. Above 500 Kg

    5.4. Y-o-Y Growth Trend Analysis By Capacity, 2018 to 2022

    5.5. Absolute $ Opportunity Analysis By Capacity, 2023 to 2033

6. Global Market Analysis 2018 to 2022 and Forecast 2023 to 2033, By Filling and Discharge

    6.1. Introduction / Key Findings

    6.2. Historical Market Size Value (US$ Million) & Volume (Units) Analysis By Filling and Discharge, 2018 to 2022

    6.3. Current and Future Market Size Value (US$ Million) & Volume (Units) Analysis and Forecast By Filling and Discharge, 2023 to 2033

        6.3.1. Open Top & Flat Bottom

        6.3.2. Duffle Top & Flat Bottom

        6.3.3. Open Top & Spout Bottom

        6.3.4. Spout Top & Spout Bottom

        6.3.5. Spout Top & Flat Bottom

    6.4. Y-o-Y Growth Trend Analysis By Filling and Discharge, 2018 to 2022

    6.5. Absolute $ Opportunity Analysis By Filling and Discharge, 2023 to 2033

7. Global Market Analysis 2018 to 2022 and Forecast 2023 to 2033, By End Use

    7.1. Introduction / Key Findings

    7.2. Historical Market Size Value (US$ Million) & Volume (Units) Analysis By End Use, 2018 to 2022

    7.3. Current and Future Market Size Value (US$ Million) & Volume (Units) Analysis and Forecast By End Use, 2023 to 2033

        7.3.1. Chemicals & Fertilizers

        7.3.2. Food

        7.3.3. Construction

        7.3.4. Agriculture

    7.4. Y-o-Y Growth Trend Analysis By End Use, 2018 to 2022

    7.5. Absolute $ Opportunity Analysis By End Use, 2023 to 2033

8. Global Market Analysis 2018 to 2022 and Forecast 2023 to 2033, By Region

    8.1. Introduction

    8.2. Historical Market Size Value (US$ Million) & Volume (Units) Analysis By Region, 2018 to 2022

    8.3. Current Market Size Value (US$ Million) & Volume (Units) Analysis and Forecast By Region, 2023 to 2033

        8.3.1. North America

        8.3.2. Latin America

        8.3.3. Western Europe

        8.3.4. Eastern Europe

        8.3.5. South Asia and Pacific

        8.3.6. East Asia

        8.3.7. Middle East and Africa

    8.4. Market Attractiveness Analysis By Region

9. North America Market Analysis 2018 to 2022 and Forecast 2023 to 2033, By Country

    9.1. Historical Market Size Value (US$ Million) & Volume (Units) Trend Analysis By Market Taxonomy, 2018 to 2022

    9.2. Market Size Value (US$ Million) & Volume (Units) Forecast By Market Taxonomy, 2023 to 2033

        9.2.1. By Country

            9.2.1.1. USA

            9.2.1.2. Canada

        9.2.2. By Capacity

        9.2.3. By Filling and Discharge

        9.2.4. By End Use

    9.3. Market Attractiveness Analysis

        9.3.1. By Country

        9.3.2. By Capacity

        9.3.3. By Filling and Discharge

        9.3.4. By End Use

    9.4. Key Takeaways

10. Latin America Market Analysis 2018 to 2022 and Forecast 2023 to 2033, By Country

    10.1. Historical Market Size Value (US$ Million) & Volume (Units) Trend Analysis By Market Taxonomy, 2018 to 2022

    10.2. Market Size Value (US$ Million) & Volume (Units) Forecast By Market Taxonomy, 2023 to 2033

        10.2.1. By Country

            10.2.1.1. Brazil

            10.2.1.2. Mexico

            10.2.1.3. Rest of Latin America

        10.2.2. By Capacity

        10.2.3. By Filling and Discharge

        10.2.4. By End Use

    10.3. Market Attractiveness Analysis

        10.3.1. By Country

        10.3.2. By Capacity

        10.3.3. By Filling and Discharge

        10.3.4. By End Use

    10.4. Key Takeaways

11. Western Europe Market Analysis 2018 to 2022 and Forecast 2023 to 2033, By Country

    11.1. Historical Market Size Value (US$ Million) & Volume (Units) Trend Analysis By Market Taxonomy, 2018 to 2022

    11.2. Market Size Value (US$ Million) & Volume (Units) Forecast By Market Taxonomy, 2023 to 2033

        11.2.1. By Country

            11.2.1.1. Germany

            11.2.1.2. UK

            11.2.1.3. France

            11.2.1.4. Spain

            11.2.1.5. Italy

            11.2.1.6. Rest of Western Europe

        11.2.2. By Capacity

        11.2.3. By Filling and Discharge

        11.2.4. By End Use

    11.3. Market Attractiveness Analysis

        11.3.1. By Country

        11.3.2. By Capacity

        11.3.3. By Filling and Discharge

        11.3.4. By End Use

    11.4. Key Takeaways

12. Eastern Europe Market Analysis 2018 to 2022 and Forecast 2023 to 2033, By Country

    12.1. Historical Market Size Value (US$ Million) & Volume (Units) Trend Analysis By Market Taxonomy, 2018 to 2022

    12.2. Market Size Value (US$ Million) & Volume (Units) Forecast By Market Taxonomy, 2023 to 2033

        12.2.1. By Country

            12.2.1.1. Poland

            12.2.1.2. Russia

            12.2.1.3. Czech Republic

            12.2.1.4. Romania

            12.2.1.5. Rest of Eastern Europe

        12.2.2. By Capacity

        12.2.3. By Filling and Discharge

        12.2.4. By End Use

    12.3. Market Attractiveness Analysis

        12.3.1. By Country

        12.3.2. By Capacity

        12.3.3. By Filling and Discharge

        12.3.4. By End Use

    12.4. Key Takeaways

13. South Asia and Pacific Market Analysis 2018 to 2022 and Forecast 2023 to 2033, By Country

    13.1. Historical Market Size Value (US$ Million) & Volume (Units) Trend Analysis By Market Taxonomy, 2018 to 2022

    13.2. Market Size Value (US$ Million) & Volume (Units) Forecast By Market Taxonomy, 2023 to 2033

        13.2.1. By Country

            13.2.1.1. India

            13.2.1.2. Bangladesh

            13.2.1.3. Australia

            13.2.1.4. New Zealand

            13.2.1.5. Rest of South Asia and Pacific

        13.2.2. By Capacity

        13.2.3. By Filling and Discharge

        13.2.4. By End Use

    13.3. Market Attractiveness Analysis

        13.3.1. By Country

        13.3.2. By Capacity

        13.3.3. By Filling and Discharge

        13.3.4. By End Use

    13.4. Key Takeaways

14. East Asia Market Analysis 2018 to 2022 and Forecast 2023 to 2033, By Country

    14.1. Historical Market Size Value (US$ Million) & Volume (Units) Trend Analysis By Market Taxonomy, 2018 to 2022

    14.2. Market Size Value (US$ Million) & Volume (Units) Forecast By Market Taxonomy, 2023 to 2033

        14.2.1. By Country

            14.2.1.1. China

            14.2.1.2. Japan

            14.2.1.3. South Korea

        14.2.2. By Capacity

        14.2.3. By Filling and Discharge

        14.2.4. By End Use

    14.3. Market Attractiveness Analysis

        14.3.1. By Country

        14.3.2. By Capacity

        14.3.3. By Filling and Discharge

        14.3.4. By End Use

    14.4. Key Takeaways

15. Middle East and Africa Market Analysis 2018 to 2022 and Forecast 2023 to 2033, By Country

    15.1. Historical Market Size Value (US$ Million) & Volume (Units) Trend Analysis By Market Taxonomy, 2018 to 2022

    15.2. Market Size Value (US$ Million) & Volume (Units) Forecast By Market Taxonomy, 2023 to 2033

        15.2.1. By Country

            15.2.1.1. GCC Countries

            15.2.1.2. South Africa

            15.2.1.3. Israel

            15.2.1.4. Rest of MEA

        15.2.2. By Capacity

        15.2.3. By Filling and Discharge

        15.2.4. By End Use

    15.3. Market Attractiveness Analysis

        15.3.1. By Country

        15.3.2. By Capacity

        15.3.3. By Filling and Discharge

        15.3.4. By End Use

    15.4. Key Takeaways

16. Key Countries Market Analysis

    16.1. USA

        16.1.1. Pricing Analysis

        16.1.2. Market Share Analysis, 2022

            16.1.2.1. By Capacity

            16.1.2.2. By Filling and Discharge

            16.1.2.3. By End Use

    16.2. Canada

        16.2.1. Pricing Analysis

        16.2.2. Market Share Analysis, 2022

            16.2.2.1. By Capacity

            16.2.2.2. By Filling and Discharge

            16.2.2.3. By End Use

    16.3. Brazil

        16.3.1. Pricing Analysis

        16.3.2. Market Share Analysis, 2022

            16.3.2.1. By Capacity

            16.3.2.2. By Filling and Discharge

            16.3.2.3. By End Use

    16.4. Mexico

        16.4.1. Pricing Analysis

        16.4.2. Market Share Analysis, 2022

            16.4.2.1. By Capacity

            16.4.2.2. By Filling and Discharge

            16.4.2.3. By End Use

    16.5. Germany

        16.5.1. Pricing Analysis

        16.5.2. Market Share Analysis, 2022

            16.5.2.1. By Capacity

            16.5.2.2. By Filling and Discharge

            16.5.2.3. By End Use

    16.6. UK

        16.6.1. Pricing Analysis

        16.6.2. Market Share Analysis, 2022

            16.6.2.1. By Capacity

            16.6.2.2. By Filling and Discharge

            16.6.2.3. By End Use

    16.7. France

        16.7.1. Pricing Analysis

        16.7.2. Market Share Analysis, 2022

            16.7.2.1. By Capacity

            16.7.2.2. By Filling and Discharge

            16.7.2.3. By End Use

    16.8. Spain

        16.8.1. Pricing Analysis

        16.8.2. Market Share Analysis, 2022

            16.8.2.1. By Capacity

            16.8.2.2. By Filling and Discharge

            16.8.2.3. By End Use

    16.9. Italy

        16.9.1. Pricing Analysis

        16.9.2. Market Share Analysis, 2022

            16.9.2.1. By Capacity

            16.9.2.2. By Filling and Discharge

            16.9.2.3. By End Use

    16.10. Poland

        16.10.1. Pricing Analysis

        16.10.2. Market Share Analysis, 2022

            16.10.2.1. By Capacity

            16.10.2.2. By Filling and Discharge

            16.10.2.3. By End Use

    16.11. Russia

        16.11.1. Pricing Analysis

        16.11.2. Market Share Analysis, 2022

            16.11.2.1. By Capacity

            16.11.2.2. By Filling and Discharge

            16.11.2.3. By End Use

    16.12. Czech Republic

        16.12.1. Pricing Analysis

        16.12.2. Market Share Analysis, 2022

            16.12.2.1. By Capacity

            16.12.2.2. By Filling and Discharge

            16.12.2.3. By End Use

    16.13. Romania

        16.13.1. Pricing Analysis

        16.13.2. Market Share Analysis, 2022

            16.13.2.1. By Capacity

            16.13.2.2. By Filling and Discharge

            16.13.2.3. By End Use

    16.14. India

        16.14.1. Pricing Analysis

        16.14.2. Market Share Analysis, 2022

            16.14.2.1. By Capacity

            16.14.2.2. By Filling and Discharge

            16.14.2.3. By End Use

    16.15. Bangladesh

        16.15.1. Pricing Analysis

        16.15.2. Market Share Analysis, 2022

            16.15.2.1. By Capacity

            16.15.2.2. By Filling and Discharge

            16.15.2.3. By End Use

    16.16. Australia

        16.16.1. Pricing Analysis

        16.16.2. Market Share Analysis, 2022

            16.16.2.1. By Capacity

            16.16.2.2. By Filling and Discharge

            16.16.2.3. By End Use

    16.17. New Zealand

        16.17.1. Pricing Analysis

        16.17.2. Market Share Analysis, 2022

            16.17.2.1. By Capacity

            16.17.2.2. By Filling and Discharge

            16.17.2.3. By End Use

    16.18. China

        16.18.1. Pricing Analysis

        16.18.2. Market Share Analysis, 2022

            16.18.2.1. By Capacity

            16.18.2.2. By Filling and Discharge

            16.18.2.3. By End Use

    16.19. Japan

        16.19.1. Pricing Analysis

        16.19.2. Market Share Analysis, 2022

            16.19.2.1. By Capacity

            16.19.2.2. By Filling and Discharge

            16.19.2.3. By End Use

    16.20. South Korea

        16.20.1. Pricing Analysis

        16.20.2. Market Share Analysis, 2022

            16.20.2.1. By Capacity

            16.20.2.2. By Filling and Discharge

            16.20.2.3. By End Use

    16.21. GCC Countries

        16.21.1. Pricing Analysis

        16.21.2. Market Share Analysis, 2022

            16.21.2.1. By Capacity

            16.21.2.2. By Filling and Discharge

            16.21.2.3. By End Use

    16.22. South Africa

        16.22.1. Pricing Analysis

        16.22.2. Market Share Analysis, 2022

            16.22.2.1. By Capacity

            16.22.2.2. By Filling and Discharge

            16.22.2.3. By End Use

    16.23. Israel

        16.23.1. Pricing Analysis

        16.23.2. Market Share Analysis, 2022

            16.23.2.1. By Capacity

            16.23.2.2. By Filling and Discharge

            16.23.2.3. By End Use

17. Market Structure Analysis

    17.1. Competition Dashboard

    17.2. Competition Benchmarking

    17.3. Market Share Analysis of Top Players

        17.3.1. By Regional

        17.3.2. By Capacity

        17.3.3. By Filling and Discharge

        17.3.4. By End Use

18. Competition Analysis

    18.1. Competition Deep Dive

        18.1.1. FlexiTuff Ventures International Ltd

            18.1.1.1. Overview

            18.1.1.2. Product Portfolio

            18.1.1.3. Profitability by Market Segments

            18.1.1.4. Sales Footprint

            18.1.1.5. Strategy Overview

                18.1.1.5.1. Marketing Strategy

                18.1.1.5.2. Product Strategy

                18.1.1.5.3. Channel Strategy

        18.1.2. ALPINE FIBC PVT.LTD

            18.1.2.1. Overview

            18.1.2.2. Product Portfolio

            18.1.2.3. Profitability by Market Segments

            18.1.2.4. Sales Footprint

            18.1.2.5. Strategy Overview

                18.1.2.5.1. Marketing Strategy

                18.1.2.5.2. Product Strategy

                18.1.2.5.3. Channel Strategy

        18.1.3. Shalimar Group

            18.1.3.1. Overview

            18.1.3.2. Product Portfolio

            18.1.3.3. Profitability by Market Segments

            18.1.3.4. Sales Footprint

            18.1.3.5. Strategy Overview

                18.1.3.5.1. Marketing Strategy

                18.1.3.5.2. Product Strategy

                18.1.3.5.3. Channel Strategy

        18.1.4. LC Packaging

            18.1.4.1. Overview

            18.1.4.2. Product Portfolio

            18.1.4.3. Profitability by Market Segments

            18.1.4.4. Sales Footprint

            18.1.4.5. Strategy Overview

                18.1.4.5.1. Marketing Strategy

                18.1.4.5.2. Product Strategy

                18.1.4.5.3. Channel Strategy

        18.1.5. Muscat Polymers Pvt. Ltd

            18.1.5.1. Overview

            18.1.5.2. Product Portfolio

            18.1.5.3. Profitability by Market Segments

            18.1.5.4. Sales Footprint

            18.1.5.5. Strategy Overview

                18.1.5.5.1. Marketing Strategy

                18.1.5.5.2. Product Strategy

                18.1.5.5.3. Channel Strategy

        18.1.6. LARE FIBC

            18.1.6.1. Overview

            18.1.6.2. Product Portfolio

            18.1.6.3. Profitability by Market Segments

            18.1.6.4. Sales Footprint

            18.1.6.5. Strategy Overview

                18.1.6.5.1. Marketing Strategy

                18.1.6.5.2. Product Strategy

                18.1.6.5.3. Channel Strategy

        18.1.7. Griffin

            18.1.7.1. Overview

            18.1.7.2. Product Portfolio

            18.1.7.3. Profitability by Market Segments

            18.1.7.4. Sales Footprint

            18.1.7.5. Strategy Overview

                18.1.7.5.1. Marketing Strategy

                18.1.7.5.2. Product Strategy

                18.1.7.5.3. Channel Strategy

        18.1.8. Chuangda Plastic Industry Co., Limited

            18.1.8.1. Overview

            18.1.8.2. Product Portfolio

            18.1.8.3. Profitability by Market Segments

            18.1.8.4. Sales Footprint

            18.1.8.5. Strategy Overview

                18.1.8.5.1. Marketing Strategy

                18.1.8.5.2. Product Strategy

                18.1.8.5.3. Channel Strategy

        18.1.9. Umasree Texplast Pvt. Ltd.

            18.1.9.1. Overview

            18.1.9.2. Product Portfolio

            18.1.9.3. Profitability by Market Segments

            18.1.9.4. Sales Footprint

            18.1.9.5. Strategy Overview

                18.1.9.5.1. Marketing Strategy

                18.1.9.5.2. Product Strategy

                18.1.9.5.3. Channel Strategy

        18.1.10. CHK Manufacturing Inc.

            18.1.10.1. Overview

            18.1.10.2. Product Portfolio

            18.1.10.3. Profitability by Market Segments

            18.1.10.4. Sales Footprint

            18.1.10.5. Strategy Overview

                18.1.10.5.1. Marketing Strategy

                18.1.10.5.2. Product Strategy

                18.1.10.5.3. Channel Strategy

19. Assumptions & Acronyms Used

20. Research Methodology
Recommendations

Packaging

Intermediate Bulk Container (IBC) Market

August 2021

REP-GB-2036

March 2024

600 pages

Packaging

2 Loop FIBC Bags Market

July 2019

REP-GB-9871

November 2023

250 pages

Packaging

FIBC Market

April 2022

REP-GB-14500

June 2023

342 pages

Packaging

Loop Handle Bags Market

September 2024

REP-GB-7214

Upcoming

Explore Packaging Insights

View Reports