Polyethylene Terephthalate Market Size and Share Forecast Outlook 2025 to 2035

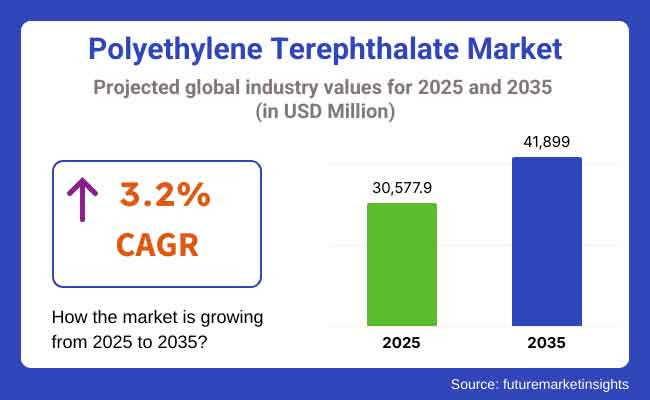
The global polyethylene terephthalate (PET) market is projected to expand from USD 30,577.9 million in 2025 to USD 41,899.0 million by 2035, registering a compound annual growth rate (CAGR) of 3.2% over the forecast period. Growth is expected to be supported by sustained demand from the packaging, textile, and consumer goods industries, where PET’s attributes such as strength, transparency, lightweight profile, and recyclability continue to meet operational and environmental requirements.
Quick Stats for the Polyethylene Terephthalate (PET) Market

  • Industry Value (2025): USD 30,577.9 million
  • Forecast Value (2035): USD 41,899.0 million
  • Forecast CAGR: 3.2%
  • Leading Segment in 2025: Packaging (64%)
  • Key Growth Region: Asia-Pacific (driven by urbanization and food & beverage demand)
  • Top Key Players: SABIC, Indorama Ventures, Sinopec Group, Alpek S.A.B. de C.V., TEIJIN LIMITED

Polyethylene Terephthalate Market

Metric Value
Market Size in 2025 USD 30,577.9 Million
Projected Market Size in 2035 USD 41,899.0 Million
CAGR (2025 to 2035) 3.2%

In 2024, strong PET consumption was observed in the packaging industry, where food and beverage manufacturers continue to adopt PET for rigid and flexible containers, especially for bottled water, carbonated drinks, and ready-to-eat products. The pharmaceutical and personal care sectors also increased their reliance on PET due to its barrier properties and compliance with hygiene standards. These trends are particularly prominent in emerging markets, where urbanization and rising disposable incomes are shaping consumption habits.

Beyond packaging, the use of PET in polyester fiber production remains a significant driver. PET fibers are extensively used in apparel, home furnishings, and industrial applications due to their durability and cost-efficiency. The global textile industry, supported by e-commerce retail and rising demand for performance fabrics, has played a central role in sustaining PET demand.

Efforts to transition toward a circular economy are prompting industry stakeholders to prioritize recycled PET (rPET) and explore alternative bio-based PET formulations. The implementation of recycled content mandates in the EU and North America, along with rising consumer awareness about single-use plastics, is compelling converters and brand owners to secure closed-loop systems and invest in chemical and mechanical recycling technologies.

In automotive and electronics industries, PET is being utilized for under-the-hood components, 3D printing filaments, and flexible circuit boards due to its thermal resistance and structural integrity. These applications, although smaller in volume compared to packaging and textiles, are contributing to the development of specialty PET grades.

Analyzing Polyethylene Terephthalate Market by Top Investment Segments

Packaging is expected to dominate application demand due to PET’s strong barrier properties, lightweight profile, and high recyclability

The packaging segment is projected to hold approximately 64% of the global PET market share in 2025 and is expected to grow at a CAGR of 3.3% through 2035. PET is widely used in manufacturing bottles, containers, and flexible packaging for beverages, food products, and household chemicals. Its high strength-to-weight ratio, clarity, and ability to form airtight seals make it the preferred material for carbonated drinks, water, and ready-to-eat items.

As regulatory bodies and consumers push for sustainable packaging, the use of recyclable and food-grade PET continues to expand. Growth in e-commerce packaging and demand for lightweight logistics solutions are also contributing to broader adoption across global supply chains.

Food and beverage sector is projected to lead end-user consumption, driven by increasing demand for safe, lightweight, and transparent packaging materials

The food and beverage segment is estimated to account for approximately 57% of the global PET market share in 2025 and is projected to grow at a CAGR of 3.4% through 2035. PET is widely used in the packaging of bottled water, soft drinks, dairy products, sauces, and edible oils due to its non-reactive nature and compliance with global food safety standards.

Rising urbanization, shifting consumer preferences toward convenience foods, and growing focus on hygienic packaging are reinforcing demand in this segment. Additionally, beverage brands are investing in recycled PET (rPET) packaging solutions to meet sustainability targets and circular economy goals, further strengthening PET’s role in the global food and beverage industry.

Challenges and Opportunities

Challenges

Plastic waste backlash, price volatility, and recycling inefficiencies hinder market potential.

While PET is recyclable, it is increasingly being criticized as a contributor to global plastic waste, particularly in countries without effective waste management systems. Many regions are only able to achieve effective circularity due to inconsistent collection, contamination in recycling streams and not enough rPET capacity.

In addition to PET production, the cost of its raw materials, namely purified terephthalic acid (PTA) and monoethylene glycol (MEG), are subject to price fluctuations, which in turn affect production margins. Furthermore, impending regulatory, by which single-use plastics are being phased out down, is leading some of the brands to develop alternatives to packaging materials, which may, in turn, change demand away from PET from certain end-use categories.

Opportunities

Growth in rPET, bio-PET, and sustainable textiles unlock new pathways.

There are major opportunities to develop and scale food-grade recycled PET (rPET) and bio-based PET made from renewable feedstocks, like sugarcane or corn. International beverage companies are pledging 100% recyclable packaging and more rPET, ensuring strong demand for quality recycled resins.

PET is also playing an increasingly prominent role in the production of polyester fibre for garments, automotive and technical textiles, all of which provide long-term growth opportunities. Depolymerization and solvent-based purification are among the advanced recycling technologies that are improving PET recovery rates. Innovation in reusable PET containers, refill systems, and closed-loop logistics part of the government/industry partnerships to come up with zero-waste packaging.
Country-Wise Outlook

Polyethylene Terephthalate Market Country Wise Analysis

United States

The growing use of polyethylene terephthalate (PET) in the manufacturing of beverage bottles, food packaging, and textile fiber is driving the USA market. According to the UN, the shift towards sustainable packaging is driving demand for rPET (recycled PET) as leading beverage brands commit to using 50-100% recycled content by 2030.

State laws such as bottle deposit programs and extended producer responsibility laws in places like California and Oregon are helping to upgrade recycling infrastructure.Also industrial demand for PET resins is growing in thermoforming and 3D printing.

Country CAGR (2025 to 2035)
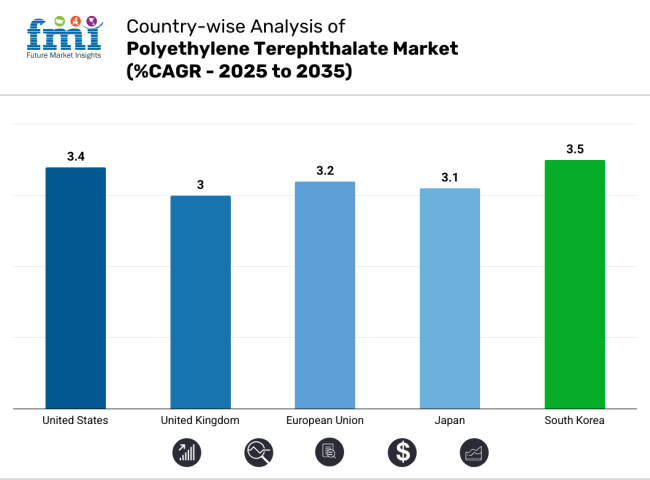
United States 3.4%

United Kingdom

PET beverage use in the UK primarily comes from bottled water, ready-meal trays, and personal-care containers. The Plastic Packaging Tax from the UK government and the newly planned Deposit Return Scheme (DRS) are incentivizing the use of recycled PET and circular packaging solutions.

To improve recyclability, supermarkets are moving to mono-material PET trays as well as clear containers. Innovation hubs in London and Manchester are developing bio-PET and enzymatic recycling techniques to reduce our reliance on virgin feedstock. Yet, demand stemming from e-commerce-ready packaging also follows consumer convenience trends.

Country CAGR (2025 to 2035)
United Kingdom 3.0%

European Union

The EU is still a major manufacturer and recycling region for PET due to strict environmental regulations as part of the European Green Deal. Germany, Italy, and France have the most advanced closed-loop recycling infrastructure focusing on bottle-to-bottle applications for PET.

Additionally, the EU Single-Use Plastics Directive requires minimum recycled content in plastic bottles, stimulating demand for food-grade rPET. There are regional players investing in mechanical and the chemical recycling capacity. Developments in R&D are also progressing the creation of high-clarity PET for the pharmaceutical and electronics packaging sector.

Region CAGR (2025 to 2035)
European Union 3.2%

Japan

PET demand across bottled beverages, convenience food trays, and functional fibers drives Japan’s market. Thanks to widespread deposit systems and public awareness campaigns, the country has one of the highest PET bottle recycling rates in the world over 85 percent. Domestic companies are at the forefront for developing bio-based PET from renewable feedstocks like molasses and corn.

In fact, PET is also commonly used in electronics and automotive components where heat resistance and dimensional stability are required. Leading retail chains are adopting smart packaging solutions using PET films.

Country CAGR (2025 to 2035)
Japan 3.1%

South Korea

South Korea has a strong PET market with advanced manufacturing in its systems range in packaging its textile and industrial films. The gov (green new deal that promotes the use of recycled plastics. Standards in food delivery have raised drastically, caused by e-commerce and urban consumption, hence, the demand for PET trays and bottles will remain high.

For its thermal and mechanical properties, PET has also increased its presence in Korea’s electronics and construction sector. Top firms are creating high-strength PET variants for industrial uses, and public-private partnerships are addressing rPET collection systems.

Country CAGR (2025 to 2035)
South Korea 3.5%

Competitive Outlook

The global PET market is highly competitive and vertically integrated, with key players prioritizing sustainable innovation and regional growth. Companies are investing in closed-loop recycling, bio-based PET, and chemical recycling technologies to support circular economy goals. Strategic partnerships are emerging throughout the PET value chain, from collection and washing to resin production and bottle manufacturing.

Government grants and ESG-driven funding are facilitating technological advancements and capacity expansion. The market is increasingly focused on reducing carbon footprints, enhancing food-grade recyclability, and ensuring compliance with global packaging regulations.

  • In April 2024, Iterum was reported to have opened a new PET recycling plant in Olaine, Latvia, with an annual capacity of 40,000 tons of recycled PET. The facility was designed to produce high-quality rPET for use in food-grade packaging and other circular economy applications. It was stated that the plant uses advanced sorting and extrusion technologies to meet EU sustainability goals and packaging regulations.
  • In May 2024, Indorama Ventures was reported to be considering the restart of its PET resin plant in Decatur, Alabama, following recent shifts in USA trade policy and tariff adjustments on PET imports. It was stated that the reassessment was driven by tightening domestic supply conditions and the growing demand for local production of beauty and personal care packaging materials. The move was positioned as part of a broader supply realignment in the North American PET value chain.

Companies

  • SABIC
  • Indorama Ventures Public Company Limited
  • Sinopec Group
  • TEIJIN LIMITED
  • M&G Chemicals
  • SRF Limited
  • Alpek S.A.B. de C.V.
  • Far Eastern Group
  • Toray Industries, Inc.
  • SCG Chemicals Co., Ltd.
  • Yucheng Jinhe Industrial Co., Ltd

Key Segmentation

By Application:

  • for Sheets/Films
  • for Packaging
  • for Consumer Goods
  • for Other Applications

By End User:

  • for Automotive Industry
  • for Electronics
  • for Food & Beverages
  • for Other End Users

By Region:

  • North America
  • Latin America
  • Western Europe
  • Eastern Europe
  • APEJ
  • Japan
  • Middle East & Africa

Table of Content

  1. Executive Summary
  2. Industry Introduction, including Taxonomy and Market Definition
  3. Market Trends and Success Factors, including Macro-economic Factors, Market Dynamics, and Recent Industry Developments
  4. Global Market Demand Analysis 2020 to 2024 and Forecast 2025 to 2035, including Historical Analysis and Future Projections
  5. Pricing Analysis
  6. Global Market Analysis 2020 to 2024 and Forecast 2025 to 2035
    • By Application
    • By End User
    • By Region
  7. Global Market Analysis 2020 to 2024 and Forecast 2025 to 2035, By Application
    • for Sheets/Films
    • for Packaging
    • for Consumer Goods
    • for Other Applications
  8. Global Market Analysis 2020 to 2024 and Forecast 2025 to 2035, By End User
    • for Automotive Industry
    • for Electronics
    • for Food & Beverages
    • for Other End Users
  9. Global Market Analysis 2020 to 2024 and Forecast 2025 to 2035, By Region
    • North America
    • Latin America
    • Western Europe
    • Eastern Europe
    • APEJ
    • Japan
    • Middle East & Africa
  10. North America Sales Analysis 2020 to 2024 and Forecast 2025 to 2035, by Key Segments and Countries
  11. Latin America Sales Analysis 2020 to 2024 and Forecast 2025 to 2035, by Key Segments and Countries
  12. Western Europe Sales Analysis 2020 to 2024 and Forecast 2025 to 2035, by Key Segments and Countries
  13. Eastern Europe Sales Analysis 2020 to 2024 and Forecast 2025 to 2035, by Key Segments and Countries
  14. South Asia Pacific Sales Analysis 2020 to 2024 and Forecast 2025 to 2035, by Key Segments and Countries
  15. East Asia Sales Analysis 2020 to 2024 and Forecast 2025 to 2035, by Key Segments and Countries
  16. Middle East & Africa Sales Analysis 2020 to 2024 and Forecast 2025 to 2035, by Key Segments and Countries
  17. Sales Forecast 2025 to 2035 by Application and End User for 30 Countries
  18. Competition Outlook, including Market Structure Analysis, Company Share Analysis by Key Players, and Competition Dashboard
  19. Company Profile
    • SABIC
    • DowDupont
    • Indorama Ventures Public Company Limited
    • Sinopec Group
    • TEIJIN LIMITED
    • M&G Chemicals
    • Clearpak Inc.
    • Amcor Limited
    • SRF Limited
    • Alpek S.A.B. de C.V.
    • Dhunseri Petrochem Limited
    • NEO Group
    • Far Eastern Group
    • Mitsubishi Polyester Film, Inc.
    • Toray Industries, Inc.
    • Toyobo Co., Ltd.
    • Mitsui Chemicals, Inc.
    • Sidel-Tetra Laval Group
    • SCG Chemicals Co., Ltd.
    • Yucheng Jinhe Industrial Co.,Ltd

List of Tables

  • Table 1: Global Market Value (USD Million) Forecast by Region, 2020-2035
  • Table 2: Global Market Volume (Tons) Forecast by Region, 2020-2035
  • Table 3: Global Market Value (USD Million) Forecast by Grade, 2020-2035
  • Table 4: Global Market Volume (Tons) Forecast by Grade, 2020-2035
  • Table 5: Global Market Value (USD Million) Forecast by Product Type, 2020-2035
  • Table 6: Global Market Volume (Tons) Forecast by Product Type, 2020-2035
  • Table 7: Global Market Value (USD Million) Forecast by Application, 2020-2035
  • Table 8: Global Market Volume (Tons) Forecast by Application, 2020-2035
  • Table 9: Global Market Value (USD Million) Forecast by End Use Industry, 2020-2035
  • Table 10: Global Market Volume (Tons) Forecast by End Use Industry, 2020-2035
  • Table 11: North America Market Value (USD Million) Forecast by Country, 2020-2035
  • Table 12: North America Market Volume (Tons) Forecast by Country, 2020-2035
  • Table 13: North America Market Value (USD Million) Forecast by Grade, 2020-2035
  • Table 14: North America Market Volume (Tons) Forecast by Grade, 2020-2035
  • Table 15: North America Market Value (USD Million) Forecast by Product Type, 2020-2035
  • Table 16: North America Market Volume (Tons) Forecast by Product Type, 2020-2035
  • Table 17: North America Market Value (USD Million) Forecast by Application, 2020-2035
  • Table 18: North America Market Volume (Tons) Forecast by Application, 2020-2035
  • Table 19: North America Market Value (USD Million) Forecast by End Use Industry, 2020-2035
  • Table 20: North America Market Volume (Tons) Forecast by End Use Industry, 2020-2035
  • Table 21: Latin America Market Value (USD Million) Forecast by Country, 2020-2035
  • Table 22: Latin America Market Volume (Tons) Forecast by Country, 2020-2035
  • Table 23: Latin America Market Value (USD Million) Forecast by Grade, 2020-2035
  • Table 24: Latin America Market Volume (Tons) Forecast by Grade, 2020-2035
  • Table 25: Latin America Market Value (USD Million) Forecast by Product Type, 2020-2035
  • Table 26: Latin America Market Volume (Tons) Forecast by Product Type, 2020-2035
  • Table 27: Latin America Market Value (USD Million) Forecast by Application, 2020-2035
  • Table 28: Latin America Market Volume (Tons) Forecast by Application, 2020-2035
  • Table 29: Latin America Market Value (USD Million) Forecast by End Use Industry, 2020-2035
  • Table 30: Latin America Market Volume (Tons) Forecast by End Use Industry, 2020-2035
  • Table 31: Europe Market Value (USD Million) Forecast by Country, 2020-2035
  • Table 32: Europe Market Volume (Tons) Forecast by Country, 2020-2035
  • Table 33: Europe Market Value (USD Million) Forecast by Grade, 2020-2035
  • Table 34: Europe Market Volume (Tons) Forecast by Grade, 2020-2035
  • Table 35: Europe Market Value (USD Million) Forecast by Product Type, 2020-2035
  • Table 36: Europe Market Volume (Tons) Forecast by Product Type, 2020-2035
  • Table 37: Europe Market Value (USD Million) Forecast by Application, 2020-2035
  • Table 38: Europe Market Volume (Tons) Forecast by Application, 2020-2035
  • Table 39: Europe Market Value (USD Million) Forecast by End Use Industry, 2020-2035
  • Table 40: Europe Market Volume (Tons) Forecast by End Use Industry, 2020-2035
  • Table 41: East Asia Market Value (USD Million) Forecast by Country, 2020-2035
  • Table 42: East Asia Market Volume (Tons) Forecast by Country, 2020-2035
  • Table 43: East Asia Market Value (USD Million) Forecast by Grade, 2020-2035
  • Table 44: East Asia Market Volume (Tons) Forecast by Grade, 2020-2035
  • Table 45: East Asia Market Value (USD Million) Forecast by Product Type, 2020-2035
  • Table 46: East Asia Market Volume (Tons) Forecast by Product Type, 2020-2035
  • Table 47: East Asia Market Value (USD Million) Forecast by Application, 2020-2035
  • Table 48: East Asia Market Volume (Tons) Forecast by Application, 2020-2035
  • Table 49: East Asia Market Value (USD Million) Forecast by End Use Industry, 2020-2035
  • Table 50: East Asia Market Volume (Tons) Forecast by End Use Industry, 2020-2035
  • Table 51: South Asia & Pacific Market Value (USD Million) Forecast by Country, 2020-2035
  • Table 52: South Asia & Pacific Market Volume (Tons) Forecast by Country, 2020-2035
  • Table 53: South Asia & Pacific Market Value (USD Million) Forecast by Grade, 2020-2035
  • Table 54: South Asia & Pacific Market Volume (Tons) Forecast by Grade, 2020-2035
  • Table 55: South Asia & Pacific Market Value (USD Million) Forecast by Product Type, 2020-2035
  • Table 56: South Asia & Pacific Market Volume (Tons) Forecast by Product Type, 2020-2035
  • Table 57: South Asia & Pacific Market Value (USD Million) Forecast by Application, 2020-2035
  • Table 58: South Asia & Pacific Market Volume (Tons) Forecast by Application, 2020-2035
  • Table 59: South Asia & Pacific Market Value (USD Million) Forecast by End Use Industry, 2020-2035
  • Table 60: South Asia & Pacific Market Volume (Tons) Forecast by End Use Industry, 2020-2035
  • Table 61: MEA Market Value (USD Million) Forecast by Country, 2020-2035
  • Table 62: MEA Market Volume (Tons) Forecast by Country, 2020-2035
  • Table 63: MEA Market Value (USD Million) Forecast by Grade, 2020-2035
  • Table 64: MEA Market Volume (Tons) Forecast by Grade, 2020-2035
  • Table 65: MEA Market Value (USD Million) Forecast by Product Type, 2020-2035
  • Table 66: MEA Market Volume (Tons) Forecast by Product Type, 2020-2035
  • Table 67: MEA Market Value (USD Million) Forecast by Application, 2020-2035
  • Table 68: MEA Market Volume (Tons) Forecast by Application, 2020-2035
  • Table 69: MEA Market Value (USD Million) Forecast by End Use Industry, 2020-2035
  • Table 70: MEA Market Volume (Tons) Forecast by End Use Industry, 2020-2035

List of Figures

  • Figure 1: Global Market Value (USD Million) by Grade, 2025-2035
  • Figure 2: Global Market Value (USD Million) by Product Type, 2025-2035
  • Figure 3: Global Market Value (USD Million) by Application, 2025-2035
  • Figure 4: Global Market Value (USD Million) by End Use Industry, 2025-2035
  • Figure 5: Global Market Value (USD Million) by Region, 2025-2035
  • Figure 6: Global Market Value (USD Million) Analysis by Region, 2020-2035
  • Figure 7: Global Market Volume (Tons) Analysis by Region, 2020-2035
  • Figure 8: Global Market Value Share (%) and BPS Analysis by Region, 2025-2035
  • Figure 9: Global Market Y-o-Y Growth (%) Projections by Region, 2025-2035
  • Figure 10: Global Market Value (USD Million) Analysis by Grade, 2020-2035
  • Figure 11: Global Market Volume (Tons) Analysis by Grade, 2020-2035
  • Figure 12: Global Market Value Share (%) and BPS Analysis by Grade, 2025-2035
  • Figure 13: Global Market Y-o-Y Growth (%) Projections by Grade, 2025-2035
  • Figure 14: Global Market Value (USD Million) Analysis by Product Type, 2020-2035
  • Figure 15: Global Market Volume (Tons) Analysis by Product Type, 2020-2035
  • Figure 16: Global Market Value Share (%) and BPS Analysis by Product Type, 2025-2035
  • Figure 17: Global Market Y-o-Y Growth (%) Projections by Product Type, 2025-2035
  • Figure 18: Global Market Value (USD Million) Analysis by Application, 2020-2035
  • Figure 19: Global Market Volume (Tons) Analysis by Application, 2020-2035
  • Figure 20: Global Market Value Share (%) and BPS Analysis by Application, 2025-2035
  • Figure 21: Global Market Y-o-Y Growth (%) Projections by Application, 2025-2035
  • Figure 22: Global Market Value (USD Million) Analysis by End Use Industry, 2020-2035
  • Figure 23: Global Market Volume (Tons) Analysis by End Use Industry, 2020-2035
  • Figure 24: Global Market Value Share (%) and BPS Analysis by End Use Industry, 2025-2035
  • Figure 25: Global Market Y-o-Y Growth (%) Projections by End Use Industry, 2025-2035
  • Figure 26: Global Market Attractiveness by Grade, 2025-2035
  • Figure 27: Global Market Attractiveness by Product Type, 2025-2035
  • Figure 28: Global Market Attractiveness by Application, 2025-2035
  • Figure 29: Global Market Attractiveness by End Use Industry, 2025-2035
  • Figure 30: Global Market Attractiveness by Region, 2025-2035
  • Figure 31: North America Market Value (USD Million) by Grade, 2025-2035
  • Figure 32: North America Market Value (USD Million) by Product Type, 2025-2035
  • Figure 33: North America Market Value (USD Million) by Application, 2025-2035
  • Figure 34: North America Market Value (USD Million) by End Use Industry, 2025-2035
  • Figure 35: North America Market Value (USD Million) by Country, 2025-2035
  • Figure 36: North America Market Value (USD Million) Analysis by Country, 2020-2035
  • Figure 37: North America Market Volume (Tons) Analysis by Country, 2020-2035
  • Figure 38: North America Market Value Share (%) and BPS Analysis by Country, 2025-2035
  • Figure 39: North America Market Y-o-Y Growth (%) Projections by Country, 2025-2035
  • Figure 40: North America Market Value (USD Million) Analysis by Grade, 2020-2035
  • Figure 41: North America Market Volume (Tons) Analysis by Grade, 2020-2035
  • Figure 42: North America Market Value Share (%) and BPS Analysis by Grade, 2025-2035
  • Figure 43: North America Market Y-o-Y Growth (%) Projections by Grade, 2025-2035
  • Figure 44: North America Market Value (USD Million) Analysis by Product Type, 2020-2035
  • Figure 45: North America Market Volume (Tons) Analysis by Product Type, 2020-2035
  • Figure 46: North America Market Value Share (%) and BPS Analysis by Product Type, 2025-2035
  • Figure 47: North America Market Y-o-Y Growth (%) Projections by Product Type, 2025-2035
  • Figure 48: North America Market Value (USD Million) Analysis by Application, 2020-2035
  • Figure 49: North America Market Volume (Tons) Analysis by Application, 2020-2035
  • Figure 50: North America Market Value Share (%) and BPS Analysis by Application, 2025-2035
  • Figure 51: North America Market Y-o-Y Growth (%) Projections by Application, 2025-2035
  • Figure 52: North America Market Value (USD Million) Analysis by End Use Industry, 2020-2035
  • Figure 53: North America Market Volume (Tons) Analysis by End Use Industry, 2020-2035
  • Figure 54: North America Market Value Share (%) and BPS Analysis by End Use Industry, 2025-2035
  • Figure 55: North America Market Y-o-Y Growth (%) Projections by End Use Industry, 2025-2035
  • Figure 56: North America Market Attractiveness by Grade, 2025-2035
  • Figure 57: North America Market Attractiveness by Product Type, 2025-2035
  • Figure 58: North America Market Attractiveness by Application, 2025-2035
  • Figure 59: North America Market Attractiveness by End Use Industry, 2025-2035
  • Figure 60: North America Market Attractiveness by Country, 2025-2035
  • Figure 61: Latin America Market Value (USD Million) by Grade, 2025-2035
  • Figure 62: Latin America Market Value (USD Million) by Product Type, 2025-2035
  • Figure 63: Latin America Market Value (USD Million) by Application, 2025-2035
  • Figure 64: Latin America Market Value (USD Million) by End Use Industry, 2025-2035
  • Figure 65: Latin America Market Value (USD Million) by Country, 2025-2035
  • Figure 66: Latin America Market Value (USD Million) Analysis by Country, 2020-2035
  • Figure 67: Latin America Market Volume (Tons) Analysis by Country, 2020-2035
  • Figure 68: Latin America Market Value Share (%) and BPS Analysis by Country, 2025-2035
  • Figure 69: Latin America Market Y-o-Y Growth (%) Projections by Country, 2025-2035
  • Figure 70: Latin America Market Value (USD Million) Analysis by Grade, 2020-2035
  • Figure 71: Latin America Market Volume (Tons) Analysis by Grade, 2020-2035
  • Figure 72: Latin America Market Value Share (%) and BPS Analysis by Grade, 2025-2035
  • Figure 73: Latin America Market Y-o-Y Growth (%) Projections by Grade, 2025-2035
  • Figure 74: Latin America Market Value (USD Million) Analysis by Product Type, 2020-2035
  • Figure 75: Latin America Market Volume (Tons) Analysis by Product Type, 2020-2035
  • Figure 76: Latin America Market Value Share (%) and BPS Analysis by Product Type, 2025-2035
  • Figure 77: Latin America Market Y-o-Y Growth (%) Projections by Product Type, 2025-2035
  • Figure 78: Latin America Market Value (USD Million) Analysis by Application, 2020-2035
  • Figure 79: Latin America Market Volume (Tons) Analysis by Application, 2020-2035
  • Figure 80: Latin America Market Value Share (%) and BPS Analysis by Application, 2025-2035
  • Figure 81: Latin America Market Y-o-Y Growth (%) Projections by Application, 2025-2035
  • Figure 82: Latin America Market Value (USD Million) Analysis by End Use Industry, 2020-2035
  • Figure 83: Latin America Market Volume (Tons) Analysis by End Use Industry, 2020-2035
  • Figure 84: Latin America Market Value Share (%) and BPS Analysis by End Use Industry, 2025-2035
  • Figure 85: Latin America Market Y-o-Y Growth (%) Projections by End Use Industry, 2025-2035
  • Figure 86: Latin America Market Attractiveness by Grade, 2025-2035
  • Figure 87: Latin America Market Attractiveness by Product Type, 2025-2035
  • Figure 88: Latin America Market Attractiveness by Application, 2025-2035
  • Figure 89: Latin America Market Attractiveness by End Use Industry, 2025-2035
  • Figure 90: Latin America Market Attractiveness by Country, 2025-2035
  • Figure 91: Europe Market Value (USD Million) by Grade, 2025-2035
  • Figure 92: Europe Market Value (USD Million) by Product Type, 2025-2035
  • Figure 93: Europe Market Value (USD Million) by Application, 2025-2035
  • Figure 94: Europe Market Value (USD Million) by End Use Industry, 2025-2035
  • Figure 95: Europe Market Value (USD Million) by Country, 2025-2035
  • Figure 96: Europe Market Value (USD Million) Analysis by Country, 2020-2035
  • Figure 97: Europe Market Volume (Tons) Analysis by Country, 2020-2035
  • Figure 98: Europe Market Value Share (%) and BPS Analysis by Country, 2025-2035
  • Figure 99: Europe Market Y-o-Y Growth (%) Projections by Country, 2025-2035
  • Figure 100: Europe Market Value (USD Million) Analysis by Grade, 2020-2035
  • Figure 101: Europe Market Volume (Tons) Analysis by Grade, 2020-2035
  • Figure 102: Europe Market Value Share (%) and BPS Analysis by Grade, 2025-2035
  • Figure 103: Europe Market Y-o-Y Growth (%) Projections by Grade, 2025-2035
  • Figure 104: Europe Market Value (USD Million) Analysis by Product Type, 2020-2035
  • Figure 105: Europe Market Volume (Tons) Analysis by Product Type, 2020-2035
  • Figure 106: Europe Market Value Share (%) and BPS Analysis by Product Type, 2025-2035
  • Figure 107: Europe Market Y-o-Y Growth (%) Projections by Product Type, 2025-2035
  • Figure 108: Europe Market Value (USD Million) Analysis by Application, 2020-2035
  • Figure 109: Europe Market Volume (Tons) Analysis by Application, 2020-2035
  • Figure 110: Europe Market Value Share (%) and BPS Analysis by Application, 2025-2035
  • Figure 111: Europe Market Y-o-Y Growth (%) Projections by Application, 2025-2035
  • Figure 112: Europe Market Value (USD Million) Analysis by End Use Industry, 2020-2035
  • Figure 113: Europe Market Volume (Tons) Analysis by End Use Industry, 2020-2035
  • Figure 114: Europe Market Value Share (%) and BPS Analysis by End Use Industry, 2025-2035
  • Figure 115: Europe Market Y-o-Y Growth (%) Projections by End Use Industry, 2025-2035
  • Figure 116: Europe Market Attractiveness by Grade, 2025-2035
  • Figure 117: Europe Market Attractiveness by Product Type, 2025-2035
  • Figure 118: Europe Market Attractiveness by Application, 2025-2035
  • Figure 119: Europe Market Attractiveness by End Use Industry, 2025-2035
  • Figure 120: Europe Market Attractiveness by Country, 2025-2035
  • Figure 121: East Asia Market Value (USD Million) by Grade, 2025-2035
  • Figure 122: East Asia Market Value (USD Million) by Product Type, 2025-2035
  • Figure 123: East Asia Market Value (USD Million) by Application, 2025-2035
  • Figure 124: East Asia Market Value (USD Million) by End Use Industry, 2025-2035
  • Figure 125: East Asia Market Value (USD Million) by Country, 2025-2035
  • Figure 126: East Asia Market Value (USD Million) Analysis by Country, 2020-2035
  • Figure 127: East Asia Market Volume (Tons) Analysis by Country, 2020-2035
  • Figure 128: East Asia Market Value Share (%) and BPS Analysis by Country, 2025-2035
  • Figure 129: East Asia Market Y-o-Y Growth (%) Projections by Country, 2025-2035
  • Figure 130: East Asia Market Value (USD Million) Analysis by Grade, 2020-2035
  • Figure 131: East Asia Market Volume (Tons) Analysis by Grade, 2020-2035
  • Figure 132: East Asia Market Value Share (%) and BPS Analysis by Grade, 2025-2035
  • Figure 133: East Asia Market Y-o-Y Growth (%) Projections by Grade, 2025-2035
  • Figure 134: East Asia Market Value (USD Million) Analysis by Product Type, 2020-2035
  • Figure 135: East Asia Market Volume (Tons) Analysis by Product Type, 2020-2035
  • Figure 136: East Asia Market Value Share (%) and BPS Analysis by Product Type, 2025-2035
  • Figure 137: East Asia Market Y-o-Y Growth (%) Projections by Product Type, 2025-2035
  • Figure 138: East Asia Market Value (USD Million) Analysis by Application, 2020-2035
  • Figure 139: East Asia Market Volume (Tons) Analysis by Application, 2020-2035
  • Figure 140: East Asia Market Value Share (%) and BPS Analysis by Application, 2025-2035
  • Figure 141: East Asia Market Y-o-Y Growth (%) Projections by Application, 2025-2035
  • Figure 142: East Asia Market Value (USD Million) Analysis by End Use Industry, 2020-2035
  • Figure 143: East Asia Market Volume (Tons) Analysis by End Use Industry, 2020-2035
  • Figure 144: East Asia Market Value Share (%) and BPS Analysis by End Use Industry, 2025-2035
  • Figure 145: East Asia Market Y-o-Y Growth (%) Projections by End Use Industry, 2025-2035
  • Figure 146: East Asia Market Attractiveness by Grade, 2025-2035
  • Figure 147: East Asia Market Attractiveness by Product Type, 2025-2035
  • Figure 148: East Asia Market Attractiveness by Application, 2025-2035
  • Figure 149: East Asia Market Attractiveness by End Use Industry, 2025-2035
  • Figure 150: East Asia Market Attractiveness by Country, 2025-2035
  • Figure 151: South Asia & Pacific Market Value (USD Million) by Grade, 2025-2035
  • Figure 152: South Asia & Pacific Market Value (USD Million) by Product Type, 2025-2035
  • Figure 153: South Asia & Pacific Market Value (USD Million) by Application, 2025-2035
  • Figure 154: South Asia & Pacific Market Value (USD Million) by End Use Industry, 2025-2035
  • Figure 155: South Asia & Pacific Market Value (USD Million) by Country, 2025-2035
  • Figure 156: South Asia & Pacific Market Value (USD Million) Analysis by Country, 2020-2035
  • Figure 157: South Asia & Pacific Market Volume (Tons) Analysis by Country, 2020-2035
  • Figure 158: South Asia & Pacific Market Value Share (%) and BPS Analysis by Country, 2025-2035
  • Figure 159: South Asia & Pacific Market Y-o-Y Growth (%) Projections by Country, 2025-2035
  • Figure 160: South Asia & Pacific Market Value (USD Million) Analysis by Grade, 2020-2035
  • Figure 161: South Asia & Pacific Market Volume (Tons) Analysis by Grade, 2020-2035
  • Figure 162: South Asia & Pacific Market Value Share (%) and BPS Analysis by Grade, 2025-2035
  • Figure 163: South Asia & Pacific Market Y-o-Y Growth (%) Projections by Grade, 2025-2035
  • Figure 164: South Asia & Pacific Market Value (USD Million) Analysis by Product Type, 2020-2035
  • Figure 165: South Asia & Pacific Market Volume (Tons) Analysis by Product Type, 2020-2035
  • Figure 166: South Asia & Pacific Market Value Share (%) and BPS Analysis by Product Type, 2025-2035
  • Figure 167: South Asia & Pacific Market Y-o-Y Growth (%) Projections by Product Type, 2025-2035
  • Figure 168: South Asia & Pacific Market Value (USD Million) Analysis by Application, 2020-2035
  • Figure 169: South Asia & Pacific Market Volume (Tons) Analysis by Application, 2020-2035
  • Figure 170: South Asia & Pacific Market Value Share (%) and BPS Analysis by Application, 2025-2035
  • Figure 171: South Asia & Pacific Market Y-o-Y Growth (%) Projections by Application, 2025-2035
  • Figure 172: South Asia & Pacific Market Value (USD Million) Analysis by End Use Industry, 2020-2035
  • Figure 173: South Asia & Pacific Market Volume (Tons) Analysis by End Use Industry, 2020-2035
  • Figure 174: South Asia & Pacific Market Value Share (%) and BPS Analysis by End Use Industry, 2025-2035
  • Figure 175: South Asia & Pacific Market Y-o-Y Growth (%) Projections by End Use Industry, 2025-2035
  • Figure 176: South Asia & Pacific Market Attractiveness by Grade, 2025-2035
  • Figure 177: South Asia & Pacific Market Attractiveness by Product Type, 2025-2035
  • Figure 178: South Asia & Pacific Market Attractiveness by Application, 2025-2035
  • Figure 179: South Asia & Pacific Market Attractiveness by End Use Industry, 2025-2035
  • Figure 180: South Asia & Pacific Market Attractiveness by Country, 2025-2035
  • Figure 181: MEA Market Value (USD Million) by Grade, 2025-2035
  • Figure 182: MEA Market Value (USD Million) by Product Type, 2025-2035
  • Figure 183: MEA Market Value (USD Million) by Application, 2025-2035
  • Figure 184: MEA Market Value (USD Million) by End Use Industry, 2025-2035
  • Figure 185: MEA Market Value (USD Million) by Country, 2025-2035
  • Figure 186: MEA Market Value (USD Million) Analysis by Country, 2020-2035
  • Figure 187: MEA Market Volume (Tons) Analysis by Country, 2020-2035
  • Figure 188: MEA Market Value Share (%) and BPS Analysis by Country, 2025-2035
  • Figure 189: MEA Market Y-o-Y Growth (%) Projections by Country, 2025-2035
  • Figure 190: MEA Market Value (USD Million) Analysis by Grade, 2020-2035
  • Figure 191: MEA Market Volume (Tons) Analysis by Grade, 2020-2035
  • Figure 192: MEA Market Value Share (%) and BPS Analysis by Grade, 2025-2035
  • Figure 193: MEA Market Y-o-Y Growth (%) Projections by Grade, 2025-2035
  • Figure 194: MEA Market Value (USD Million) Analysis by Product Type, 2020-2035
  • Figure 195: MEA Market Volume (Tons) Analysis by Product Type, 2020-2035
  • Figure 196: MEA Market Value Share (%) and BPS Analysis by Product Type, 2025-2035
  • Figure 197: MEA Market Y-o-Y Growth (%) Projections by Product Type, 2025-2035
  • Figure 198: MEA Market Value (USD Million) Analysis by Application, 2020-2035
  • Figure 199: MEA Market Volume (Tons) Analysis by Application, 2020-2035
  • Figure 200: MEA Market Value Share (%) and BPS Analysis by Application, 2025-2035
  • Figure 201: MEA Market Y-o-Y Growth (%) Projections by Application, 2025-2035
  • Figure 202: MEA Market Value (USD Million) Analysis by End Use Industry, 2020-2035
  • Figure 203: MEA Market Volume (Tons) Analysis by End Use Industry, 2020-2035
  • Figure 204: MEA Market Value Share (%) and BPS Analysis by End Use Industry, 2025-2035
  • Figure 205: MEA Market Y-o-Y Growth (%) Projections by End Use Industry, 2025-2035
  • Figure 206: MEA Market Attractiveness by Grade, 2025-2035
  • Figure 207: MEA Market Attractiveness by Product Type, 2025-2035
  • Figure 208: MEA Market Attractiveness by Application, 2025-2035
  • Figure 209: MEA Market Attractiveness by End Use Industry, 2025-2035
  • Figure 210: MEA Market Attractiveness by Country, 2025-2035

Frequently Asked Questions

What was the overall size of the polyethylene terephthalate market in 2025?

The overall market size for the polyethylene terephthalate market was USD 30,577.9 Million in 2025.

How big is the polyethylene terephthalate market expected to be in 2035?

The polyethylene terephthalate market is expected to reach USD 41,899.0 Million in 2035.

What will drive the demand for the polyethylene terephthalate market during the forecast period?

The demand for polyethylene terephthalate (PET) is rising due to its extensive use in packaging solutions, particularly in the food and beverage industry. Increasing demand for lightweight, recyclable, and cost-effective materials for bottles and containers is further accelerating market growth.

List the top 5 countries contributing to the polyethylene terephthalate market.

The top 5 countries driving the development of the polyethylene terephthalate market are China, the USA, India, Germany, and Brazil.

Which segment in the application and end-use category is expected to lead in the polyethylene terephthalate market?

PET for packaging and food & beverage end use are expected to command a significant share over the assessment period.

Explore Similar Insights

Future Market Insights

Polyethylene Terephthalate Market