HDPE Bottles Market
Market Insights on HDPE Bottles covering sales outlook, demand forecast & up-to-date key trends
HDPE Bottles Market by Cap Type (Screw Closures, Snap Closures, Push-Pull Closures, Disc Top Closures, Spray Closures, Dispensers and Dropper), Visibility (Translucent, Opaque), Barrier Type (Low barrier bottles, High barrier bottles), Visibility, Bottle Capacity, End-User Industry & Region - Forecast to 2022 - 2028
HDPE Bottles Market Snapshot
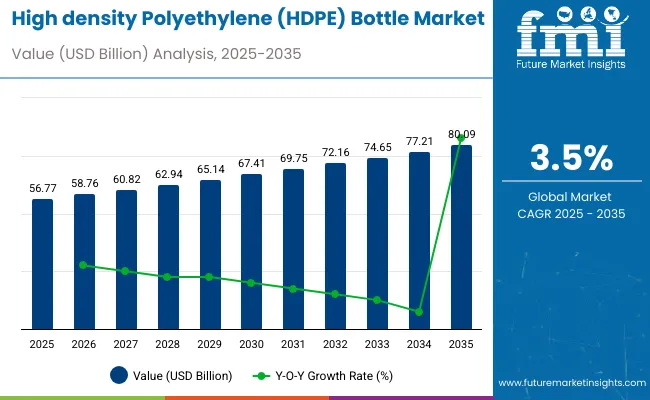
[294 pages Report] The global HDPE bottles market is valued at USD 55.8 Billion in 2022 and is expected to reach USD 67.2 Billion by 2028, at a CAGR of 3.1% from 2022 to 2028.
Market Size 2022 |
USD 55.8 Bn |
Market Size 2028 |
USD 67.2 Bn |
Value CAGR (2022-2028) |
3.1% |
Collective Value Share: Top 3 Countries (2022E) |
49% |
In terms of volume, the HDPE bottles market has been forecast to increase at 2.8% CAGR over the future period.
The HDPE bottles market synopsis shows that the value of overall HDPE bottles market is expected to increase at a year-on-year (YoY) growth of 3.1 % in 2022. The HDPE bottles market is anticipated to be led by the Asia Pacific region which is projected to capture a significant market share of more than 40% in 2022.
The analyst also estimates that in 2022, the Mexico HDPE bottles market will increase 4.4% year on year. Across the whole of Latin America, total revenue of HDPE bottles is forecast to reach USD 1.2 Billion in 2022.
2013-2021 HDPE Bottles Market Outlook Compared to 2022-2028 Forecast
HDPE bottles market is expected to showcase a remarkable 3.1% CAGR between the forecast years 2022 and 2028, on contrary to 2.5% shown during historic years between 2013 and 2021. This exponential rise in growth is accounted due to increase in demand from personal care & cosmetics and homecare & toiletries end-user industries.
The global HDPE bottles market is segmented into end use industries such as food & beverages, pharmaceuticals, chemicals, personal care & cosmetics and others. Among them chemicals end user industry is anticipated to capture prominent positions in the market share.
Growth in chemical, cosmetic and homecare industry drives the packaging sector to new soaring heights. HDPE bottles are widely used for milk, household chemicals, pharmaceuticals, and automotive products.
The packaging of low quantity chemicals and drugs for household and over-the-counter applications are done in the HDPE bottles. Due to the higher abrasion and chemical resistance, these resist strong acids and alkalis, and are less susceptible to surge shocks.
Therefore, HDPE bottles are highly preferred to store chemical products. The translucent property makes them a more considerable packaging format due to the need for highest modulus and lowest permeability.
On a smaller scale, a mix of strength, low porousness, and high natural pressure break opposition makes HDPE bottles the best fit to contain family unit, mechanical, and car synthetic compounds such as fluid cleanser, blanch, engine oil, and radiator fluid.
HDPE has a brilliant dampness boundary and is appropriate for bundling family unit cleaners. In the cooled and strong state, HDPE bottles have a memory, so even after they are crushed or curved they will tend to come back to their unique shapes. This makes them perfect for use as press bottles in numerous custom arrangements for fluid cleaners.
Notwithstanding crush bottles, HDPE jugs can be utilized as splash holders for home cleaners. Regardless of whether you're searching for a standard round carafe style bottle or a specially formed splash bottle, HDPE can offer the flexibility you're chasing.
Let us know your requirement to get
100% FREE customization
How will the Sustainable Design Level Innovations Provide Lucrative Opportunities for HDPE Bottles Market?
Being recyclable, HDPE is expected to continue to have high preference among manufacturers. HDPE takes centuries to decompose, and therefore, creates an absolute need for recycling. Moreover, the growth in demand for HDPE containers in emerging economies such as countries in Africa, is expected to provide lucrative opportunities for growth.
Also, since the production of containers from HDPE is cost-effective, it is expected to enjoy high preference in these countries. High demand for variety in capacities and shapes has enabled strong competition in design-level innovations.
Furthermore, increase in demand for products such as HDPE, creates opportunities for growth in the global HDPE injection and blow-molded containers market. This sustainable growth will also supplement the recyclability of HDPE bottles market during forecast years.
How will High Recyclability of HDPE Bottles help in Optimization of Packaging Operations?
HDPE bottles are highly recyclable and the process of recycling is very efficient as compared to other plastics. High density polyethylene has a density (specific) of 9.3*10-1 to 9.7*10-1 gram/centimeter3. This very less than that of polyethylene terephthalate, which is near to 14.3*10-1 to 14.5*10-1 gram/centimeter3, which concludes these plastic polymers can be differentiated by use of separation method known as sink-float.
A type of Infra-Red technique known as Near-IR techniques can be also used, unless HDPE plastic is too dark and absorbs these infrared waves. As the cost of raw materials of HDPE bottles is very high as compared to PET, the bottles manufactured by recycled HDPE bottles are more economical.
Bottles made from recycled HDPE material help to reduce carbon dioxide emissions and eliminate the dependency of fossil fuels for production. Crude oil is used in two ways in the production of HDPE bottles- petroleum refining as a raw material and as an energy source for manufacturing.
Due to the manufacturing of HDPE bottles from recycled materials, the dependency on the price of raw material decreases and manufacturers can offer low-cost HDPE bottles to end-user industries.
Unilever Australia & New Zealand have circulated consumer used recycled high density polyethylene plastic for bottles of Australian-made cosmetic, homecare and personal care brands such as Dove, Surf, Sunsilk, OMO, and TRESemmé.
Find your sweet spots for generating winning opportunities in this market.
Talk to AnalystHow was Global HDPE Bottles Market Affected during COVID-19 Pandemic?
During the COVID-19 pandemic, many end-use industries of the HDPE bottles market like automotive, paper, personal care & cosmetics, construction, textile, chemical among others were severely impacted.
The extreme negative impact was the result of restrictions imposed on non-essential products in addition to the global lockdown which reduced demand for these products from the market. However, the spike in need for HDPE bottles in the pharmaceutical and food & beverages, homecare & toiletries end-use industries during the pandemic significantly reduced the blow on the growth rate of the HDPE bottles market.
The gradual removal of restrictions imposed across the globe is resulting in the steadfast recovery of the HDPE bottles market.
HDPE Bottles Market - Country-wise Insights
Why is United States Considered One of the Most Productive Markets for HDPE Bottles?
The HDPE bottles market in the US is expected to attain a market value of USD 8.4 Billion by the end of 2022. The US is anticipated to capture the largest market share for target market globally. As per United States Department of Agriculture, food & food services industries in 2020, account for almost USD 1.7 Trillion.
How the Congruous Growth of Retail Sector in India Augmenting the Demand for HDPE Bottles?
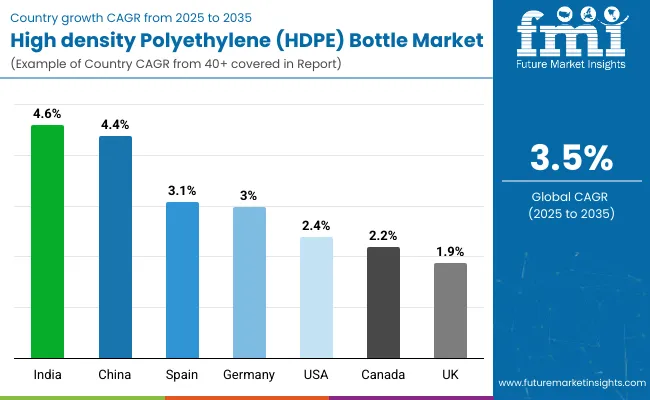
In the Asia Pacific region, the Indian HDPE bottles market is anticipated to grow at a CAGR of 5.3% during the period 2022-2028. The food & beverage sector in India is constantly increasing on the back of the rising per capita income with the spiked change of the Indian subcontinent into an economy which is driven by consumer.
According to the Indian Brand Equity Foundation (IBEF), the country’s fast moving consumer goods market will increase exponentially and reach a value of USD 70 Billion in the year 2025. The consistent growth of the FMCG industry in India is expected to create notable demand for HDPE bottles solutions during the forecast years.

An unified Market Research Subscription Platform, built for today’s disparate research needs.
HDPE Bottles Market - Category-wise Insights
Why the High Barrier Bottles are projected to Anticipate Heightened Demand from the HDPE Bottles Market?
As per future market insights analysis by barrier type, the high barrier bottles segment is projected to be the largest market shareholder in the global market for HDPE bottles with an anticipated market share of almost 71% by 2022. The benefits of that automatic HDPE bottles offers include minimal labor and time constraints, aesthetic appeal and proper product protection.
This will make HDPE bottles ideal solutions for large number of applications in various end-use industries such as food & beverage, chemicals, pharmaceuticals, personal care & cosmetics, homecare & toiletries among others. This will bolster the demand of HDPE bottles in forecast period.
Which is the Leading End User Industry Segment in the HDPE Bottles Market?
Personal care & cosmetics, homecare & toiletries and pharmaceuticals are leading segments in end-use industry for HDPE bottles market, these segments are projected to anticipate to collectively offer an incremental opportunity of USD 9.5 Billion during the future years 2022-28 and will hold 68% market share. Moreover, food & beverages, chemicals will hold 17% & 15% market share respectively and expand at a 1.2 times expansion rate each.
HDPE Bottles Market - Competitive Landscape
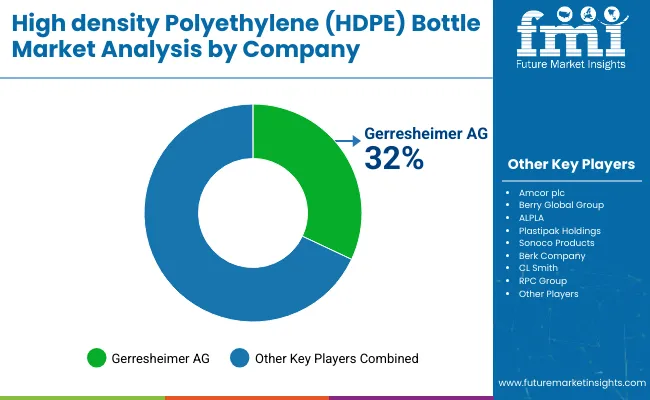
Leading HDPE bottles manufacturers are committed to the research and development of the product and are consistently offering innovative pallet stretch wrapping solutions targeted towards specific end use. Companies operating in the HDPE bottles market are aiming at product launches and expansions with other manufacturers.
- In October 2021, Pact group partnered in collaboration with Goodman Fielder’s Meadow Fresh brand to launch in the market first recycled high density polyethylene milk bottles in New Zealand.
- In September 2020, Berry Global Group Inc. announced its partnership with Bhoomi Global to launch a 100% sugarcane based HDPE bottle for the storage of cold-pressed cane water elixir.
Scope of Report
Attribute |
Details |
Forecast Period |
2022-2028 |
Historical Data Available for |
2013-2021 |
Market Analysis |
US$ Million for Value and Million Units for Volume |
Key Regions Covered |
North America, Latin America, Western Europe, Eastern Europe, Asia Pacific, the Middle East & Africa and Japan |
Key Countries Covered |
United States, Canada, Brazil, Mexico, Germany, Italy, France, U.K., Spain, Russia, Poland, GCC Countries, China, India, and ASEAN Countries |
Key Segments Covered |
Cap Type, Bottle Capacity, Visibility, Neck Type, Barrier Type, End-user Industry |
Key Companies Profiled |
|
Report Coverage |
Market Forecast, Company Share Analysis, Competition Intelligence, DROT Analysis, Market Dynamics and Challenges, and Strategic Growth Initiatives |
Customization & Pricing |
Available upon Request |
HDPE Bottles Market by Category
By Cap Type:
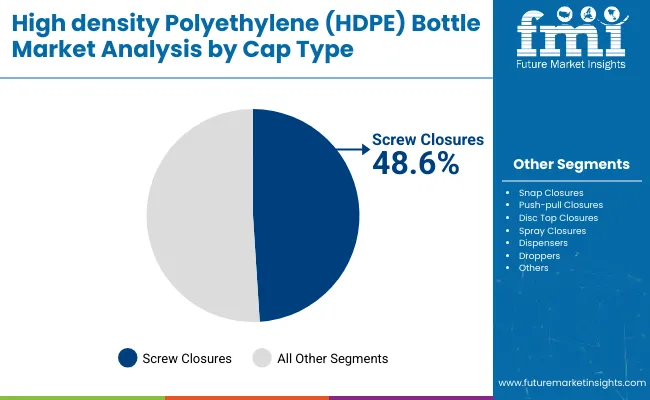
- Screw Closures
- Snap Closures
- Push-Pull Closures
- Disc Top closures
- Spray Closures
- Dispensers
- Dropper
By Bottle Capacity :
- Less than 30 ml
- 31 ml – 100 ml
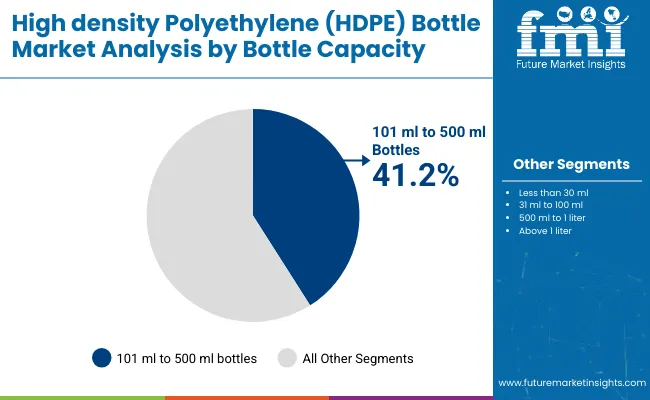
- 101 ml – 500 ml
- 501 ml – 1Lt
- Above 1Lt
By Visibility:
- Translucent
- Opaque
By Neck Type :
- Narrow Mouth Bottles
- Wide Mouth Bottles
By End-user Industry Type :
-
Food & Beverages
- Dairy Products
- Juices
- Others
-
Chemical
- Agro Chemicals
- Industrial Chemicals
- Lubricants & Petrochemicals
- Specialty Chemicals
- Pharmaceuticals
- Personal Care & Cosmetics
- Homecare & Toiletries
By Barrier Type:
- Low-barrier Bottles
- High-barrier Bottles
- Fluorinated Bottles
- Polyamide (PA) Layer Bottles
- Ethylene Vinyl Alcohol (EVOH) Layer Bottles
By Region:
- North America
- Latin America
- Western Europe
- Eastern Europe
- Asia Pacific (APAC)
- Middle East and Africa (MEA)
- Japan
Frequently Asked Questions
The HDPE bottles market is estimated to surpass a valuation of USD 55.8 Billion by 2022.
HDPE bottles market will register gradual rise in the sales. As per FMI, the market will register a CAGR of 3.1% between 2022 and 2028.
North America market is estimated to hold over 16.5 % value share in the global HDPE bottles market in 2022.
FMI has forecast the APAC HDPE bottles market to exhibit a CAGR of 4.4% between 2022 and 2028.
The U.S., China, Germany, India and Japan are among leading markets for HDPE bottles, exhibiting consistently high demand.
Personal care & cosmetics are the leading segments in end-user industry and are estimated to hold about 24% of the market share in 2022.
1. Executive Summary
1.1. Global Market Overview
1.2. Market Analysis
1.3. Analysis and Recommendations
2. Market Overview
2.1. Market Definition
2.2. Market Coverage
3. Key Market Trends
3.1. Key Trends Impacting the Market
3.2. Product Innovation / Development Trends
4. Key Success Factors
4.1. Product Adoption / Usage Analysis
4.2. Product USPs / Features
5. Global HDPE Bottles Market Demand Analysis 2013-2021 and Forecast, 2022-2028
5.1. Historical Market Volume (Mn Units) Analysis, 2013-2021
5.2. Current and Future Market Volume (Mn Units) Projections, 2022-2028
5.3. Y-o-Y Growth Trend Analysis
6. Global HDPE Bottles Market - Pricing Analysis
6.1. Regional Pricing Analysis, By Bottle Capacity
6.2. Pricing Break-up
6.3. Global Average Pricing Analysis Benchmark
7. Global HDPE Bottles Market Demand (US$ Mn) Analysis 2013-2021 and Forecast, 2022-2028
7.1. Historical Market Value (US$ Mn) Analysis, 2013-2021
7.2. Current and Future Market Value (US$ Mn) Projections, 2022-2028
7.2.1. Y-o-Y Growth Trend Analysis
7.2.2. Absolute $ Opportunity Analysis
8. Market Background
8.1. Global Packaging Market Overview
8.2. Global Flexible Packaging Market Overview
8.3. Macro-Economic Factors & Co-relation Analysis
8.3.1. Global Packaging Industry Growth
8.3.2. Global Rigid Packaging Industry Growth
8.3.3. Global Plastic Bottles Market Overview
8.3.4. GDP Growth
8.3.5. COVID-19 Pandemic
8.4. Forecast Factors - Relevance & Impact
8.4.1. Global Packaging Market Growth
8.4.2. Global Flexible Packaging Market Outlook
8.4.3. Global Retail Sector Growth
8.4.4. Segmental Revenue Growth of Key Players
8.4.5. Global Plastic Industry Overview
8.5. Value Chain Analysis
8.5.1. Key Participants
8.5.1.1. Raw Bottle Capacity Suppliers
8.5.1.2. HDPE Bottles Manufacturers
8.5.1.3. End Users
8.5.2. Profitability Margin
8.6. Market Dynamics
8.6.1. Drivers
8.6.2. Restraints
8.6.3. Opportunity Analysis
9. Impact of COVID-19
9.1. Current Statistics and Probable Future Impact
9.2. Impact of COVID-19 on HDPE Bottles Market
10. Global HDPE Bottles Market Analysis 2013-2021 and Forecast 2022-2028, By Cap Type
10.1. Introduction
10.2. Historical Market Size (US$ Mn) and Volume (Mn Units) Analysis, By Cap Type, 2013-2021
10.3. Current and Future Market Size (US$ Mn) and Volume (Mn Units) Analysis and Forecast, By Cap Type, 2022-2028
10.3.1. Screw Closures
10.3.2. Snap Closures
10.3.3. Push-Pull Closures
10.3.4. Disc Top closures
10.3.5. Spray Closures
10.3.6. Dispensers
10.3.7. Dropper
10.4. Market Attractiveness Analysis, By Neck Type
11. Global HDPE Bottles Market Analysis 2013-2021 and Forecast 2022-2028, By Bottle Capacity
11.1. Introduction
11.2. Historical Market Size (US$ Mn) and Volume (Mn Units) Analysis, By Bottle Capacity, 2013-2021
11.3. Current and Future Market Size (US$ Mn) and Volume (Mn Units) Analysis and Forecast, By Bottle Capacity, 2022-2028
11.3.1. Less than 30 ml
11.3.2. 31 ml – 100 ml
11.3.3. 101 ml – 500 ml
11.3.4. 501 ml – 1Lt
11.3.5. Above 1Lt
11.4. Market Attractiveness Analysis, By Bottle Capacity
12. Global HDPE Bottles Market Analysis 2013-2021 and Forecast 2022-2028, By Visibility
12.1. Introduction
12.2. Historical Market Size (US$ Mn) and Volume (Mn Units) Analysis, By Visibility, 2013-2021
12.3. Current and Future Market Size (US$ Mn) and Volume (Mn Units) Analysis and Forecast, By Visibility, 2022-2028
12.3.1. Translucent
12.3.2. Opaque
12.4. Market Attractiveness Analysis, By Visibility
13. Global HDPE Bottles Market Analysis 2013-2021 and Forecast 2022-2028, By Neck Type
13.1. Introduction
13.2. Historical Market Size (US$ Mn) and Volume (Mn Units) Analysis, By Product Type, 2013-2021
13.3. Current and Future Market Size (US$ Mn) and Volume (Mn Units) Analysis and Forecast, By Product Type, 2022-2028
13.3.1. Narrow Mouth Bottles
13.3.2. Wide Mouth Bottles
13.4. Market Attractiveness Analysis, By Product Type
14. Global HDPE Bottles Market Analysis 2013-2021 and Forecast 2022-2028, By End Use
14.1. Introduction
14.2. Historical Market Size (US$ Mn) and Volume (Mn Units) Analysis, By End User Industry, 2013-2021
14.3. Current and Future Market Size (US$ Mn) and Volume (Mn Units) Analysis and Forecast, By End User Industry, 2022-2028
14.3.1. Food & Beverages
14.3.1.1. Dairy Products
14.3.1.2. Juices
14.3.1.3. Others
14.3.2. Chemical
14.3.2.1. Agrochemicals
14.3.2.2. Industrial Chemicals
14.3.2.3. Lubricants & Petrochemicals
14.3.2.4. Specialty Chemicals
14.3.3. Pharmaceuticals
14.3.4. Personal Care & Cosmetics
14.3.5. Homecare & Toiletries
14.4. Market Attractiveness Analysis, By End User Industry
15. Global HDPE Bottles Market Analysis 2013-2021 and Forecast 2022-2028, By Barrier Type
15.1. Introduction
15.2. Historical Market Size (US$ Mn) and Volume (Mn Units) Analysis, By Barrier Type, 2013-2021
15.3. Current and Future Market Size (US$ Mn) and Volume (Mn Units) Analysis and Forecast, By Barrier Type, 2022-2028
15.3.1. Low Barrier Bottles
15.3.2. High Barrier Bottles
15.3.2.1. Fluorinated Bottles
15.3.2.2. Polyamide (PA) Layer Bottles
15.3.2.3. Ethylene Vinyl Alcohol (EVOH) Layer Bottles
15.4. Market Attractiveness Analysis, by Barrier Type
16. Global HDPE Bottles Market Analysis 2013-2021 and Forecast 2022-2028, By Region
16.1. Introduction
16.2. Historical Market Size (US$ Mn) and Volume (Mn Units) Analysis, by Region, 2013-2021
16.3. Current Market Size (US$ Mn) and Volume (Mn Units) Analysis and Forecast, by Region, 2022-2028
16.3.1. North America
16.3.2. Latin America
16.3.3. Western Europe
16.3.4. Eastern Europe
16.3.5. Asia Pacific (APAC)
16.3.6. Middle East and Africa (MEA)
16.3.7. Japan
16.4. Market Attractiveness Analysis, by Region
17. North America HDPE Bottles Market Analysis 2013-2021 and Forecast 2022-2028
17.1. Introduction
17.2. Historical Market Size (US$ Mn) and Volume (Mn Units) Trend Analysis, by Market Taxonomy, 2013-2021
17.3. Market Size (US$ Mn) and Volume (Mn Units) Forecast, by Market Taxonomy, 2022-2028
17.3.1. By Country
17.3.1.1. U.S.
17.3.1.2. Canada
17.3.2. By Cap Type
17.3.3. By Bottle Capacity
17.3.4. By Visibility
17.3.5. By Neck Type
17.3.6. By End User Industry
17.3.7. By Barrier Type
17.4. Market Attractiveness Analysis
17.4.1. By Country
17.4.2. By Cap Type
17.4.3. By Bottle Capacity
17.4.4. By Visibility
17.4.5. By Neck Type
17.4.6. By End User Industry
17.4.7. By Barrier Type
18. Latin America HDPE Bottles Market Analysis 2013-2021 and Forecast 2022-2028
18.1. Introduction
18.2. Historical Market Size (US$ Mn) and Volume (Mn Units) Trend Analysis, by Market Taxonomy, 2013-2021
18.3. Market Size (US$ Mn) and Volume (Mn Units) Forecast, by Market Taxonomy, 2022-2028
18.3.1. By Country
18.3.1.1. Brazil
18.3.1.2. Mexico
18.3.1.3. Argentina
18.3.1.4. Rest of Latin America
18.3.2. By Cap Type
18.3.3. By Bottle Capacity
18.3.4. By Visibility
18.3.5. By Neck Type
18.3.6. By End User Industry
18.3.7. By Barrier Type
18.4. Market Attractiveness Analysis
18.4.1. By Country
18.4.2. By Cap Type
18.4.3. By Bottle Capacity
18.4.4. By Visibility
18.4.5. By Neck Type
18.4.6. By End User Industry
18.4.7. By Barrier Type e
19. Western Europe HDPE Bottles Market Analysis 2013-2021 and Forecast 2022-2028
19.1. Introduction
19.2. Historical Market Size (US$ Mn) and Volume (Mn Units) Trend Analysis, by Market Taxonomy, 2013-2021
19.3. Market Size (US$ Mn) and Volume (Mn Units) Forecast, by Market Taxonomy, 2022-2028
19.3.1. By Country
19.3.1.1. Germany
19.3.1.2. Italy
19.3.1.3. France
19.3.1.4. U.K.
19.3.1.5. Spain
19.3.1.6. BENELUX
19.3.1.7. Nordics
19.3.1.8. Rest of Western Europe
19.3.2. By Cap Type
19.3.3. By Bottle Capacity
19.3.4. By Visibility
19.3.5. By Neck Type
19.3.6. By End User Industry
19.3.7. By Barrier Type
19.4. Market Attractiveness Analysis
19.4.1. By Country
19.4.2. By Cap Type
19.4.3. By Bottle Capacity
19.4.4. By Visibility
19.4.5. By Neck Type
19.4.6. By End User Industry
19.4.7. By Barrier Type
20. Eastern Europe HDPE Bottles Market Analysis 2013-2021 and Forecast 2022-2028
20.1. Introduction
20.2. Historical Market Size (US$ Mn) and Volume (Mn Units) Trend Analysis, by Market Taxonomy, 2013-2021
20.3. Market Size (US$ Mn) and Volume (Mn Units) Forecast, by Market Taxonomy, 2022-2028
20.3.1. By Country
20.3.1.1. Russia
20.3.1.2. Poland
20.3.1.3. Rest of Eastern Europe
20.3.2. By Cap Type
20.3.3. By Bottle Capacity
20.3.4. By Visibility
20.3.5. By Neck Type
20.3.6. By End User Industry
20.3.7. By Barrier Type
20.4. Market Attractiveness Analysis
20.4.1. By Country
20.4.2. By Cap Type
20.4.3. By Bottle Capacity
20.4.4. By Visibility
20.4.5. By Neck Type
20.4.6. By End User Industry
20.4.7. By Barrier Type
21. Asia Pacific (APAC) HDPE Bottles Market Analysis 2013-2021 and Forecast 2022-2028
21.1. Introduction
21.2. Historical Market Size (US$ Mn) and Volume (Mn Units) Trend Analysis, by Market Taxonomy, 2013-2021
21.3. Market Size (US$ Mn) and Volume (Mn Units) Forecast, by Market Taxonomy, 2022-2028
21.3.1. By Country
21.3.1.1. China
21.3.1.2. India
21.3.1.3. Australia & New Zealand
21.3.1.4. ASEAN
21.3.1.5. Rest of Asia Pacific excluding Japan (APEJ)
21.3.2. By Cap Type
21.3.3. By Bottle Capacity
21.3.4. By Visibility
21.3.5. By Neck Type
21.3.6. By End User Industry
21.3.7. By Barrier Type
21.4. Market Attractiveness Analysis
21.4.1. By Country
21.4.2. By Cap Type
21.4.3. By Bottle Capacity
21.4.4. By Visibility
21.4.5. By Neck Type
21.4.6. By End User Industry
21.4.7. By Barrier Type
22. Middle East and Africa HDPE Bottles Market Analysis 2013-2021 and Forecast 2022-2028
22.1. Introduction
22.2. Historical Market Size (US$ Mn) and Volume (Mn Units) Trend Analysis, by Market Taxonomy, 2013-2021
22.3. Market Size (US$ Mn) and Volume (Mn Units) Forecast, by Market Taxonomy, 2022-2028
22.3.1. By Country
22.3.1.1. GCC Countries
22.3.1.2. South Africa
22.3.1.3. Northern Africa
22.3.1.4. Rest of Middle East and Africa
22.3.2. By Cap Type
22.3.3. By Bottle Capacity
22.3.4. By Visibility
22.3.5. By Neck Type
22.3.6. By End User Industry
22.3.7. By Barrier Type
22.4. Market Attractiveness Analysis
22.4.1. By Country
22.4.2. By Cap Type
22.4.3. By Bottle Capacity
22.4.4. By Visibility
22.4.5. By Neck Type
22.4.6. By End User Industry
22.4.7. By Barrier Type
23. Japan HDPE Bottles Market Analysis 2013-2021 and Forecast 2022-2028
23.1. Introduction
23.2. Historical Market Size (US$ Mn) and Volume (Mn Units) Trend Analysis, by Market Taxonomy, 2013-2021
23.3. Market Size (US$ Mn) and Volume (Mn Units) Forecast, by Market Taxonomy, 2022-2028
23.3.1. By Cap Type
23.3.2. By Bottle Capacity
23.3.3. By Visibility
23.3.4. By Neck Type
23.3.5. By End User Industry
23.3.6. By Barrier Type
23.4. Market Attractiveness Analysis
23.4.1. By Cap Type
23.4.2. By Bottle Capacity
23.4.3. By Visibility
23.4.4. By Neck Type
23.4.5. By End User Industry
23.4.6. By Barrier Type
24. HDPE Bottles Market Country wise Analysis 2022 & 2028
24.1. U.S. HDPE Bottles Market Analysis
24.1.1. Market Volume (Mn Units) and Value (US$ Mn) Analysis and Forecast, by Market Taxonomy
24.1.1.1. By Cap Type
24.1.1.2. By Bottle Capacity
24.1.1.3. By Visibility
24.1.1.4. By Neck Type
24.1.1.5. By End User Industry
24.1.1.6. By Barrier Type
24.2. Canada HDPE Bottles Market Analysis
24.2.1. Market Volume (Mn Units) and Value (US$ Mn) Analysis and Forecast, by Market Taxonomy
24.2.1.1. By Cap Type
24.2.1.2. By Bottle Capacity
24.2.1.3. By Visibility
24.2.1.4. By Neck Type
24.2.1.5. By End User Industry
24.2.1.6. By Barrier Type
24.3. Brazil HDPE Bottles Market Analysis
24.3.1. Market Volume (Mn Units) and Value (US$ Mn) Analysis and Forecast, by Market Taxonomy
24.3.1.1. By Cap Type
24.3.1.2. By Bottle Capacity
24.3.1.3. By Visibility
24.3.1.4. By Neck Type
24.3.1.5. By End User Industry
24.3.1.6. By Barrier Type
24.4. Mexico HDPE Bottles Market Analysis
24.4.1. Market Volume (Mn Units) and Value (US$ Mn) Analysis and Forecast, by Market Taxonomy
24.4.1.1. By Cap Type
24.4.1.2. By Bottle Capacity
24.4.1.3. By Visibility
24.4.1.4. By Neck Type
24.4.1.5. By End User Industry
24.4.1.6. By Barrier Type
24.5. Germany HDPE Bottles Market Analysis
24.5.1. Market Volume (Mn Units) and Value (US$ Mn) Analysis and Forecast, by Market Taxonomy
24.5.1.1. By Cap Type
24.5.1.2. By Bottle Capacity
24.5.1.3. By Visibility
24.5.1.4. By Neck Type
24.5.1.5. By End User Industry
24.5.1.6. By Barrier Type
24.6. Spain HDPE Bottles Market Analysis
24.6.1. Market Volume (Mn Units) and Value (US$ Mn) Analysis and Forecast, by Market Taxonomy
24.6.1.1. By Cap Type
24.6.1.2. By Bottle Capacity
24.6.1.3. By Visibility
24.6.1.4. By Neck Type
24.6.1.5. By End User Industry
24.6.1.6. By Barrier Type
24.7. Italy HDPE Bottles Market Analysis
24.7.1. Market Volume (Mn Units) and Value (US$ Mn) Analysis and Forecast, by Market Taxonomy
24.7.1.1. By Cap Type
24.7.1.2. By Bottle Capacity
24.7.1.3. By Visibility
24.7.1.4. By Neck Type
24.7.1.5. By End User Industry
24.7.1.6. By Barrier Type
24.8. France HDPE Bottles Market Analysis
24.8.1. Market Volume (Mn Units) and Value (US$ Mn) Analysis and Forecast, by Market Taxonomy
24.8.1.1. By Cap Type
24.8.1.2. By Bottle Capacity
24.8.1.3. By Visibility
24.8.1.4. By Neck Type
24.8.1.5. By End User Industry
24.8.1.6. By Barrier Type
24.9. U.K. HDPE Bottles Market Analysis
24.9.1. Market Volume (Mn Units) and Value (US$ Mn) Analysis and Forecast, by Market Taxonomy
24.9.1.1. By Cap Type
24.9.1.2. By Bottle Capacity
24.9.1.3. By Visibility
24.9.1.4. By Neck Type
24.9.1.5. By End User Industry
24.9.1.6. By Barrier Type
24.10. Russia HDPE Bottles Market Analysis
24.10.1. Market Volume (Mn Units) and Value (US$ Mn) Analysis and Forecast, by Market Taxonomy
24.10.1.1. By Cap Type
24.10.1.2. By Bottle Capacity
24.10.1.3. By Visibility
24.10.1.4. By Neck Type
24.10.1.5. By End User Industry
24.10.1.6. By Barrier Type
24.11. China HDPE Bottles Market Analysis
24.11.1. Market Volume (Mn Units) and Value (US$ Mn) Analysis and Forecast, by Market Taxonomy
24.11.1.1. By Cap Type
24.11.1.2. By Bottle Capacity
24.11.1.3. By Visibility
24.11.1.4. By Neck Type
24.11.1.5. By End User Industry
24.11.1.6. By Barrier Type
24.12. India HDPE Bottles Market Analysis
24.12.1. Market Volume (Mn Units) and Value (US$ Mn) Analysis and Forecast, by Market Taxonomy
24.12.1.1. By Cap Type
24.12.1.2. By Bottle Capacity
24.12.1.3. By Visibility
24.12.1.4. By Neck Type
24.12.1.5. By End User Industry
24.12.1.6. By Barrier Type
24.13. Australia & New Zealand HDPE Bottles Market Analysis
24.13.1. Market Volume (Mn Units) and Value (US$ Mn) Analysis and Forecast, by Market Taxonomy
24.13.1.1. By Cap Type
24.13.1.2. By Bottle Capacity
24.13.1.3. By Visibility
24.13.1.4. By Neck Type
24.13.1.5. By End User Industry
24.13.1.6. By Barrier Type
24.14. GCC Countries HDPE Bottles Market Analysis
24.14.1. Market Volume (Mn Units) and Value (US$ Mn) Analysis and Forecast, by Market Taxonomy
24.14.1.1. By Cap Type
24.14.1.2. By Bottle Capacity
24.14.1.3. By Visibility
24.14.1.4. By Neck Type
24.14.1.5. By End User Industry
24.14.1.6. By Barrier Type
24.15. South Africa HDPE Bottles Market Analysis
24.15.1. Market Volume (Mn Units) and Value (US$ Mn) Analysis and Forecast, by Market Taxonomy
24.15.1.1. By Cap Type
24.15.1.2. By Bottle Capacity
24.15.1.3. By Visibility
24.15.1.4. By Neck Type
24.15.1.5. By End User Industry
24.15.1.6. By Barrier Type
25. Market Structure Analysis
25.1. Market Analysis, by Tier of HDPE Bottles Companies
25.2. Market Share Analysis of Top Players
25.3. Market Presence Analysis
25.3.1. By Operating Regions
25.3.2. By Product Portfolio
26. Competition Analysis
26.1. Competition Dashboard
26.2. Competition Benchmarking
26.3. Competition Deep Dive
26.3.1. Gerreshemier AG
26.3.1.1. Overview
26.3.1.2. Product Portfolio
26.3.1.3. Profitability by Market Segments
26.3.1.4. Sales Footprint
26.3.1.5. Strategy Overview
26.3.1.5.1. Marketing Strategy
26.3.1.5.2. Product Strategy
26.3.1.5.3. Channel Strategy
26.3.2. Berry Global Group Inc.
26.3.2.1. Overview
26.3.2.2. Product Portfolio
26.3.2.3. Profitability by Market Segments
26.3.2.4. Sales Footprint
26.3.2.5. Strategy Overview
26.3.2.5.1. Marketing Strategy
26.3.2.5.2. Product Strategy
26.3.2.5.3. Channel Strategy
26.3.3. Silgan Plastics Closure Solutions
26.3.3.1. Overview
26.3.3.2. Product Portfolio
26.3.3.3. Profitability by Market Segments
26.3.3.4. Sales Footprint
26.3.3.5. Strategy Overview
26.3.3.5.1. Marketing Strategy
26.3.3.5.2. Product Strategy
26.3.3.5.3. Channel Strategy
26.3.4. O Berk Company LLC
26.3.4.1. Overview
26.3.4.2. Product Portfolio
26.3.4.3. Profitability by Market Segments
26.3.4.4. Sales Footprint
26.3.4.5. Strategy Overview
26.3.4.5.1. Marketing Strategy
26.3.4.5.2. Product Strategy
26.3.4.5.3. Channel Strategy
26.3.5. Amcor Ltd.
26.3.5.1. Overview
26.3.5.2. Product Portfolio
26.3.5.3. Profitability by Market Segments
26.3.5.4. Sales Footprint
26.3.5.5. Strategy Overview
26.3.5.5.1. Marketing Strategy
26.3.5.5.2. Product Strategy
26.3.5.5.3. Channel Strategy
26.3.6. CL Smith
26.3.6.1. Overview
26.3.6.2. Product Portfolio
26.3.6.3. Profitability by Market Segments
26.3.6.4. Sales Footprint
26.3.6.5. Strategy Overview
26.3.6.5.1. Marketing Strategy
26.3.6.5.2. Product Strategy
26.3.6.5.3. Channel Strategy
26.3.7. RPC Group Plc
26.3.7.1. Overview
26.3.7.2. Product Portfolio
26.3.7.3. Profitability by Market Segments
26.3.7.4. Sales Footprint
26.3.7.5. Strategy Overview
26.3.7.5.1. Marketing Strategy
26.3.7.5.2. Product Strategy
26.3.7.5.3. Channel Strategy
26.3.8. Graham Packaging
26.3.8.1. Overview
26.3.8.2. Product Portfolio
26.3.8.3. Profitability by Market Segments
26.3.8.4. Sales Footprint
26.3.8.5. Strategy Overview
26.3.8.5.1. Marketing Strategy
26.3.8.5.2. Product Strategy
26.3.8.5.3. Channel Strategy
26.3.9. Nampac Limited
26.3.9.1. Overview
26.3.9.2. Product Portfolio
26.3.9.3. Profitability by Market Segments
26.3.9.4. Sales Footprint
26.3.9.5. Strategy Overview
26.3.9.5.1. Marketing Strategy
26.3.9.5.2. Product Strategy
26.3.9.5.3. Channel Strategy
26.3.10. ALPLA Werke Alwin Lehner GmbH & Co KG
26.3.10.1. Overview
26.3.10.2. Product Portfolio
26.3.10.3. Profitability by Market Segments
26.3.10.4. Sales Footprint
26.3.10.5. Strategy Overview
26.3.10.5.1. Marketing Strategy
26.3.10.5.2. Product Strategy
26.3.10.5.3. Channel Strategy
27. Assumptions and Acronyms Used
28. Research Methodology
Let us know your requirement to get
100% FREE customization
Table 1: Global HDPE Bottles Value (US$ Mn) and Volume (Mn Units) Forecast, by Bottle Capacity, 2013 – 2028
Table 2: Global HDPE Bottles Value (US$ Mn) and Volume (Mn Units) Forecast, by Cap Type, 2013 – 2028
Table 3: Global HDPE Bottles Value (US$ Mn) and Volume (Mn Units) Forecast, by Visibility, 2013 – 2028
Table 4: Global HDPE Bottles Value (US$ Mn) and Volume (Mn Units) Forecast, by Neck Type, 2013 – 2028
Table 5: Global HDPE Bottles Value (US$ Mn) and Volume (Mn Units) Forecast, by Barrier Type, 2013 – 2028
Table 6: Global HDPE Bottles Value (US$ Mn) and Volume (Mn Units) Forecast, by End-user Industry, 2013 – 2028
Table 7: Global HDPE Bottles Value (US$ Mn) and Volume (Mn Units) Forecast, by End-user Industry, 2013 – 2028
Table 8: Global HDPE Bottles Value (US$ Mn) and Volume (Mn Units) Forecast, by Region, 2013 – 2028
Table 9: North America HDPE Bottles Value (US$ Mn) and Volume (Mn Units) Forecast, by Country, 2013 – 2028
Table 10: North America HDPE Bottles Value (US$ Mn) and Volume (Mn Units) Forecast, by Bottle Capacity, 2013 – 2028
Table 11: North America HDPE Bottles Value (US$ Mn) and Volume (Mn Units) Forecast, by Cap Type, 2013 – 2028
Table 12: North America HDPE Bottles Value (US$ Mn) and Volume (Mn Units) Forecast, by Visibility, 2013 – 2028
Table 13: North America HDPE Bottles Value (US$ Mn) and Volume (Mn Units) Forecast, by Neck Type, 2013 – 2028
Table 14: North America HDPE Bottles Value (US$ Mn) and Volume (Mn Units) Forecast, by Barrier Type, 2013 – 2028
Table 15: North America HDPE Bottles Value (US$ Mn) and Volume (Mn Units) Forecast, by End-user Industry, 2013 – 2028
Table 16: North America HDPE Bottles Value (US$ Mn) and Volume (Mn Units) Forecast, by End-user Industry, 2013 – 2028
Table 17: Latin America HDPE Bottles Value (US$ Mn) and Volume (Mn Units) Forecast, by Country, 2013 – 2028
Table 18: Latin America HDPE Bottles Value (US$ Mn) and Volume (Mn Units) Forecast, by Bottle Capacity, 2013 – 2028
Table 19: Latin America HDPE Bottles Value (US$ Mn) and Volume (Mn Units) Forecast, by Cap Type, 2013 – 2028
Table 20: Latin America HDPE Bottles Value (US$ Mn) and Volume (Mn Units) Forecast, by Visibility, 2013 – 2028
Table 21: Latin America HDPE Bottles Value (US$ Mn) and Volume (Mn Units) Forecast, by Neck Type, 2013 – 2028
Table 22: Latin America HDPE Bottles Value (US$ Mn) and Volume (Mn Units) Forecast, by Barrier Type, 2013 – 2028
Table 23: Latin America HDPE Bottles Value (US$ Mn) and Volume (Mn Units) Forecast, by End-user Industry, 2013 – 2028
Table 24: Latin America HDPE Bottles Value (US$ Mn) and Volume (Mn Units) Forecast, by End-user Industry, 2013 – 2028
Table 25: Western Europe HDPE Bottles Value (US$ Mn) and Volume (Mn Units) Forecast, by Country, 2013 – 2028
Table 26: Western Europe HDPE Bottles Value (US$ Mn) and Volume (Mn Units) Forecast, by Bottle Capacity, 2013 – 2028
Table 27: Western Europe HDPE Bottles Value (US$ Mn) and Volume (Mn Units) Forecast, by Cap Type, 2013 – 2028
Table 28: Western Europe HDPE Bottles Value (US$ Mn) and Volume (Mn Units) Forecast, by Visibility, 2013 – 2028
Table 29: Western Europe HDPE Bottles Value (US$ Mn) and Volume (Mn Units) Forecast, by Neck Type, 2013 – 2028
Table 30: Western Europe HDPE Bottles Value (US$ Mn) and Volume (Mn Units) Forecast, by Barrier Type, 2013 – 2028
Table 31: Western Europe HDPE Bottles Value (US$ Mn) and Volume (Mn Units) Forecast, by End-user Industry, 2013 – 2028
Table 32: Western Europe HDPE Bottles Value (US$ Mn) and Volume (Mn Units) Forecast, by End-user Industry, 2013 – 2028
Table 33: Eastern Europe HDPE Bottles Value (US$ Mn) and Volume (Mn Units) Forecast, by Country, 2013 – 2028
Table 34: Eastern Europe HDPE Bottles Value (US$ Mn) and Volume (Mn Units) Forecast, by Bottle Capacity, 2013 – 2028
Table 35: Eastern Europe HDPE Bottles Value (US$ Mn) and Volume (Mn Units) Forecast, by Cap Type, 2013 – 2028
Table 36: Eastern Europe HDPE Bottles Value (US$ Mn) and Volume (Mn Units) Forecast, by Visibility, 2013 – 2028
Table 37: Eastern Europe HDPE Bottles Value (US$ Mn) and Volume (Mn Units) Forecast, by Neck Type, 2013 – 2028
Table 38: Eastern Europe HDPE Bottles Value (US$ Mn) and Volume (Mn Units) Forecast, by Barrier Type, 2013 – 2028
Table 39: Eastern Europe HDPE Bottles Value (US$ Mn) and Volume (Mn Units) Forecast, by End-user Industry, 2013 – 2028
Table 40: Eastern Europe HDPE Bottles Value (US$ Mn) and Volume (Mn Units) Forecast, by End-user Industry, 2013 – 2028
Table 41: APEJ HDPE Bottles Value (US$ Mn) and Volume (Mn Units) Forecast, by Country, 2013 – 2028
Table 42: APEJ HDPE Bottles Value (US$ Mn) and Volume (Mn Units) Forecast, by Bottle Capacity, 2013 – 2028
Table 43: APEJ HDPE Bottles Value (US$ Mn) and Volume (Mn Units) Forecast, by Cap Type, 2013 – 2028
Table 44: APEJ HDPE Bottles Value (US$ Mn) and Volume (Mn Units) Forecast, by Visibility, 2013 – 2028
Table 45: APEJ HDPE Bottles Value (US$ Mn) and Volume (Mn Units) Forecast, by Neck Type, 2013 – 2028
Table 46: APEJ HDPE Bottles Value (US$ Mn) and Volume (Mn Units) Forecast, by Barrier Type, 2013 – 2028
Table 47: APEJ HDPE Bottles Value (US$ Mn) and Volume (Mn Units) Forecast, by End-user Industry, 2013 – 2028
Table 48: APEJ HDPE Bottles Value (US$ Mn) and Volume (Mn Units) Forecast, by End-user Industry, 2013 – 2028
Table 49: MEA HDPE Bottles Value (US$ Mn) and Volume (Mn Units) Forecast, by Country, 2013 – 2028
Table 50: MEA HDPE Bottles Value (US$ Mn) and Volume (Mn Units) Forecast, by Bottle Capacity, 2013 – 2028
Table 51: MEA HDPE Bottles Value (US$ Mn) and Volume (Mn Units) Forecast, by Cap Type, 2013 – 2028
Table 52: MEA HDPE Bottles Value (US$ Mn) and Volume (Mn Units) Forecast, by Visibility, 2013 – 2028
Table 53: MEA HDPE Bottles Value (US$ Mn) and Volume (Mn Units) Forecast, by Neck Type, 2013 – 2028
Table 54: MEA HDPE Bottles Value (US$ Mn) and Volume (Mn Units) Forecast, by Barrier Type, 2013 – 2028
Table 55: MEA HDPE Bottles Value (US$ Mn) and Volume (Mn Units) Forecast, by End-user Industry, 2013 – 2028
Table 56: MEA HDPE Bottles Value (US$ Mn) and Volume (Mn Units) Forecast, by End-user Industry, 2013 – 2028
Table 57: Japan HDPE Bottles Value (US$ Mn) and Volume (Mn Units) Forecast, by Bottle Capacity, 2013 – 2028
Table 58: Japan HDPE Bottles Value (US$ Mn) and Volume (Mn Units) Forecast, by Cap Type, 2013 – 2028
Table 59: Japan HDPE Bottles Value (US$ Mn) and Volume (Mn Units) Forecast, by Visibility, 2013 – 2028
Table 60: Japan HDPE Bottles Value (US$ Mn) and Volume (Mn Units) Forecast, by Neck Type, 2013 – 2028
Table 61: Japan HDPE Bottles Value (US$ Mn) and Volume (Mn Units) Forecast, by Barrier Type, 2013 – 2028
Table 62: Japan HDPE Bottles Value (US$ Mn) and Volume (Mn Units) Forecast, by End-user Industry, 2013 – 2028
Table 63: Japan HDPE Bottles Value (US$ Mn) and Volume (Mn Units) Forecast, by End-user Industry, 2013 – 2028
Find your sweet spots for generating winning opportunities in this market.
Talk to AnalystFigure 1: Global HDPE Bottles Market BPS Analysis, by Bottle Capacity, 2013(H), 2022(E) & 2028(F)
Figure 2: Global HDPE Bottles Market Y-o-Y growth, by Bottle Capacity, 2014(H) – 2028(F)
Figure 3: Global HDPE Bottles Market Attractiveness Index, by Bottle Capacity, 2022(E) – 2028(F)
Figure 4: Global HDPE Bottles Market BPS Analysis, by Cap Type, 2013(H), 2022(E) & 2028(F)
Figure 5: Global HDPE Bottles Market Y-o-Y growth, by Cap Type, 2014(H) – 2028(F)
Figure 6: Global HDPE Bottles Market Attractiveness Index, by Cap Type, 2022(E) – 2028(F)
Figure 7: Global HDPE Bottles Market BPS Analysis, by Visibility, 2013(H), 2022(E) & 2028(F)
Figure 8: Global HDPE Bottles Market Y-o-Y growth, by Visibility, 2014(H) – 2028(F)
Figure 9: Global HDPE Bottles Market Attractiveness Index, by Visibility, 2022(E) – 2028(F)
Figure 10: Global HDPE Bottles Market BPS Analysis, by Neck Type, 2013(H), 2022(E) & 2028(F)
Figure 11: Global HDPE Bottles Market Y-o-Y growth, by Neck Type, 2014(H) – 2028(F)
Figure 12: Global HDPE Bottles Market Attractiveness Index, by Neck Type, 2022(E) – 2028(F)
Figure 13: Global HDPE Bottles Market BPS Analysis, by Barrier Type, 2013(H), 2022(E) & 2028(F)
Figure 14: Global HDPE Bottles Market Y-o-Y growth, by Barrier Type, 2014(H) – 2028(F)
Figure 15: Global HDPE Bottles Market Value (US$ Mn) and Y-O-Y (%) Growth, by High Barrier Sub-segments
Figure 16: Global HDPE Bottles Market Attractiveness Index, by High Barrier Sub-segments, 2022(E) – 2028(F)
Figure 17: Global HDPE Bottles Market Attractiveness Index, by Barrier Type, 2022(E) – 2028(F)
Figure 18: Global HDPE Bottles Market BPS Analysis, by End-user Industry, 2013(H), 2022(E) & 2028(F)
Figure 19: Global HDPE Bottles Market Y-o-Y growth, by End-user Industry, 2014(H) – 2028(F)
Figure 20: Global HDPE Bottles Market Attractiveness Index, by End-user Industry, 2022(E) – 2028(F)
Figure 21: Global HDPE Bottles Market Value (US$ Mn) and Y-O-Y (%) Growth, by Food & Beverages Sub-segments
Figure 22: Global HDPE Bottles Market Value (US$ Mn) and Y-O-Y (%) Growth, by Chemicals Sub-segments
Figure 23: North America HDPE Bottles Market Absolute $ Opportunity, 2021(A) – 2028(F)
Figure 24: Latin America HDPE Bottles Market Absolute $ Opportunity, 2021(A) – 2028(F)
Figure 25: Western Europe HDPE Bottles Market Absolute $ Opportunity, 2021(A) – 2028(F)
Figure 26: Eastern Europe HDPE Bottles Market Absolute $ Opportunity, 2021(A) – 2028(F)
Figure 27: Asia Pacific HDPE Bottles Market Absolute $ Opportunity, 2021(A) – 2028(F)
Figure 28: Middle East & Africa HDPE Bottles Market Absolute $ Opportunity, 2021(A) – 2028(F)
Figure 29: Japan HDPE Bottles Market Absolute $ Opportunity, 2021(A) – 2028(F)
Figure 30: Global HDPE Bottles Market BPS Analysis, by Region, 2013(H), 2022(E) & 2028(F)
Figure 31: Global HDPE Bottles Market Y-o-Y growth, by Region, 2014(H) – 2028(F)
Figure 32: Global HDPE Bottles Market Attractiveness Index, by Region, 2022(E) – 2028(F)
Figure 33: US HDPE Bottles Market Absolute $ Opportunity, 2021(A) – 2028(F)
Figure 34: Canada HDPE Bottles Market Absolute $ Opportunity, 2021(A) – 2028(F)
Figure 35: North America HDPE Bottles Market BPS Analysis, by Country, 2013(H), 2022(E) & 2028(F)
Figure 36: North America HDPE Bottles Market Y-o-Y growth, by Country, 2014(H) – 2028(F)
Figure 37: North America HDPE Bottles Market Attractiveness Index, by Country, 2022(E) – 2028(F)
Figure 38: North America HDPE Bottles Market BPS Analysis, by Bottle Capacity, 2013(H), 2022(E) & 2028(F)
Figure 39: North America HDPE Bottles Market Y-o-Y growth, by Bottle Capacity, 2014(H) – 2028(F)
Figure 40: North America HDPE Bottles Market Attractiveness Index, by Bottle Capacity, 2022(E) – 2028(F)
Figure 41: North America HDPE Bottles Market BPS Analysis, by Cap Type, 2013(H), 2022(E) & 2028(F)
Figure 42: North America HDPE Bottles Market Y-o-Y growth, by Cap Type, 2014(H) – 2028(F)
Figure 43: North America HDPE Bottles Market Attractiveness Index, by Cap Type, 2022(E) – 2028(F)
Figure 44: North America HDPE Bottles Market BPS Analysis, by Visibility, 2013(H), 2022(E) & 2028(F)
Figure 45: North America HDPE Bottles Market Y-o-Y growth, by Visibility, 2014(H) – 2028(F)
Figure 46: North America HDPE Bottles Market Attractiveness Index, by Visibility, 2022(E) – 2028(F)
Figure 47: North America HDPE Bottles Market BPS Analysis, by Neck Type, 2013(H), 2022(E) & 2028(F)
Figure 48: North America HDPE Bottles Market Y-o-Y growth, by Neck Type, 2014(H) – 2028(F)
Figure 49: North America HDPE Bottles Market Attractiveness Index, by Neck Type, 2022(E) – 2028(F)
Figure 50: North America HDPE Bottles Market BPS Analysis, by Barrier Type, 2013(H), 2022(E) & 2028(F)
Figure 51: North America HDPE Bottles Market Y-o-Y growth, by Barrier Type, 2014(H) – 2028(F)
Figure 52: North America HDPE Bottles Market Value (US$ Mn) and Y-O-Y (%) Growth, by High Barrier Sub-segments
Figure 53: North America HDPE Bottles Market Attractiveness Index, by High Barrier Sub-segments, 2022(E) – 2028(F)
Figure 54: North America HDPE Bottles Market Attractiveness Index, by Barrier Type, 2022(E) – 2028(F)
Figure 55: North America HDPE Bottles Market BPS Analysis, by End-user Industry, 2013(H), 2022(E) & 2028(F)
Figure 56: North America HDPE Bottles Market Y-o-Y growth, by End-user Industry, 2014(H) – 2028(F)
Figure 57: North America HDPE Bottles Market Attractiveness Index, by End-user Industry, 2022(E) – 2028(F)
Figure 58: North America HDPE Bottles Market Value (US$ Mn) and Y-O-Y (%) Growth, by Food & Beverages Sub-segments
Figure 59: North America HDPE Bottles Market Value (US$ Mn) and Y-O-Y (%) Growth, by Chemicals Sub-segments
Figure 60: Brazil HDPE Bottles Market Absolute $ Opportunity, 2021(A) – 2028(F)
Figure 61: Mexico HDPE Bottles Market Absolute $ Opportunity, 2021(A) – 2028(F)
Figure 62: Rest Latin America HDPE Bottles Market Absolute $ Opportunity, 2021(A) – 2028(F)
Figure 63: Latin America HDPE Bottles Market BPS Analysis, by Country, 2013(H), 2022(E) & 2028(F)
Figure 64: Latin America HDPE Bottles Market Y-o-Y growth, by Country, 2014(H) – 2028(F)
Figure 65: Latin America HDPE Bottles Market Attractiveness Index, by Country, 2022(E) – 2028(F)
Figure 66: Latin America HDPE Bottles Market BPS Analysis, by Bottle Capacity, 2013(H), 2022(E) & 2028(F)
Figure 67: Latin America HDPE Bottles Market Y-o-Y growth, by Bottle Capacity, 2014(H) – 2028(F)
Figure 68: Latin America HDPE Bottles Market Attractiveness Index, by Bottle Capacity, 2022(E) – 2028(F)
Figure 69: Latin America HDPE Bottles Market BPS Analysis, by Cap Type, 2013(H), 2022(E) & 2028(F)
Figure 70: Latin America HDPE Bottles Market Y-o-Y growth, by Cap Type, 2014(H) – 2028(F)
Figure 71: Latin America HDPE Bottles Market Attractiveness Index, by Cap Type, 2022(E) – 2028(F)
Figure 72: Latin America HDPE Bottles Market BPS Analysis, by Visibility, 2013(H), 2022(E) & 2028(F)
Figure 73: Latin America HDPE Bottles Market Y-o-Y growth, by Visibility, 2014(H) – 2028(F)
Figure 74: Latin America HDPE Bottles Market Attractiveness Index, by Visibility, 2022(E) – 2028(F)
Figure 75: Latin America HDPE Bottles Market BPS Analysis, by Neck Type, 2013(H), 2022(E) & 2028(F)
Figure 76: Latin America HDPE Bottles Market Y-o-Y growth, by Neck Type, 2014(H) – 2028(F)
Figure 77: Latin America HDPE Bottles Market Attractiveness Index, by Neck Type, 2022(E) – 2028(F)
Figure 78: Latin America HDPE Bottles Market BPS Analysis, by Barrier Type, 2013(H), 2022(E) & 2028(F)
Figure 79: Latin America HDPE Bottles Market Y-o-Y growth, by Barrier Type, 2014(H) – 2028(F)
Figure 80: Latin America HDPE Bottles Market Attractiveness Index, by Barrier Type, 2022(E) – 2028(F)
Figure 81: Latin America HDPE Bottles Market Value (US$ Mn) and Y-O-Y (%) Growth, by High Barrier Sub-segments
Figure 82: Latin America HDPE Bottles Market Attractiveness Index, by High Barrier Sub-segments, 2022(E) – 2028(F)
Figure 83: Latin America HDPE Bottles Market BPS Analysis, by End-user Industry, 2013(H), 2022(E) & 2028(F)
Figure 84: Latin America HDPE Bottles Market Y-o-Y growth, by End-user Industry, 2014(H) – 2028(F)
Figure 85: Latin America HDPE Bottles Market Attractiveness Index, by End-user Industry, 2022(E) – 2028(F)
Figure 86: Latin America HDPE Bottles Market Value (US$ Mn) and Y-O-Y (%) Growth, by Food & Beverages Sub-segments
Figure 87: Latin America HDPE Bottles Market Value (US$ Mn) and Y-O-Y (%) Growth, by Chemicals Sub-segments
Figure 88: Germany HDPE Bottles Market Absolute $ Opportunity, 2021(A) – 2028(F)
Figure 89: Italy HDPE Bottles Market Absolute $ Opportunity, 2021(A) – 2028(F)
Figure 90: France HDPE Bottles Market Absolute $ Opportunity, 2021(A) – 2028(F)
Figure 91: U.K. HDPE Bottles Market Absolute $ Opportunity, 2021(A) – 2028(F)
Figure 92: Spain HDPE Bottles Market Absolute $ Opportunity, 2021(A) – 2028(F)
Figure 93: BENELUX HDPE Bottles Market Absolute $ Opportunity, 2021(A) – 2028(F)
Figure 94: Nordic HDPE Bottles Market Absolute $ Opportunity, 2021(A) – 2028(F)
Figure 95: Rest of Western Europe HDPE Bottles Market Absolute $ Opportunity, 2021(A) – 2028(F)
Figure 96: Western Europe HDPE Bottles Market BPS Analysis, by Country, 2013(H), 2022(E) & 2028(F)
Figure 97: Western Europe HDPE Bottles Market Y-o-Y growth, by Country, 2014(H) – 2028(F)
Figure 98: Western Europe HDPE Bottles Market Attractiveness Index, by Country, 2022(E) – 2028(F)
Figure 99: Western Europe HDPE Bottles Market BPS Analysis, by Bottle Capacity, 2013(H), 2022(E) & 2028(F)
Figure 100: Western Europe HDPE Bottles Market Y-o-Y growth, by Bottle Capacity, 2014(H) – 2028(F)
Figure 101: Western Europe HDPE Bottles Market Attractiveness Index, by Bottle Capacity, 2022(E) – 2028(F)
Figure 102: Western Europe HDPE Bottles Market BPS Analysis, by Cap Type, 2013(H), 2022(E) & 2028(F)
Figure 103: Western Europe HDPE Bottles Market Y-o-Y growth, by Cap Type, 2014(H) – 2028(F)
Figure 104: Western Europe HDPE Bottles Market Attractiveness Index, by Cap Type, 2022(E) – 2028(F)
Figure 105: Western Europe HDPE Bottles Market BPS Analysis, by Visibility, 2013(H), 2022(E) & 2028(F)
Figure 106: Western Europe HDPE Bottles Market Y-o-Y growth, by Visibility, 2014(H) – 2028(F)
Figure 107: Western Europe HDPE Bottles Market Attractiveness Index, by Visibility, 2022(E) – 2028(F)
Figure 108: Western Europe HDPE Bottles Market BPS Analysis, by Neck Type, 2013(H), 2022(E) & 2028(F)
Figure 109: Western Europe HDPE Bottles Market Y-o-Y growth, by Neck Type, 2014(H) – 2028(F)
Figure 110: Western Europe HDPE Bottles Market Attractiveness Index, by Neck Type, 2022(E) – 2028(F)
Figure 111: Western Europe HDPE Bottles Market BPS Analysis, by Barrier Type, 2013(H), 2022(E) & 2028(F)
Figure 112: Western Europe HDPE Bottles Market Y-o-Y growth, by Barrier Type, 2014(H) – 2028(F)
Figure 113: Western Europe HDPE Bottles Market Attractiveness Index, by Barrier Type, 2022(E) – 2028(F)
Figure 114: Western Europe HDPE Bottles Market Value (US$ Mn) and Y-O-Y (%) Growth, by High Barrier Sub-segments
Figure 115: Western Europe HDPE Bottles Market Attractiveness Index, by High Barrier Sub-segments, 2022(E) – 2028(F)
Figure 116: Western Europe HDPE Bottles Market BPS Analysis, by End-user Industry, 2013(H), 2022(E) & 2028(F)
Figure 117: Western Europe HDPE Bottles Market Y-o-Y growth, by End-user Industry, 2014(H) – 2028(F)
Figure 118: Western Europe HDPE Bottles Market Attractiveness Index, by End-user Industry, 2022(E) – 2028(F)
Figure 119: Western Europe HDPE Bottles Market Value (US$ Mn) and Y-O-Y (%) Growth, by Food & Beverages Sub-segments
Figure 120: Western Europe HDPE Bottles Market Value (US$ Mn) and Y-O-Y (%) Growth, by Chemicals Sub-segments
Figure 121: Russia HDPE Bottles Market Absolute $ Opportunity, 2021(A) – 2028(F)
Figure 122: Poland HDPE Bottles Market Absolute $ Opportunity, 2021(A) – 2028(F)
Figure 123: Rest of Eastern Europe HDPE Bottles Market Absolute $ Opportunity, 2021(A) – 2028(F)
Figure 124: Eastern Europe HDPE Bottles Market BPS Analysis, by Country, 2013(H), 2022(E) & 2028(F)
Figure 125: Eastern Europe HDPE Bottles Market Y-o-Y growth, by Country, 2014(H) – 2028(F)
Figure 126: Eastern Europe HDPE Bottles Market Attractiveness Index, by Country, 2022(E) – 2028(F)
Figure 127: Eastern Europe HDPE Bottles Market BPS Analysis, by Bottle Capacity, 2013(H), 2022(E) & 2028(F)
Figure 128: Eastern Europe HDPE Bottles Market Y-o-Y growth, by Bottle Capacity, 2014(H) – 2028(F)
Figure 129: Eastern Europe HDPE Bottles Market Attractiveness Index, by Bottle Capacity, 2022(E) – 2028(F)
Figure 130: Eastern Europe HDPE Bottles Market BPS Analysis, by Cap Type, 2013(H), 2022(E) & 2028(F)
Figure 131: Eastern Europe HDPE Bottles Market Y-o-Y growth, by Cap Type, 2014(H) – 2028(F)
Figure 132: Eastern Europe HDPE Bottles Market Attractiveness Index, by Cap Type, 2022(E) – 2028(F)
Figure 133: Eastern Europe HDPE Bottles Market BPS Analysis, by Visibility, 2013(H), 2022(E) & 2028(F)
Figure 134: Eastern Europe HDPE Bottles Market Y-o-Y growth, by Visibility, 2014(H) – 2028(F)
Figure 135: Eastern Europe HDPE Bottles Market Attractiveness Index, by Visibility, 2022(E) – 2028(F)
Figure 136: Eastern Europe HDPE Bottles Market BPS Analysis, by Neck Type, 2013(H), 2022(E) & 2028(F)
Figure 137: Eastern Europe HDPE Bottles Market Y-o-Y growth, by Neck Type, 2014(H) – 2028(F)
Figure 138: Eastern Europe HDPE Bottles Market Attractiveness Index, by Neck Type, 2022(E) – 2028(F)
Figure 139: Eastern Europe HDPE Bottles Market BPS Analysis, by Barrier Type, 2013(H), 2022(E) & 2028(F)
Figure 140: Eastern Europe HDPE Bottles Market Y-o-Y growth, by Barrier Type, 2014(H) – 2028(F)
Figure 141: Eastern Europe HDPE Bottles Market Attractiveness Index, by Barrier Type, 2022(E) – 2028(F)
Figure 142: Eastern Europe HDPE Bottles Market Value (US$ Mn) and Y-O-Y (%) Growth, by High Barrier Sub-segments
Figure 143: Eastern Europe HDPE Bottles Market Attractiveness Index, by High Barrier Sub-segments, 2022(E) – 2028(F)
Figure 144: Eastern Europe HDPE Bottles Market BPS Analysis, by End-user Industry, 2013(H), 2022(E) & 2028(F)
Figure 145: Eastern Europe HDPE Bottles Market Y-o-Y growth, by End-user Industry, 2014(H) – 2028(F)
Figure 146: Eastern Europe HDPE Bottles Market Attractiveness Index, by End-user Industry, 2022(E) – 2028(F)
Figure 147: Eastern Europe HDPE Bottles Market Value (US$ Mn) and Y-O-Y (%) Growth, by Food & Beverages Sub-segments
Figure 148: Eastern Europe HDPE Bottles Market Value (US$ Mn) and Y-O-Y (%) Growth, by Chemicals Sub-segments
Figure 149: China HDPE Bottles Market Absolute $ Opportunity, 2021(A) – 2028(F)
Figure 150: India HDPE Bottles Market Absolute $ Opportunity, 2021(A) – 2028(F)
Figure 151: ASEAN HDPE Bottles Market Absolute $ Opportunity, 2021(A) – 2028(F)
Figure 152: South Korea HDPE Bottles Market Absolute $ Opportunity, 2021(A) – 2028(F)
Figure 153: Australia and New Zealand HDPE Bottles Market Absolute $ Opportunity, 2021(A) – 2028(F)
Figure 154: Rest of APEJ HDPE Bottles Market Absolute $ Opportunity, 2021(A) – 2028(F)
Figure 155: APEJ HDPE Bottles Market BPS Analysis, by Country, 2013(H), 2022(E) & 2028(F)
Figure 156: APEJ HDPE Bottles Market Y-o-Y growth, by Country, 2014(H) – 2028(F)
Figure 157: APEJ HDPE Bottles Market Attractiveness Index, by Country, 2022(E) – 2028(F)
Figure 158: APEJ HDPE Bottles Market BPS Analysis, by Bottle Capacity, 2013(H), 2022(E) & 2028(F)
Figure 159: APEJ HDPE Bottles Market Y-o-Y growth, by Bottle Capacity, 2014(H) – 2028(F)
Figure 160: APEJ HDPE Bottles Market Attractiveness Index, by Bottle Capacity, 2022(E) – 2028(F)
Figure 161: APEJ HDPE Bottles Market BPS Analysis, by Cap Type, 2013(H), 2022(E) & 2028(F)
Figure 162: APEJ HDPE Bottles Market Y-o-Y growth, by Cap Type, 2014(H) – 2028(F)
Figure 163: APEJ HDPE Bottles Market Attractiveness Index, by Cap Type, 2022(E) – 2028(F)
Figure 164: APEJ HDPE Bottles Market BPS Analysis, by Visibility, 2013(H), 2022(E) & 2028(F)
Figure 165: APEJ HDPE Bottles Market Y-o-Y growth, by Visibility, 2014(H) – 2028(F)
Figure 166: APEJ HDPE Bottles Market Attractiveness Index, by Visibility, 2022(E) – 2028(F)
Figure 167: APEJ HDPE Bottles Market BPS Analysis, by Neck Type, 2013(H), 2022(E) & 2028(F)
Figure 168: APEJ HDPE Bottles Market Y-o-Y growth, by Neck Type, 2014(H) – 2028(F)
Figure 169: APEJ HDPE Bottles Market Attractiveness Index, by Neck Type, 2022(E) – 2028(F)
Figure 170: APEJ HDPE Bottles Market BPS Analysis, by Barrier Type, 2013(H), 2022(E) & 2028(F)
Figure 171: APEJ HDPE Bottles Market Y-o-Y growth, by Barrier Type, 2014(H) – 2028(F)
Figure 172: APEJ HDPE Bottles Market Attractiveness Index, by Barrier Type, 2022(E) – 2028(F)
Figure 173: APEJ HDPE Bottles Market Value (US$ Mn) and Y-O-Y (%) Growth, by High Barrier Sub-segments
Figure 174: APEJ HDPE Bottles Market Attractiveness Index, by High Barrier Sub-segments, 2022(E) – 2028(F)
Figure 175: APEJ HDPE Bottles Market BPS Analysis, by End-user Industry, 2013(H), 2022(E) & 2028(F)
Figure 176: APEJ HDPE Bottles Market Y-o-Y growth, by End-user Industry, 2014(H) – 2028(F)
Figure 177: APEJ HDPE Bottles Market Attractiveness Index, by End-user Industry, 2022(E) – 2028(F)
Figure 178: APEJ HDPE Bottles Market Value (US$ Mn) and Y-O-Y (%) Growth, by Food & Beverages Sub-segments
Figure 179: APEJ HDPE Bottles Market Value (US$ Mn) and Y-O-Y (%) Growth, by Chemicals Sub-segments
Figure 180: GCC Countries HDPE Bottles Market Absolute $ Opportunity, 2021(A) – 2028(F)
Figure 181: South Africa HDPE Bottles Market Absolute $ Opportunity, 2021(A) – 2028(F)
Figure 182: Northern Africa HDPE Bottles Market Absolute $ Opportunity, 2021(A) – 2028(F)
Figure 183: Turkey HDPE Bottles Market Absolute $ Opportunity, 2021(A) – 2028(F)
Figure 184: Rest of MEA HDPE Bottles Market Absolute $ Opportunity, 2021(A) – 2028(F)
Figure 185: MEA HDPE Bottles Market BPS Analysis, by Country, 2013(H), 2022(E) & 2028(F)
Figure 186: MEA HDPE Bottles Market Y-o-Y growth, by Country, 2014(H) – 2028(F)
Figure 187: MEA HDPE Bottles Market Attractiveness Index, by Country, 2022(E) – 2028(F)
Figure 188: MEA HDPE Bottles Market BPS Analysis, by Bottle Capacity, 2013(H), 2022(E) & 2028(F)
Figure 189: MEA HDPE Bottles Market Y-o-Y growth, by Bottle Capacity, 2014(H) – 2028(F)
Figure 190: MEA HDPE Bottles Market Attractiveness Index, by Bottle Capacity, 2022(E) – 2028(F)
Figure 191: MEA HDPE Bottles Market BPS Analysis, by Cap Type, 2013(H), 2022(E) & 2028(F)
Figure 192: MEA HDPE Bottles Market Y-o-Y growth, by Cap Type, 2014(H) – 2028(F)
Figure 193: MEA HDPE Bottles Market Attractiveness Index, by Cap Type, 2022(E) – 2028(F)
Figure 194: MEA HDPE Bottles Market BPS Analysis, by Visibility, 2013(H), 2022(E) & 2028(F)
Figure 195: MEA HDPE Bottles Market Y-o-Y growth, by Visibility, 2014(H) – 2028(F)
Figure 196: MEA HDPE Bottles Market Attractiveness Index, by Visibility, 2022(E) – 2028(F)
Figure 197: MEA HDPE Bottles Market BPS Analysis, by Neck Type, 2013(H), 2022(E) & 2028(F)
Figure 198: MEA HDPE Bottles Market Y-o-Y growth, by Neck Type, 2014(H) – 2028(F)
Figure 199: MEA HDPE Bottles Market Attractiveness Index, by Neck Type, 2022(E) – 2028(F)
Figure 200: MEA HDPE Bottles Market BPS Analysis, by Barrier Type, 2013(H), 2022(E) & 2028(F)
Figure 201: MEA HDPE Bottles Market Y-o-Y growth, by Barrier Type, 2014(H) – 2028(F)
Figure 202: MEA HDPE Bottles Market Attractiveness Index, by Barrier Type, 2022(E) – 2028(F)
Figure 203: MEA HDPE Bottles Market Value (US$ Mn) and Y-O-Y (%) Growth, by High Barrier Sub-segments
Figure 204: MEA HDPE Bottles Market Attractiveness Index, by High Barrier Sub-segments, 2022(E) – 2028(F)
Figure 205: MEA HDPE Bottles Market BPS Analysis, by End-user Industry, 2013(H), 2022(E) & 2028(F)
Figure 206: MEA HDPE Bottles Market Y-o-Y growth, by End-user Industry, 2014(H) – 2028(F)
Figure 207: MEA HDPE Bottles Market Attractiveness Index, by End-user Industry, 2022(E) – 2028(F)
Figure 208: MEA HDPE Bottles Market Value (US$ Mn) and Y-O-Y (%) Growth, by Food & Beverages Sub-segments
Figure 209: MEA HDPE Bottles Market Value (US$ Mn) and Y-O-Y (%) Growth, by Chemicals Sub-segments
Figure 210: Japan HDPE Bottles Market BPS Analysis, by Bottle Capacity, 2013(H), 2022(E) & 2028(F)
Figure 211: Japan HDPE Bottles Market Y-o-Y growth, by Bottle Capacity, 2014(H) – 2028(F)
Figure 212: Japan HDPE Bottles Market Attractiveness Index, by Bottle Capacity, 2022(E) – 2028(F)
Figure 213: Japan HDPE Bottles Market BPS Analysis, by Cap Type, 2013(H), 2022(E) & 2028(F)
Figure 214: Japan HDPE Bottles Market Y-o-Y growth, by Cap Type, 2014(H) – 2028(F)
Figure 215: Japan HDPE Bottles Market Attractiveness Index, by Cap Type, 2022(E) – 2028(F)
Figure 216: Japan HDPE Bottles Market BPS Analysis, by Visibility, 2013(H), 2022(E) & 2028(F)
Figure 217: Japan HDPE Bottles Market Y-o-Y growth, by Visibility, 2014(H) – 2028(F)
Figure 218: Japan HDPE Bottles Market Attractiveness Index, by Visibility, 2022(E) – 2028(F)
Figure 219: Japan HDPE Bottles Market BPS Analysis, by Neck Type, 2013(H), 2022(E) & 2028(F)
Figure 220: Japan HDPE Bottles Market Y-o-Y growth, by Neck Type, 2014(H) – 2028(F)
Figure 221: Japan HDPE Bottles Market Attractiveness Index, by Neck Type, 2022(E) – 2028(F)
Figure 222: Japan HDPE Bottles Market BPS Analysis, by Barrier Type, 2013(H), 2022(E) & 2028(F)
Figure 223: Japan HDPE Bottles Market Y-o-Y growth, by Barrier Type, 2014(H) – 2028(F)
Figure 224: Japan HDPE Bottles Market Attractiveness Index, by Barrier Type, 2022(E) – 2028(F)
Figure 225: Japan HDPE Bottles Market Value (US$ Mn) and Y-O-Y (%) Growth, by High Barrier Sub-segments
Figure 226: Japan HDPE Bottles Market Attractiveness Index, by High Barrier Sub-segments, 2022(E) – 2028(F)
Figure 227: Japan HDPE Bottles Market BPS Analysis, by End-user Industry, 2013(H), 2022(E) & 2028(F)
Figure 228: Japan HDPE Bottles Market Y-o-Y growth, by End-user Industry, 2014(H) – 2028(F)
Figure 229: Japan HDPE Bottles Market Attractiveness Index, by End-user Industry, 2022(E) – 2028(F)
Figure 230: Japan HDPE Bottles Market Value (US$ Mn) and Y-O-Y (%) Growth, by Food & Beverages Sub-segments
Figure 231: Japan HDPE Bottles Market Value (US$ Mn) and Y-O-Y (%) Growth, by Chemicals Sub-segments
Need specific information?
Request CustomizationExplore Packaging Insights
View Reports