High Performance Barrier Films Market Size and Share Forecast Outlook 2025 to 2035

The high performance barrier films market is valued at USD 14.4 billion in 2025 and is slated to reach USD 29.4 billion by 2035, reflecting a CAGR of 7.4%. Growth has been driven by rising demand for moisture, gas, and UV protection packaging across food, pharmaceutical, and electronic applications. High-barrier films have been adopted for their durability, lightweight properties, and ability to enhance product shelf life, making them relevant for industries aiming to improve packaging efficiency and sustainability.
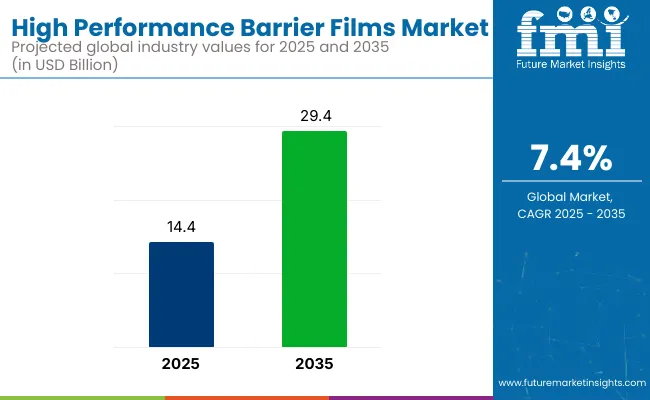
Quick Stats - High Performance Barrier Films Market

  • Market Value (2025): USD 14.4 billion
  • Forecast Value (2035): USD 29.4 billion
  • Forecast CAGR: 7.4%
  • Material Leader in 2025: Polyethylene (31.0% market share)
  • Top End-Use Segment: Food & Beverage (42.5% market share)
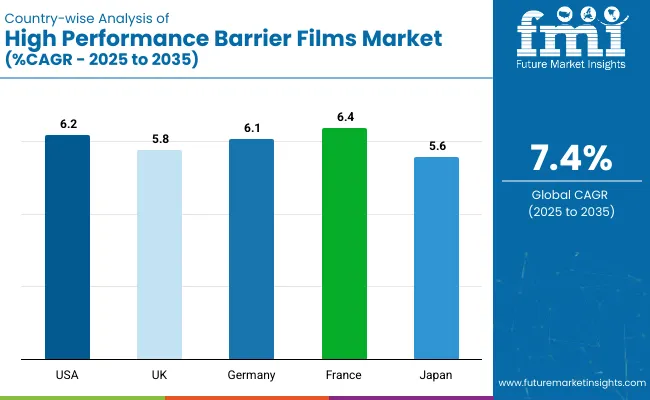
  • Key Growth Region: Europe (France is the fastest-growing market with 6.4% CAGR)

High Performance Barrier Films Market

In 2025, polyethylene (PE) has been expected to account for the highest share of material use due to its strength and processability, while polypropylene (PP) is likely to follow. The food & beverage segment has remained the largest end-use segment, contributing approximately 42.5% of total market revenue. France is projected to witness the fastest growth with a CAGR of 6.4% driven by electronics packaging demand and sustainable packaging initiatives.

Technological advancements have been shaping the market with innovations in nano-engineered coatings, biodegradable barrier films, and AI-powered defect detection. Development of smart packaging solutions incorporating sensors for temperature, freshness, and humidity monitoring has been expanding product applications. Companies have been investing in AI-enabled supply chain optimization to minimize wastage and enhance production efficiency.

Sustainability has been a critical focus area with manufacturers adopting biodegradable materials such as PLA and cellulose coatings to reduce environmental impact. Regulations to eliminate single-use plastics have driven investment in recyclable and compostable barrier films, with multilayer eco-friendly designs being commercialized for food and pharma packaging.

Additional factors contributing to market growth include increasing application in flexible electronics, OLED displays, and battery protection films in electric vehicles. The integration of antimicrobial coatings and tamper-proof features has been enhancing product value propositions, encouraging further penetration across industrial applications.

Moreover, collaborative research and development programs with academic institutions and material science laboratories have been fostering innovations in ultra-thin barrier films, high-transparency coatings, and compostable multilayer structures to cater to the evolving needs of global end users.

Analyzing High Performance Barrier Films Market by Top Investment Segments

The market is segmented into material, type, end use, and region. By material, the market is divided into polyethylene (PE), polypropylene (PP), polyethylene terephthalate (PET), polystyrene (PS), polyvinyl chloride (PVC), and polylactic acid (PLA). Based on type, the market is categorized into bags & pouches, stand-up pouches (retort and non-retort), tray lidding films, forming webs, wrapping films, and blister pack base webs.

In terms of end use, the market is segmented into food & beverage, pharmaceuticals, electronics, construction, agriculture & allied industries, and others. Regionally, the market is classified into North America, Latin America, East Asia, South Asia Pacific, Western Europe, Eastern Europe, and Middle East & Africa.

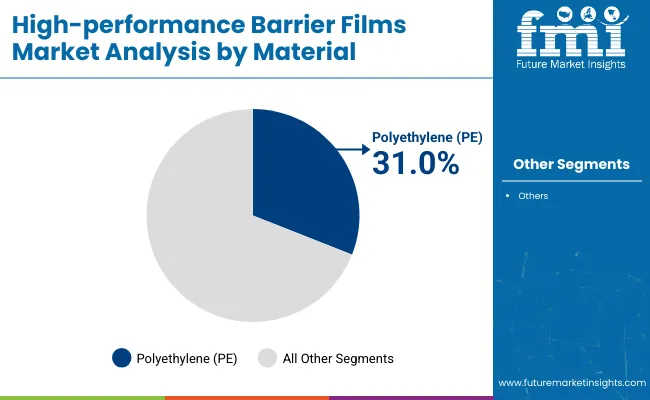
Polyethylene (PE) to Lead the Material Segment with 31.0% Market Share

Polyethylene (PE) is projected to lead the material segment, accounting for 31.0% of the global market share by 2025. Its usage has been driven by favorable properties such as lightweight, durability, and cost-efficiency.
  • PE films have been used extensively for food and pharmaceutical packaging.
  • Enhanced barrier properties with multilayer PE films have been improving shelf life.
  • Compatibility with recycling streams has supported sustainability initiatives.

High Performance Barrier Films Market Analysis By Material

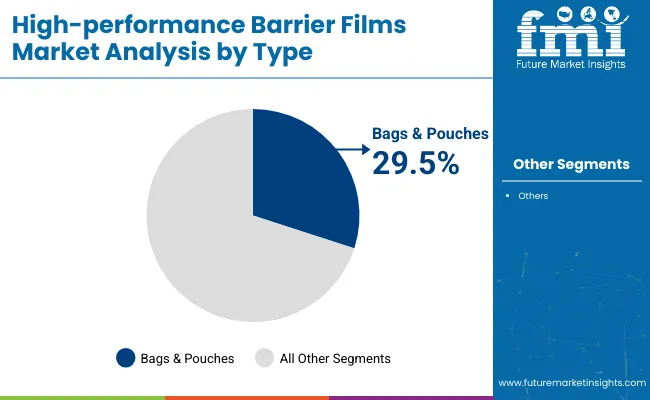
Bags & Pouches to Lead the Type Segment with 29.5% Market Share

Bags & pouches are expected to lead the type segment, securing 29.5% of the global market share by 2025. Growth has been driven by demand for flexible, high-barrier packaging.
  • These formats have been preferred for vacuum sealing and MAP applications.
  • Lightweight and storage-efficient design has enhanced logistical efficiency.
  • Widespread use across food, beverage, and medical packaging sectors has been observed.

High Performance Barrier Films Market Analysis By Type

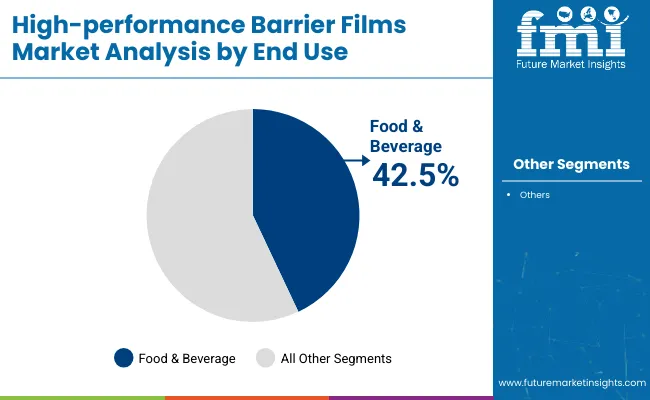
Food & Beverage to Lead the End Use Segment with 42.5% Market Share

The food & beverage segment is projected to lead the end-use category, capturing 42.5% of the global market share in 2025. Adoption has been driven by the need for extended shelf life and food safety compliance.
  • Barrier films have been adopted for their moisture, oxygen, and UV resistance.
  • Increasing packaged food consumption has contributed to market expansion.
  • Growth has been supported by eco-friendly packaging innovations.

High Performance Barrier Films Market Analysis By End Use

Top High Performance Barrier Films Market Dynamics

The high-performance barrier films market is experiencing steady growth, driven by increasing demand for moisture, oxygen, and UV-resistant packaging, sustainable material innovations, and continuous advancements in nano-coating and multilayer production technologies.

Recent Trends in the High Performance Barrier Films Market
  • The adoption of recyclable and biodegradable barrier materials is gaining acceleration across food, pharma, and electronics industries.
  • Smart packaging features such as RFID tracking, freshness sensors, and antimicrobial layers have been increasingly integrated.
  • Automation in barrier film production lines has been expanded to improve coating precision and defect detection through AI systems.

Challenges in the High Performance Barrier Films Market

  • Price volatility in raw materials such as polyethylene, polypropylene, and specialty bio-based polymers has been continuously observed.
  • Regulatory pressure for recyclable, compostable, and low-carbon packaging compliance has been intensifying globally.
  • High production costs associated with multilayer and nanocomposite barrier films have been limiting adoption among small and mid-sized manufacturers.

Analyzing Top Countries Exporting, Distributing, and Supplying High Performance Barrier Films

Country Wise Analysis Of High Performance Barrier Films Market

USA High Performance Barrier Films Market Analysis

The high performance barrier films revenue in the USA is expected to grow at a CAGR of 6.2% from 2025 to 2035. This growth has been supported by stringent FDA and EPA regulations, demand for food-safe and pharma-compliant packaging, and innovations in nano-coated and active barrier film technologies for consumer goods and industrial applications.

  • Strong demand from food, beverage, and pharma packaging.
  • Investments in recyclable multilayer and compostable film innovations.
  • Technological advancements in nanocoatings and antimicrobial barriers.
  • Supportive policies for sustainable packaging and circular economy goals.

High Performance Barrier Film Sales Analysis in the UK

The UK high performance barrier films market is projected to expand at a CAGR of 5.8% during the forecast period. Regulatory pressure to reduce single-use plastics, along with growing adoption of bio-based and recyclable packaging materials in retail, food, and healthcare applications, has been boosting demand for barrier films.

  • Retail packaging demand is driven by sustainability regulations.
  • Adoption of bio-based and recyclable film solutions is increasing.
  • Growth in pharmaceutical and consumer goods applications.
  • Investments in smart packaging and digital supply chain tracking.

Germany High Performance Barrier Films Market Analysis

High performance barrier film sales in Germany are forecasted to grow at a CAGR of 6.1% from 2025 to 2035. Growth has been driven by strong demand for recyclable and multilayer films in food packaging, automotive, and industrial applications, coupled with strict EU environmental compliance regulations.

  • High adoption of multilayer barrier films in food and beverage packaging.
  • EU directives are strengthening recyclable and compostable packaging use.
  • Advanced nanocoating technologies are being integrated into film production.
  • Investments are focused on improving film strength and reducing carbon footprint.

High Performance Barrier Films Demand Analysis in France

The France high performance barrier films market is projected to grow at a CAGR of 6.4% from 2025 to 2035. Growth has been supported by increasing demand for sustainable packaging in food, cosmetics, and pharma sectors, along with emphasis on eco-certifications and bio-based material innovations.

  • Demand is rising for eco-certified barrier films in food packaging.
  • Growth in pharmaceutical packaging requiring high oxygen and moisture barriers.
  • Investments in biodegradable and compostable film solutions are increasing.
  • Government policies are encouraging sustainable and low-carbon packaging materials.

Japan High Performance Barrier Films Market Analysis

High performance barrier film demand in Japan is forecasted to grow at a CAGR of 5.6% from 2025 to 2035. The market growth has been supported by demand for precision-engineered films in electronics, pharmaceuticals, and food packaging, alongside advancements in ultra-thin, breathable, and antimicrobial film technologies.

  • High reliance on high-barrier films in electronics and medical packaging.
  • Smart packaging integration with temperature and freshness sensors.
  • Growing adoption of recyclable and compostable film solutions.
  • Government emphasis on low-carbon packaging and sustainable exports.

Leading High Performance Barrier Films Suppliers and Distributors

The high performance barrier films market is moderately consolidated, with several global leaders holding significant shares while regional and niche players continue to innovate. Competitive dynamics have been shaped by pricing strategies, technological advancements in nano-engineered and biodegradable films, strategic manufacturing expansions, and mergers or partnerships to strengthen production capabilities and market reach.

Tier-one firms, such as Amcor, Berry Global, Sealed Air Corporation, Toppan Printing, and Uflex Ltd., are competing through large-scale investments in sustainable packaging materials, advanced multilayer technologies, and AI-based defect detection systems. These firms have been forming partnerships with FMCG, electronics, and pharma companies to ensure long-term supply agreements.

Recent High Performance Barrier Films Industry News

  • In May 2025, Amcor and Metsä Group announced a strategic partnership to develop a recyclable, moulded fibre-based food packaging solution. This collaboration combines Metsä's Muoto™, a wood-based moulded fibre product, with Amcor's high-barrier film liner and lidding technology. The resulting packaging aims to meet growing industry and consumer demands for more sustainable alternatives to plastic, while maintaining high performance in food protection and shelf-life extension.
  • In May 2025, Sealed Air Corporation entered a strategic partnership with Qosina, a global distributor of single-use medical and biopharmaceutical components. This collaboration introduces NEXCEL® BIO1250, a robust, ultra-low temperature-compatible bag chamber film engineered for purity, durability, and oxygen barrier protection. The partnership aims to advance single-use solutions for bioprocessing innovators.

High Performance Barrier Films Market Report Scope

Report Attributes Details
Current Total Market Size (2025) USD 14.4 billion
Projected Market Size (2035) USD 29.4 billion
CAGR (2025 to 2035) 7.4%
Base Year for Estimation 2024
Historical Period 2020 to 2024
Projections Period 2025 to 2035
Market Analysis Parameters Revenue in USD billions / Volume in metric tons
By Material Polyethylene (PE), Polypropylene (PP), Polyethylene Terephthalate (PET), Polystyrene (PS), Polyvinyl Chloride (PVC), Polylactic Acid (PLA)
By Type Bags & Pouches, Stand-up Pouches (Retort, Non-Retort), Tray Lidding Films, Forming Webs, Wrapping Films, Blister Pack Base Webs
By End Use Food & Beverage, Pharmaceuticals, Electronics, Construction, Agriculture & Allied Industries, Others
Regions Covered North America, Latin America, Western Europe, Eastern Europe, East Asia, South Asia Pacific, Middle East and Africa
Countries Covered United States, United Kingdom, Germany, France, Japan, South Korea, China, Brazil, Australia
Key Players Amcor, Berry Global, Sealed Air Corporation, Toppan Printing, Uflex Ltd., Toray Industries, Treofan Group, Huhtamaki Oyj, Winpak Ltd., Mitsubishi Chemical Holdings
Additional Attributes Dollar sales by value, market share analysis by material and region, country-wise analysis

Segmentation

By Material:

  • Polyethylene (PE)
  • Polypropylene (PP)
  • Polyethylene Terephthalate (PET)
  • Polystyrene (PS)
  • Polyvinyl Chloride (PVC)
  • Polylactic Acid

By Type:

  • Bags & Pouches
  • Stand-up Pouches
    • Retort
    • Non-Retort
  • Tray Lidding Films
  • Forming Webs
  • Wrapping Films
  • Blister Pack Base Webs

By End Use:

  • Food & Beverage
  • Pharmaceuticals
  • Electronics
  • Construction
  • Agriculture & Allied Industries
  • Others

By Region:

  • North America
  • Latin America
  • East Asia
  • South Asia & Pacific
  • Eastern Europe
  • Western Europe
  • Middle East & Africa

Table of Content

  1. Executive Summary
    • Global Market Outlook
    • Demand-side Trends
    • Supply-side Trends
    • Technology Roadmap Analysis
    • Analysis and Recommendations
  2. Market Overview
    • Market Coverage / Taxonomy
    • Market Definition / Scope / Limitations
  3. Market Background
    • Market Dynamics
      • Drivers
      • Restraints
      • Opportunity
      • Trends
    • Scenario Forecast
      • Demand in Optimistic Scenario
      • Demand in Likely Scenario
      • Demand in Conservative Scenario
    • Opportunity Map Analysis
    • Product Life Cycle Analysis
    • Supply Chain Analysis
      • Supply Side Participants and their Roles
        • Producers
        • Mid-Level Participants (Traders/ Agents/ Brokers)
        • Wholesalers and Distributors
      • Value Added and Value Created at Node in the Supply Chain
      • List of Raw Material Suppliers
      • List of Existing and Potential Buyer’s
    • Investment Feasibility Matrix
    • Value Chain Analysis
      • Profit Margin Analysis
      • Wholesalers and Distributors
      • Retailers
    • PESTLE and Porter’s Analysis
    • Regulatory Landscape
      • By Key Regions
      • By Key Countries
    • Regional Parent Market Outlook
    • Production and Consumption Statistics
    • Import and Export Statistics
  4. Global Market Analysis 2020 to 2024 and Forecast, 2025 to 2035
    • Historical Market Size Value USD Billion) & Volume (Metric Tons) Analysis, 2020 to 2024
    • Current and Future Market Size Value USD Billion) & Volume (Metric Tons) Projections, 2025 to 2035
      • Y-o-Y Growth Trend Analysis
      • Absolute $ Opportunity Analysis
  5. Global Market Pricing Analysis 2020 to 2024 and Forecast 2025 to 2035
  6. Global Market Analysis 2020 to 2024 and Forecast 2025 to 2035, By Material
    • Introduction / Key Findings
    • Historical Market Size Value USD Billion) & Volume (Metric Tons) Analysis By Material, 2020 to 2024
    • Current and Future Market Size Value USD Billion) & Volume (Metric Tons) Analysis and Forecast By Material, 2025 to 2035
      • Polyethylene (PE)
      • Polypropylene (PP)
      • Polyethylene Terephthalate (PET)
      • Polystyrene (PS)
      • Polyvinyl Chloride (PVC)
      • Polylactic Acid
    • Y-o-Y Growth Trend Analysis By Material, 2020 to 2024
    • Absolute $ Opportunity Analysis By Material, 2025 to 2035
  7. Global Market Analysis 2020 to 2024 and Forecast 2025 to 2035, By Type
    • Introduction / Key Findings
    • Historical Market Size Value USD Billion) & Volume (Metric Tons) Analysis By Type, 2020 to 2024
    • Current and Future Market Size Value USD Billion) & Volume (Metric Tons) Analysis and Forecast By Type, 2025 to 2035
      • Bags & Pouches
      • Stand-up Pouches
        • Retort
        • Non-Retort
      • Tray Lidding Films
      • Forming Webs
      • Wrapping Films
      • Blister Pack Base Webs
    • Y-o-Y Growth Trend Analysis By Type, 2020 to 2024
    • Absolute $ Opportunity Analysis By Type, 2025 to 2035
  8. Global Market Analysis 2020 to 2024 and Forecast 2025 to 2035, By End Use
    • Introduction / Key Findings
    • Historical Market Size Value USD Billion) & Volume (Metric Tons) Analysis By End Use, 2020 to 2024
    • Current and Future Market Size Value USD Billion) & Volume (Metric Tons) Analysis and Forecast By End Use, 2025 to 2035
      • Food & Beverage
      • Pharmaceuticals
      • Electronics
      • Construction
      • Agriculture & Allied Industries
      • Others
    • Y-o-Y Growth Trend Analysis By End Use, 2020 to 2024
    • Absolute $ Opportunity Analysis By End Use, 2025 to 2035
  9. Global Market Analysis 2020 to 2024 and Forecast 2025 to 2035, By Region
    • Introduction
    • Historical Market Size Value USD Billion) & Volume (Metric Tons) Analysis By Region, 2020 to 2024
    • Current Market Size Value USD Billion) & Volume (Metric Tons) Analysis and Forecast By Region, 2025 to 2035
      • North America
      • Latin America
      • Western Europe
      • Eastern Europe
      • East Asia
      • South Asia & Pacific
      • Middle East and Africa
    • Market Attractiveness Analysis By Region
  10. North America Market Analysis 2020 to 2024 and Forecast 2025 to 2035, By Country
    • Historical Market Size Value USD Billion) & Volume (Metric Tons) Trend Analysis By Market Taxonomy, 2020 to 2024
    • Market Size Value USD Billion) & Volume (Metric Tons) Forecast By Market Taxonomy, 2025 to 2035
      • By Country
        • USA
        • Canada
        • Mexico
      • By Material
      • By Type
      • By End Use
    • Market Attractiveness Analysis
      • By Country
      • By Material
      • By Type
      • By End Use
    • Key Takeaways
  11. Latin America Market Analysis 2020 to 2024 and Forecast 2025 to 2035, By Country
    • Historical Market Size Value USD Billion) & Volume (Metric Tons) Trend Analysis By Market Taxonomy, 2020 to 2024
    • Market Size Value USD Billion) & Volume (Metric Tons) Forecast By Market Taxonomy, 2025 to 2035
      • By Country
        • Brazil
        • Argentina
        • Rest of LATAM
      • By Material
      • By Type
      • By End Use
    • Market Attractiveness Analysis
      • By Country
      • By Material
      • By Type
      • By End Use
    • Key Takeaways
  12. Western Europe Market Analysis 2020 to 2024 and Forecast 2025 to 2035, By Country
    • Historical Market Size Value USD Billion) & Volume (Metric Tons) Trend Analysis By Market Taxonomy, 2020 to 2024
    • Market Size Value USD Billion) & Volume (Metric Tons) Forecast By Market Taxonomy, 2025 to 2035
      • By Country
        • Germany
        • Italy
        • France
        • UK
        • Spain
        • BENELUX
        • Nordic
        • Rest of W.Europe
      • By Material
      • By Type
      • By End Use
    • Market Attractiveness Analysis
      • By Country
      • By Material
      • By Type
      • By End Use
    • Key Takeaways
  13. Eastern Europe Market Analysis 2020 to 2024 and Forecast 2025 to 2035, By Country
    • Historical Market Size Value USD Billion) & Volume (Metric Tons) Trend Analysis By Market Taxonomy, 2020 to 2024
    • Market Size Value USD Billion) & Volume (Metric Tons) Forecast By Market Taxonomy, 2025 to 2035
      • By Country
        • Russia
        • Hungary
        • Poland
        • Balkan & Baltics
        • Rest of E. Europe
      • By Material
      • By Type
      • By End Use
    • Market Attractiveness Analysis
      • By Country
      • By Material
      • By Type
      • By End Use
    • Key Takeaways
  14. East Asia Market Analysis 2020 to 2024 and Forecast 2025 to 2035, By Country
    • Historical Market Size Value USD Billion) & Volume (Metric Tons) Trend Analysis By Market Taxonomy, 2020 to 2024
    • Market Size Value USD Billion) & Volume (Metric Tons) Forecast By Market Taxonomy, 2025 to 2035
      • By Country
        • China
        • Japan
        • South Korea
      • By Material
      • By Type
      • By End Use
    • Market Attractiveness Analysis
      • By Country
      • By Material
      • By Type
      • By End Use
    • Key Takeaways
  15. South Asia & Pacific Market Analysis 2020 to 2024 and Forecast 2025 to 2035, By Country
    • Historical Market Size Value USD Billion) & Volume (Metric Tons) Trend Analysis By Market Taxonomy, 2020 to 2024
    • Market Size Value USD Billion) & Volume (Metric Tons) Forecast By Market Taxonomy, 2025 to 2035
      • By Country
        • India
        • Australia & New Zealand
        • ASEAN
        • Rest of SAP
      • By Material
      • By Type
      • By End Use
    • Market Attractiveness Analysis
      • By Country
      • By Material
      • By Type
      • By End Use
    • Key Takeaways
  16. Middle East and Africa Market Analysis 2020 to 2024 and Forecast 2025 to 2035, By Country
    • Historical Market Size Value USD Billion) & Volume (Metric Tons) Trend Analysis By Market Taxonomy, 2020 to 2024
    • Market Size Value USD Billion) & Volume (Metric Tons) Forecast By Market Taxonomy, 2025 to 2035
      • By Country
        • GCC Countries
        • Northern Africa
        • South Africa
        • Turkiye
        • Rest of MEA
      • By Material
      • By Type
      • By End Use
    • Market Attractiveness Analysis
      • By Country
      • By Material
      • By Type
      • By End Use
    • Key Takeaways
  17. Key Countries Market Analysis
    • USA
      • Pricing Analysis
      • Market Share Analysis, 2024
        • By Material
        • By Type
        • By End Use
    • Canada
      • Pricing Analysis
      • Market Share Analysis, 2024
        • By Material
        • By Type
        • By End Use
    • Brazil
      • Pricing Analysis
      • Market Share Analysis, 2024
        • By Material
        • By Type
        • By End Use
    • Mexico
      • Pricing Analysis
      • Market Share Analysis, 2024
        • By Material
        • By Type
        • By End Use
    • Argentina
      • Pricing Analysis
      • Market Share Analysis, 2024
        • By Material
        • By Type
        • By End Use
  18. Market Structure Analysis
    • Competition Dashboard
    • Competition Benchmarking
    • Market Share Analysis of Top Players
      • By Regional
      • By Material
      • By Type
      • By End Use
  19. Competition Analysis
    • Competition Deep Dive
      • Amcor
        • Overview
        • Product Portfolio
        • Profitability by Market Segments (Product/Age /Sales Channel/Region)
        • Sales Footprint
        • Strategy Overview
          • Marketing Strategy
          • Product Strategy
          • Channel Strategy
      • Berry Global
        • Overview
        • Product Portfolio
        • Profitability by Market Segments (Product/Age /Sales Channel/Region)
        • Sales Footprint
        • Strategy Overview
          • Marketing Strategy
          • Product Strategy
          • Channel Strategy
      • Sealed Air Corp.
        • Overview
        • Product Portfolio
        • Profitability by Market Segments (Product/Age /Sales Channel/Region)
        • Sales Footprint
        • Strategy Overview
          • Marketing Strategy
          • Product Strategy
          • Channel Strategy
      • Toppan Printing
        • Overview
        • Product Portfolio
        • Profitability by Market Segments (Product/Age /Sales Channel/Region)
        • Sales Footprint
        • Strategy Overview
          • Marketing Strategy
          • Product Strategy
          • Channel Strategy
      • Uflex Ltd.
        • Overview
        • Product Portfolio
        • Profitability by Market Segments (Product/Age /Sales Channel/Region)
        • Sales Footprint
        • Strategy Overview
          • Marketing Strategy
          • Product Strategy
          • Channel Strategy
      • Toray Industries, Inc.
        • Overview
        • Product Portfolio
        • Profitability by Market Segments (Product/Age /Sales Channel/Region)
        • Sales Footprint
        • Strategy Overview
          • Marketing Strategy
          • Product Strategy
          • Channel Strategy
      • Treofan Group
        • Overview
        • Product Portfolio
        • Profitability by Market Segments (Product/Age /Sales Channel/Region)
        • Sales Footprint
        • Strategy Overview
          • Marketing Strategy
          • Product Strategy
          • Channel Strategy
      • Huhtamaki Oyj
        • Overview
        • Product Portfolio
        • Profitability by Market Segments (Product/Age /Sales Channel/Region)
        • Sales Footprint
        • Strategy Overview
          • Marketing Strategy
          • Product Strategy
          • Channel Strategy
      • Winpak Ltd.
        • Overview
        • Product Portfolio
        • Profitability by Market Segments (Product/Age /Sales Channel/Region)
        • Sales Footprint
        • Strategy Overview
          • Marketing Strategy
          • Product Strategy
          • Channel Strategy
      • Mitsubishi Chemical Holdings Corporation
        • Overview
        • Product Portfolio
        • Profitability by Market Segments (Product/Age /Sales Channel/Region)
        • Sales Footprint
        • Strategy Overview
          • Marketing Strategy
          • Product Strategy
          • Channel Strategy
  20. Assumptions & Acronyms Used
  21. Research Methodology

List of Tables

  • Table 1: Global Market Value (USD Billion) Forecast by Region, 2020 to 2035
  • Table 2: Global Market Volume (Metric Tons) Forecast by Region, 2020 to 2035
  • Table 3: Global Market Value (USD Billion) Forecast by Material, 2020 to 2035
  • Table 4: Global Market Volume (Metric Tons) Forecast by Material, 2020 to 2035
  • Table 5: Global Market Value (USD Billion) Forecast by Type, 2020 to 2035
  • Table 6: Global Market Volume (Metric Tons) Forecast by Type, 2020 to 2035
  • Table 7: Global Market Value (USD Billion) Forecast by End Use, 2020 to 2035
  • Table 8: Global Market Volume (Metric Tons) Forecast by End Use, 2020 to 2035
  • Table 9: North America Market Value (USD Billion) Forecast by Country, 2020 to 2035
  • Table 10: North America Market Volume (Metric Tons) Forecast by Country, 2020 to 2035
  • Table 11: North America Market Value (USD Billion) Forecast by Material, 2020 to 2035
  • Table 12: North America Market Volume (Metric Tons) Forecast by Material, 2020 to 2035
  • Table 13: North America Market Value (USD Billion) Forecast by Type, 2020 to 2035
  • Table 14: North America Market Volume (Metric Tons) Forecast by Type, 2020 to 2035
  • Table 15: North America Market Value (USD Billion) Forecast by End Use, 2020 to 2035
  • Table 16: North America Market Volume (Metric Tons) Forecast by End Use, 2020 to 2035
  • Table 17: Latin America Market Value (USD Billion) Forecast by Country, 2020 to 2035
  • Table 18: Latin America Market Volume (Metric Tons) Forecast by Country, 2020 to 2035
  • Table 19: Latin America Market Value (USD Billion) Forecast by Material, 2020 to 2035
  • Table 20: Latin America Market Volume (Metric Tons) Forecast by Material, 2020 to 2035
  • Table 21: Latin America Market Value (USD Billion) Forecast by Type, 2020 to 2035
  • Table 22: Latin America Market Volume (Metric Tons) Forecast by Type, 2020 to 2035
  • Table 23: Latin America Market Value (USD Billion) Forecast by End Use, 2020 to 2035
  • Table 24: Latin America Market Volume (Metric Tons) Forecast by End Use, 2020 to 2035
  • Table 25: Western Europe Market Value (USD Billion) Forecast by Country, 2020 to 2035
  • Table 26: Western Europe Market Volume (Metric Tons) Forecast by Country, 2020 to 2035
  • Table 27: Western Europe Market Value (USD Billion) Forecast by Material, 2020 to 2035
  • Table 28: Western Europe Market Volume (Metric Tons) Forecast by Material, 2020 to 2035
  • Table 29: Western Europe Market Value (USD Billion) Forecast by Type, 2020 to 2035
  • Table 30: Western Europe Market Volume (Metric Tons) Forecast by Type, 2020 to 2035
  • Table 31: Western Europe Market Value (USD Billion) Forecast by End Use, 2020 to 2035
  • Table 32: Western Europe Market Volume (Metric Tons) Forecast by End Use, 2020 to 2035
  • Table 33: Eastern Europe Market Value (USD Billion) Forecast by Country, 2020 to 2035
  • Table 34: Eastern Europe Market Volume (Metric Tons) Forecast by Country, 2020 to 2035
  • Table 35: Eastern Europe Market Value (USD Billion) Forecast by Material, 2020 to 2035
  • Table 36: Eastern Europe Market Volume (Metric Tons) Forecast by Material, 2020 to 2035
  • Table 37: Eastern Europe Market Value (USD Billion) Forecast by Type, 2020 to 2035
  • Table 38: Eastern Europe Market Volume (Metric Tons) Forecast by Type, 2020 to 2035
  • Table 39: Eastern Europe Market Value (USD Billion) Forecast by End Use, 2020 to 2035
  • Table 40: Eastern Europe Market Volume (Metric Tons) Forecast by End Use, 2020 to 2035
  • Table 41: East Asia Market Value (USD Billion) Forecast by Country, 2020 to 2035
  • Table 42: East Asia Market Volume (Metric Tons) Forecast by Country, 2020 to 2035
  • Table 43: East Asia Market Value (USD Billion) Forecast by Material, 2020 to 2035
  • Table 44: East Asia Market Volume (Metric Tons) Forecast by Material, 2020 to 2035
  • Table 45: East Asia Market Value (USD Billion) Forecast by Type, 2020 to 2035
  • Table 46: East Asia Market Volume (Metric Tons) Forecast by Type, 2020 to 2035
  • Table 47: East Asia Market Value (USD Billion) Forecast by End Use, 2020 to 2035
  • Table 48: East Asia Market Volume (Metric Tons) Forecast by End Use, 2020 to 2035
  • Table 49: South Asia & Pacific Market Value (USD Billion) Forecast by Country, 2020 to 2035
  • Table 50: South Asia & Pacific Market Volume (Metric Tons) Forecast by Country, 2020 to 2035
  • Table 51: South Asia & Pacific Market Value (USD Billion) Forecast by Material, 2020 to 2035
  • Table 52: South Asia & Pacific Market Volume (Metric Tons) Forecast by Material, 2020 to 2035
  • Table 53: South Asia & Pacific Market Value (USD Billion) Forecast by Type, 2020 to 2035
  • Table 54: South Asia & Pacific Market Volume (Metric Tons) Forecast by Type, 2020 to 2035
  • Table 55: South Asia & Pacific Market Value (USD Billion) Forecast by End Use, 2020 to 2035
  • Table 56: South Asia & Pacific Market Volume (Metric Tons) Forecast by End Use, 2020 to 2035
  • Table 57: Middle East and Africa Market Value (USD Billion) Forecast by Country, 2020 to 2035
  • Table 58: Middle East and Africa Market Volume (Metric Tons) Forecast by Country, 2020 to 2035
  • Table 59: Middle East and Africa Market Value (USD Billion) Forecast by Material, 2020 to 2035
  • Table 60: Middle East and Africa Market Volume (Metric Tons) Forecast by Material, 2020 to 2035
  • Table 61: Middle East and Africa Market Value (USD Billion) Forecast by Type, 2020 to 2035
  • Table 62: Middle East and Africa Market Volume (Metric Tons) Forecast by Type, 2020 to 2035
  • Table 63: Middle East and Africa Market Value (USD Billion) Forecast by End Use, 2020 to 2035
  • Table 64: Middle East and Africa Market Volume (Metric Tons) Forecast by End Use, 2020 to 2035

List of Figures

  • Figure 1: Global Market Volume (Metric Tons) Forecast 2020 to 2035
  • Figure 2: Global Market Pricing Analysis
  • Figure 3: Global Market Value (USD Billion) Forecast 2020 to 2035
  • Figure 4: Global Market Value Share and BPS Analysis by Material, 2025 and 2035
  • Figure 5: Global Market Y-o-Y Growth Comparison by Material, 2025 to 2035
  • Figure 6: Global Market Attractiveness Analysis by Material
  • Figure 7: Global Market Value Share and BPS Analysis by Type, 2025 and 2035
  • Figure 8: Global Market Y-o-Y Growth Comparison by Type, 2025 to 2035
  • Figure 9: Global Market Attractiveness Analysis by Type
  • Figure 10: Global Market Value Share and BPS Analysis by End Use, 2025 and 2035
  • Figure 11: Global Market Y-o-Y Growth Comparison by End Use, 2025 to 2035
  • Figure 12: Global Market Attractiveness Analysis by End Use
  • Figure 13: Global Market Value (USD Billion) Share and BPS Analysis by Region, 2025 and 2035
  • Figure 14: Global Market Y-o-Y Growth Comparison by Region, 2025 to 2035
  • Figure 15: Global Market Attractiveness Analysis by Region
  • Figure 16: North America Market Incremental $ Opportunity, 2025 to 2035
  • Figure 17: Latin America Market Incremental $ Opportunity, 2025 to 2035
  • Figure 18: Western Europe Market Incremental $ Opportunity, 2025 to 2035
  • Figure 19: Eastern Europe Market Incremental $ Opportunity, 2025 to 2035
  • Figure 20: East Asia Market Incremental $ Opportunity, 2025 to 2035
  • Figure 21: South Asia & Pacific Market Incremental $ Opportunity, 2025 to 2035
  • Figure 22: Middle East and Africa Market Incremental $ Opportunity, 2025 to 2035
  • Figure 23: North America Market Value Share and BPS Analysis by Country, 2025 and 2035
  • Figure 24: North America Market Value Share and BPS Analysis by Material, 2025 and 2035
  • Figure 25: North America Market Y-o-Y Growth Comparison by Material, 2025 to 2035
  • Figure 26: North America Market Attractiveness Analysis by Material
  • Figure 27: North America Market Value Share and BPS Analysis by Type, 2025 and 2035
  • Figure 28: North America Market Y-o-Y Growth Comparison by Type, 2025 to 2035
  • Figure 29: North America Market Attractiveness Analysis by Type
  • Figure 30: North America Market Value Share and BPS Analysis by End Use, 2025 and 2035
  • Figure 31: North America Market Y-o-Y Growth Comparison by End Use, 2025 to 2035
  • Figure 32: North America Market Attractiveness Analysis by End Use
  • Figure 33: Latin America Market Value Share and BPS Analysis by Country, 2025 and 2035
  • Figure 34: Latin America Market Value Share and BPS Analysis by Material, 2025 and 2035
  • Figure 35: Latin America Market Y-o-Y Growth Comparison by Material, 2025 to 2035
  • Figure 36: Latin America Market Attractiveness Analysis by Material
  • Figure 37: Latin America Market Value Share and BPS Analysis by Type, 2025 and 2035
  • Figure 38: Latin America Market Y-o-Y Growth Comparison by Type, 2025 to 2035
  • Figure 39: Latin America Market Attractiveness Analysis by Type
  • Figure 40: Latin America Market Value Share and BPS Analysis by End Use, 2025 and 2035
  • Figure 41: Latin America Market Y-o-Y Growth Comparison by End Use, 2025 to 2035
  • Figure 42: Latin America Market Attractiveness Analysis by End Use
  • Figure 43: Western Europe Market Value Share and BPS Analysis by Country, 2025 and 2035
  • Figure 44: Western Europe Market Value Share and BPS Analysis by Material, 2025 and 2035
  • Figure 45: Western Europe Market Y-o-Y Growth Comparison by Material, 2025 to 2035
  • Figure 46: Western Europe Market Attractiveness Analysis by Material
  • Figure 47: Western Europe Market Value Share and BPS Analysis by Type, 2025 and 2035
  • Figure 48: Western Europe Market Y-o-Y Growth Comparison by Type, 2025 to 2035
  • Figure 49: Western Europe Market Attractiveness Analysis by Type
  • Figure 50: Western Europe Market Value Share and BPS Analysis by End Use, 2025 and 2035
  • Figure 51: Western Europe Market Y-o-Y Growth Comparison by End Use, 2025 to 2035
  • Figure 52: Western Europe Market Attractiveness Analysis by End Use
  • Figure 53: Eastern Europe Market Value Share and BPS Analysis by Country, 2025 and 2035
  • Figure 54: Eastern Europe Market Value Share and BPS Analysis by Material, 2025 and 2035
  • Figure 55: Eastern Europe Market Y-o-Y Growth Comparison by Material, 2025 to 2035
  • Figure 56: Eastern Europe Market Attractiveness Analysis by Material
  • Figure 57: Eastern Europe Market Value Share and BPS Analysis by Type, 2025 and 2035
  • Figure 58: Eastern Europe Market Y-o-Y Growth Comparison by Type, 2025 to 2035
  • Figure 59: Eastern Europe Market Attractiveness Analysis by Type
  • Figure 60: Eastern Europe Market Value Share and BPS Analysis by End Use, 2025 and 2035
  • Figure 61: Eastern Europe Market Y-o-Y Growth Comparison by End Use, 2025 to 2035
  • Figure 62: Eastern Europe Market Attractiveness Analysis by End Use
  • Figure 63: East Asia Market Value Share and BPS Analysis by Country, 2025 and 2035
  • Figure 64: East Asia Market Value Share and BPS Analysis by Material, 2025 and 2035
  • Figure 65: East Asia Market Y-o-Y Growth Comparison by Material, 2025 to 2035
  • Figure 66: East Asia Market Attractiveness Analysis by Material
  • Figure 67: East Asia Market Value Share and BPS Analysis by Type, 2025 and 2035
  • Figure 68: East Asia Market Y-o-Y Growth Comparison by Type, 2025 to 2035
  • Figure 69: East Asia Market Attractiveness Analysis by Type
  • Figure 70: East Asia Market Value Share and BPS Analysis by End Use, 2025 and 2035
  • Figure 71: East Asia Market Y-o-Y Growth Comparison by End Use, 2025 to 2035
  • Figure 72: East Asia Market Attractiveness Analysis by End Use
  • Figure 73: South Asia & Pacific Market Value Share and BPS Analysis by Country, 2025 and 2035
  • Figure 74: South Asia & Pacific Market Value Share and BPS Analysis by Material, 2025 and 2035
  • Figure 75: South Asia & Pacific Market Y-o-Y Growth Comparison by Material, 2025 to 2035
  • Figure 76: South Asia & Pacific Market Attractiveness Analysis by Material
  • Figure 77: South Asia & Pacific Market Value Share and BPS Analysis by Type, 2025 and 2035
  • Figure 78: South Asia & Pacific Market Y-o-Y Growth Comparison by Type, 2025 to 2035
  • Figure 79: South Asia & Pacific Market Attractiveness Analysis by Type
  • Figure 80: South Asia & Pacific Market Value Share and BPS Analysis by End Use, 2025 and 2035
  • Figure 81: South Asia & Pacific Market Y-o-Y Growth Comparison by End Use, 2025 to 2035
  • Figure 82: South Asia & Pacific Market Attractiveness Analysis by End Use
  • Figure 83: Middle East and Africa Market Value Share and BPS Analysis by Country, 2025 and 2035
  • Figure 84: Middle East and Africa Market Value Share and BPS Analysis by Material, 2025 and 2035
  • Figure 85: Middle East and Africa Market Y-o-Y Growth Comparison by Material, 2025 to 2035
  • Figure 86: Middle East and Africa Market Attractiveness Analysis by Material
  • Figure 87: Middle East and Africa Market Value Share and BPS Analysis by Type, 2025 and 2035
  • Figure 88: Middle East and Africa Market Y-o-Y Growth Comparison by Type, 2025 to 2035
  • Figure 89: Middle East and Africa Market Attractiveness Analysis by Type
  • Figure 90: Middle East and Africa Market Value Share and BPS Analysis by End Use, 2025 and 2035
  • Figure 91: Middle East and Africa Market Y-o-Y Growth Comparison by End Use, 2025 to 2035
  • Figure 92: Middle East and Africa Market Attractiveness Analysis by End Use
  • Figure 93: Global Market - Tier Structure Analysis
  • Figure 94: Global Market - Company Share Analysis

Frequently Asked Questions

What is the projected size of high performance barrier films market by 2035?

The market is expected to reach USD 29.4 billion by 2035.

What is the CAGR of the high performance barrier films market from 2025 to 2035?

The global market is projected to grow at a CAGR of 7.4% during this period.

Which material holds the highest share in the high performance barrier films market in 2025?

Polyethylene (PE) is expected to lead with a 31.0% market share in 2025.

What is the projected share of bags & pouches in the type segment of the high performance barrier films market by 2025?

Bags & pouches are expected to hold a 29.5% share of the market in 2025.

Which country is projected to grow fastest in the high performance barrier films market?

France is anticipated to be the fastest-growing market with a CAGR of 6.4% through 2035.

Explore Similar Insights

Future Market Insights

High Performance Barrier Films Market