Reports

- Global Locations -

Headquarters

Future Market Insights, Inc.

Christiana Corporate, 200
Continental Drive, Suite 401,
Newark, Delaware - 19713,
United States

T: +1-845-579-5705

Americas

Future Market Insights, Inc.

616 Corporate Way, Suite 2-9018,
Valley Cottage, NY 10989, United States

T: +1-347-918-3531

MEA

Future Market Insights

1602-6 Jumeirah Bay X2 Tower, Plot No: JLT-PH2-X2A,
Jumeirah Lakes Towers, Dubai,
United Arab Emirates

Europe

Future Market Insights

3rd Floor, 207 Regent Street,
W1B 3HH London
United Kingdom

T: + 44 (0) 20 8123 9659
D: +44 (0) 20 3287 4268

Asia Pacific

Future Market Insights

IndiaLand Global Tech Park, Unit UG-1, Behind Grand HighStreet, Phase 1, Hinjawadi, MH, Pune – 411057, India

High Purity Boehmite Market Outlook (2022-2032)

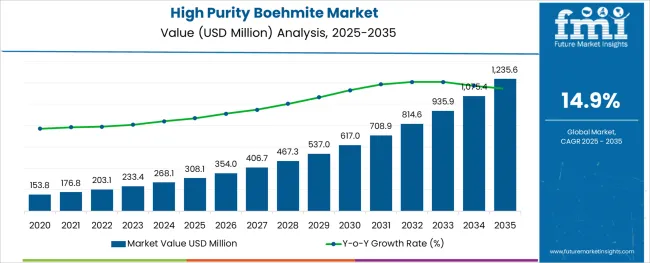
[250 Pages Report] Global sales of high purity boehmite are expected to rise at an impressive CAGR of 14.9% during the forecast period between 2022 and 2032, reaching a valuation of US$ 400 Million by 2032.  Growth in the market is driven by rising usage of high purity boehmite in a wide range of applications.

Report Attribute Details
High Purity Boehmite Market Projected Valuation (2032) US$ 400 Million
High Purity Boehmite Market Projected Growth Rate (2022 to 2032) 14.9% CAGR

High purity boehmite belong to the family of aluminium oxide hydroxide minerals. It is usually extracted from alumino-silicate bedrocks by using various techniques, thereby making it suitable for usage in a wide range of applications.

Present in miniature size, high purity boehmite contains a distinctive mixture of consistency, dispersibility, and purity, which makes it suitable for use in various applications across industries like automotive, electronics, and consumer goods.

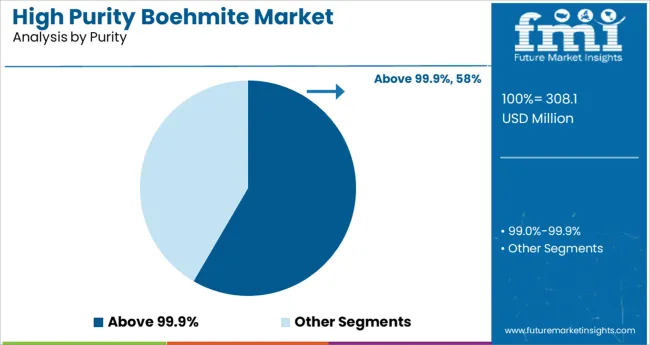
Commercially, high purity boehmite is available in two forms i.e., 99.0%-99.9% purity and above 99.9% purity. Among these, the 99.0%-99.9% purity boehmite is gaining traction for its numerous applications.

Don't pay for what you don't need

Customize your report by selecting specific countries or regions and save 30%!

Which are the Factors Responsible for the Growth of the High Purity Boehmite Market?

Rising application of high purity boehmite across various industries such as electronics, automotive, and construction is a major factor providing impetus to the growth of high purity boehmite market.

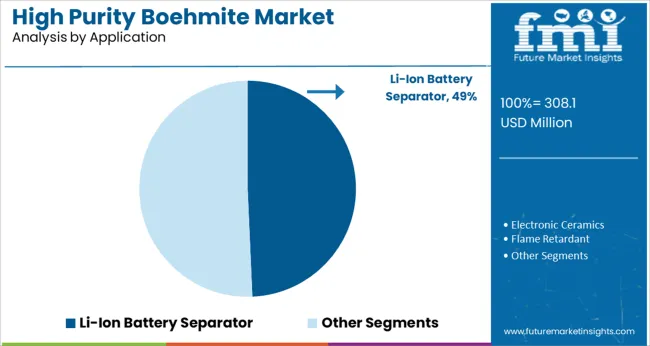
With rising energy concerns and growing awareness among people, there has been a rapid shift towards renewable energy sources during the last few decades. This has created enormous demand for renewable energy storage technologies like lithium-ion batteries. Driven by this, sales of high purity boehmite are expected to increase at a stellar pace during the forecast period, as it is used as an integral part of Li-ion battery separator.

Similarly, inherent properties of high purity boehmite like consistency, high purity, dispersibility, and versatile nature are encouraging its adoption in various applications, thereby playing a key role in expanding the global high purity boehmite market size.

In addition to this, increasing demand for plastics in various end-use industries is expected to create significant demand for high purity boehmite during the forecast period. this can be attributed to the rising usage of high purity boehmite as a plastic additive.

What Factor Restrains the Growth of the High Purity Boehmite Market?

Despite positive growth projections, there are certain factors that are likely to restrain the growth of high purity boehmite market. Some of these factors include high processing cost of high purity boehmite and availability of alternative materials.

Nikhil Kaitwade
Nikhil Kaitwade

Principal Consultant

Talk to Analyst

Find your sweet spots for generating winning opportunities in this market.

How is the Booming Automobile Industry Driving Growth in the Asia Pacific High Purity Boehmite Market?

As per FMI, Asia Pacific is expected to become the fastest growing and the largest market for high purity boehmite during the forecast period, owing to the rapidly growing automobile industry.

Over the years, there has been a rapid surge in the production and sales of electric vehicles across countries like China, South Korea, and India. This is emerging as a key factor in boosting the growth of high purity boehmite market in the Asia Pacific region.

Similarly, rising applications of high purity boehmite in electronics and construction industry will support the growth of the Asia Pacific high purity boehmite market during the forthcoming years.
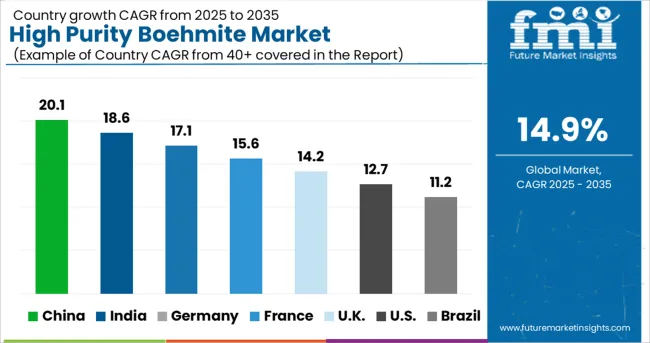
What is the Demand Outlook for High Purity Boehmite Market in Europe?

The high purity boehmite market in Europe is also projected to grow at a steady rate during the forecast period, owing to the increasing usage of high purity boehmite across various industries.

Demand is especially rising across countries like the U.K., Germany, and France due to the increasing usage of high purity boehmite in lithium-ion batteries, rising popualrity of electric vehicles, and growing demand for advanced flame retardants.

Moreover, the region is well-equipped with advanced manufacturing facilities for lithium-ion batteries. This factor is set to further drive the demand for high purity boehmite in the Europe market during the forecast period.
Get the data you need at a Fraction of the cost

Personalize your report by choosing insights you need
and save 40%!

Market Competition

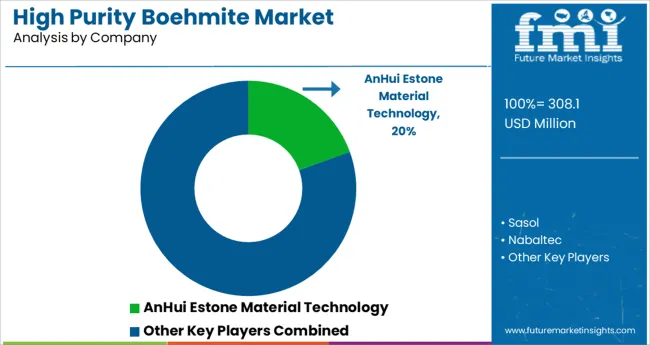
The global high purity boehmite market is moderately competitive. The key players have a well-defined presence in both developing and developed countries. Key players present in high purity boehmite market are Sasol, AnHui Estone Material Technology, TAIMEI Chemicals, Dequenne Chimie, Osang Group, Silkem, Xuancheng Jingrui New Materials, Tianjin Boyuan New Materials, Nabaltec, TOR Minerals, Kawai Lime Industry, among others.

These players are engaging in collaborations and strategic alliances so as to streamline the downstream flow of high purity boehmite products.

Report Scope

Report Attribute Details
Growth Rate (2022 to 20320 14.9%
Projected Market Size (2032) US$ 400 Million
Base Year for Estimation 2021
Historical Data 2015 to 2021
Forecast Period 2022 to 2032
Quantitative Units Revenue in US$ Million, and CAGR from 2022 to 2032
Report Coverage Revenue Forecast, Volume Forecast, Company Ranking, Competitive Landscape, Growth Factors, Trends and Pricing Analysis
Segments Covered
  • Purity
  • Product Type
  • Application
  • Region
Countries Covered
  • North America (USA., Canada)
  • Latin America (Mexico, Brazil)
  • Western Europe (Germany, Italy, France, UK, Spain)
  • Eastern Europe (Poland, Russia)
  • China
  • India
  • SEAP (India, ASEAN, Australia & New Zealand)
  • Japan
  • Middle East and Africa (GCC Countries, S. Africa, Northern Africa)
Key Companies Profiled
  • Sasol
  • AnHui Estone Material Technology
  • TAIMEI Chemicals
  • Dequenne Chimie
  • Osang Group
  • Silkem
  • Xuancheng Jingrui New Materials
  • Tianjin Boyuan New Materials
  • Nabaltec
  • TOR Minerals
  • Kawai Lime Industry
Customization Available Upon Request

Key Segments Profiled in the High Purity Boehmite Market Survey

By Purity:

  • Purity (99.0%-99.9%)
  • Purity (Above 99.9%)

By Product Type:

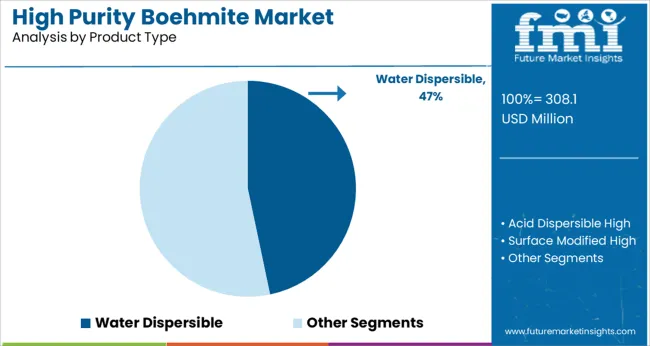
  • Water dispersible
  • Acid dispersible high
  • Surface modified high

By Application:

  • Li-Ion Battery Separator
  • Electronic Ceramics
  • Flame Retardant
  • Catalysis
  • Surface fractioning
  • Microcrystalline Ceramics
  • Refractory Materials
  • Rheology Control

By Region:

  • North America (U.S., Canada)
  • Latin America (Mexico, Brazil)
  • Western Europe (Germany, Italy, France, U.K, Spain)
  • Eastern Europe (Poland, Russia)
  • China
  • India
  • SEAP (India, ASEAN, Australia & New Zealand)
  • Japan
  • Middle East and Africa (GCC Countries, S. Africa, Northern Africa)

Frequently Asked Questions

What is the CAGR of high purity boehmite market for the 2022-2032?

High purity boehmite market is expected to register a prolific CAGR of 14.9% during the forecast period between 2022 to2032.

Which region is expected to lead the high purity boehmite market growth?

Asia Pacific is expected to lead the market growth of high purity boehmite.

What are the positive factors influencing high purity boehmite market?

Multiple applications of high purity boehmite, increasing usage in lithium-ion batteries due to accelerated development of automobile industry are positively influencing high purity boehmite market.

Table of Content

1. Executive Summary

    1.1. Global Market Outlook

    1.2. Demand-side Trends

    1.3. Supply-side Trends

    1.4. Technology Roadmap Analysis

    1.5. Analysis and Recommendations

2. Market Overview

    2.1. Market Coverage / Taxonomy

    2.2. Market Definition / Scope / Limitations

3. Market Background

    3.1. Market Dynamics

        3.1.1. Drivers

        3.1.2. Restraints

        3.1.3. Opportunity 

        3.1.4. Trends

    3.2. Scenario Forecast

        3.2.1. Demand in Optimistic Scenario

        3.2.2. Demand in Likely Scenario

        3.2.3. Demand in Conservative Scenario

    3.3. Opportunity Map Analysis

    3.4. Product Life Cycle Analysis

    3.5. Supply Chain Analysis

        3.5.1. Supply Side Participants and their Roles

            3.5.1.1. Producers

            3.5.1.2. Mid-Level Participants (Traders/ Agents/ Brokers)

            3.5.1.3. Wholesalers and Distributors

        3.5.2. Value Added and Value Created at Node in the Supply Chain

        3.5.3. List of Raw Material Suppliers

        3.5.4. List of Existing and Potential Buyer’s

    3.6. Investment Feasibility Matrix

    3.7. Value Chain Analysis

        3.7.1. Profit Margin Analysis

        3.7.2. Wholesalers and Distributors

        3.7.3. Retailers

    3.8. PESTLE and Porter’s Analysis

    3.9. Regulatory Landscape

        3.9.1. By Key Regions

        3.9.2. By Key Countries

    3.10. Regional Parent Market Outlook

    3.11. Production and Consumption Statistics

    3.12. Import and Export Statistics

4. Global Market Analysis 2017-2021 and Forecast, 2022-2032

    4.1. Historical Market Size Value (US$ Mn) & Volume (Tons) Analysis, 2017-2021

    4.2. Current and Future Market Size Value (US$ Mn) & Volume (Tons) Projections, 2022-2032

        4.2.1. Y-o-Y Growth Trend Analysis

        4.2.2. Absolute $ Opportunity Analysis

5. Global Market Analysis 2017-2021 and Forecast 2022-2032, By Purity

    5.1. Introduction / Key Findings

    5.2. Historical Market Size Value (US$ Mn) & Volume (Tons) Analysis By Purity, 2017-2021

    5.3. Current and Future Market Size Value (US$ Mn) & Volume (Tons) Analysis and Forecast By Purity, 2022-2032

        5.3.1. 99.0%-99.9%

        5.3.2. Above 99.9%

    5.4. Y-o-Y Growth Trend Analysis By Purity, 2017-2021

    5.5. Absolute $ Opportunity Analysis By Purity, 2022-2032

6. Global Market Analysis 2017-2021 and Forecast 2022-2032, By Product Type

    6.1. Introduction / Key Findings

    6.2. Historical Market Size Value (US$ Mn) & Volume (Tons) Analysis By Product Type, 2017-2021

    6.3. Current and Future Market Size Value (US$ Mn) & Volume (Tons) Analysis and Forecast By Product Type, 2022-2032

        6.3.1. Water Dispersible

        6.3.2. Acid Dispersible High

        6.3.3. Surface Modified High

    6.4. Y-o-Y Growth Trend Analysis By Product Type, 2017-2021

    6.5. Absolute $ Opportunity Analysis By Product Type, 2022-2032

7. Global Market Analysis 2017-2021 and Forecast 2022-2032, By Application

    7.1. Introduction / Key Findings

    7.2. Historical Market Size Value (US$ Mn) & Volume (Tons) Analysis By Application, 2017-2021

    7.3. Current and Future Market Size Value (US$ Mn) & Volume (Tons) Analysis and Forecast By Application, 2022-2032

        7.3.1. Li-Ion Battery Separator

        7.3.2. Electronic Ceramics

        7.3.3. Flame Retardant

        7.3.4. Catalysis

        7.3.5. Surface Fractioning

        7.3.6. Microcrystalline Ceramics

        7.3.7. Refractory Materials

        7.3.8. Rheology Control

    7.4. Y-o-Y Growth Trend Analysis By Application, 2017-2021

    7.5. Absolute $ Opportunity Analysis By Application, 2022-2032

8. Global Market Analysis 2017-2021 and Forecast 2022-2032, By Region

    8.1. Introduction

    8.2. Historical Market Size Value (US$ Mn) & Volume (Tons) Analysis By Region, 2017-2021

    8.3. Current Market Size Value (US$ Mn) & Volume (Tons) Analysis and Forecast By Region, 2022-2032

        8.3.1. North America

        8.3.2. Latin America

        8.3.3. Europe

        8.3.4. Asia Pacific

        8.3.5. Middle East and Africa

    8.4. Market Attractiveness Analysis By Region

9. North America Market Analysis 2017-2021 and Forecast 2022-2032, By Country

    9.1. Historical Market Size Value (US$ Mn) & Volume (Tons) Trend Analysis By Market Taxonomy, 2017-2021

    9.2. Market Size Value (US$ Mn) & Volume (Tons) Forecast By Market Taxonomy, 2022-2032

        9.2.1. By Country

            9.2.1.1. U.S.

            9.2.1.2. Canada

        9.2.2. By Purity

        9.2.3. By Product Type

        9.2.4. By Application

    9.3. Market Attractiveness Analysis

        9.3.1. By Country

        9.3.2. By Purity

        9.3.3. By Product Type

        9.3.4. By Application

    9.4. Key Takeaways

10. Latin America Market Analysis 2017-2021 and Forecast 2022-2032, By Country

    10.1. Historical Market Size Value (US$ Mn) & Volume (Tons) Trend Analysis By Market Taxonomy, 2017-2021

    10.2. Market Size Value (US$ Mn) & Volume (Tons) Forecast By Market Taxonomy, 2022-2032

        10.2.1. By Country

            10.2.1.1. Brazil

            10.2.1.2. Mexico

            10.2.1.3. Argentina

            10.2.1.4. Chile

            10.2.1.5. Peru

            10.2.1.6. Rest of Latin America

        10.2.2. By Purity

        10.2.3. By Product Type

        10.2.4. By Application

    10.3. Market Attractiveness Analysis

        10.3.1. By Country

        10.3.2. By Purity

        10.3.3. By Product Type

        10.3.4. By Application

    10.4. Key Takeaways

11. Europe Market Analysis 2017-2021 and Forecast 2022-2032, By Country

    11.1. Historical Market Size Value (US$ Mn) & Volume (Tons) Trend Analysis By Market Taxonomy, 2017-2021

    11.2. Market Size Value (US$ Mn) & Volume (Tons) Forecast By Market Taxonomy, 2022-2032

        11.2.1. By Country

            11.2.1.1. Germany

            11.2.1.2. Italy

            11.2.1.3. France

            11.2.1.4. U.K.

            11.2.1.5. Spain

            11.2.1.6. Russia

            11.2.1.7. BENELUX

            11.2.1.8. Rest of Europe

        11.2.2. By Purity

        11.2.3. By Product Type

        11.2.4. By Application

    11.3. Market Attractiveness Analysis

        11.3.1. By Country

        11.3.2. By Purity

        11.3.3. By Product Type

        11.3.4. By Application

    11.4. Key Takeaways

12. Asia Pacific Market Analysis 2017-2021 and Forecast 2022-2032, By Country

    12.1. Historical Market Size Value (US$ Mn) & Volume (Tons) Trend Analysis By Market Taxonomy, 2017-2021

    12.2. Market Size Value (US$ Mn) & Volume (Tons) Forecast By Market Taxonomy, 2022-2032

        12.2.1. By Country

            12.2.1.1. China

            12.2.1.2. Japan

            12.2.1.3. South Korea

            12.2.1.4. Rest of Asia Pacific

        12.2.2. By Purity

        12.2.3. By Product Type

        12.2.4. By Application

    12.3. Market Attractiveness Analysis

        12.3.1. By Country

        12.3.2. By Purity

        12.3.3. By Product Type

        12.3.4. By Application

    12.4. Key Takeaways

13. Middle East and Africa Market Analysis 2017-2021 and Forecast 2022-2032, By Country

    13.1. Historical Market Size Value (US$ Mn) & Volume (Tons) Trend Analysis By Market Taxonomy, 2017-2021

    13.2. Market Size Value (US$ Mn) & Volume (Tons) Forecast By Market Taxonomy, 2022-2032

        13.2.1. By Country

            13.2.1.1. GCC Countries

            13.2.1.2. South Africa

            13.2.1.3. Turkey

            13.2.1.4. Rest of Middle East and Africa

        13.2.2. By Purity

        13.2.3. By Product Type

        13.2.4. By Application

    13.3. Market Attractiveness Analysis

        13.3.1. By Country

        13.3.2. By Purity

        13.3.3. By Product Type

        13.3.4. By Application

    13.4. Key Takeaways

14. Key Countries Market Analysis

    14.1. U.S.

        14.1.1. Pricing Analysis

        14.1.2. Market Share Analysis, 2021

            14.1.2.1. By Purity

            14.1.2.2. By Product Type

            14.1.2.3. By Application

    14.2. Canada

        14.2.1. Pricing Analysis

        14.2.2. Market Share Analysis, 2021

            14.2.2.1. By Purity

            14.2.2.2. By Product Type

            14.2.2.3. By Application

    14.3. Brazil

        14.3.1. Pricing Analysis

        14.3.2. Market Share Analysis, 2021

            14.3.2.1. By Purity

            14.3.2.2. By Product Type

            14.3.2.3. By Application

    14.4. Mexico

        14.4.1. Pricing Analysis

        14.4.2. Market Share Analysis, 2021

            14.4.2.1. By Purity

            14.4.2.2. By Product Type

            14.4.2.3. By Application

    14.5. Argentina

        14.5.1. Pricing Analysis

        14.5.2. Market Share Analysis, 2021

            14.5.2.1. By Purity

            14.5.2.2. By Product Type

            14.5.2.3. By Application

    14.6. Chile

        14.6.1. Pricing Analysis

        14.6.2. Market Share Analysis, 2021

            14.6.2.1. By Purity

            14.6.2.2. By Product Type

            14.6.2.3. By Application

    14.7. Peru

        14.7.1. Pricing Analysis

        14.7.2. Market Share Analysis, 2021

            14.7.2.1. By Purity

            14.7.2.2. By Product Type

            14.7.2.3. By Application

    14.8. Germany

        14.8.1. Pricing Analysis

        14.8.2. Market Share Analysis, 2021

            14.8.2.1. By Purity

            14.8.2.2. By Product Type

            14.8.2.3. By Application

    14.9. Italy

        14.9.1. Pricing Analysis

        14.9.2. Market Share Analysis, 2021

            14.9.2.1. By Purity

            14.9.2.2. By Product Type

            14.9.2.3. By Application

    14.10. France

        14.10.1. Pricing Analysis

        14.10.2. Market Share Analysis, 2021

            14.10.2.1. By Purity

            14.10.2.2. By Product Type

            14.10.2.3. By Application

    14.11. U.K.

        14.11.1. Pricing Analysis

        14.11.2. Market Share Analysis, 2021

            14.11.2.1. By Purity

            14.11.2.2. By Product Type

            14.11.2.3. By Application

    14.12. Spain

        14.12.1. Pricing Analysis

        14.12.2. Market Share Analysis, 2021

            14.12.2.1. By Purity

            14.12.2.2. By Product Type

            14.12.2.3. By Application

    14.13. Russia

        14.13.1. Pricing Analysis

        14.13.2. Market Share Analysis, 2021

            14.13.2.1. By Purity

            14.13.2.2. By Product Type

            14.13.2.3. By Application

    14.14. BENELUX

        14.14.1. Pricing Analysis

        14.14.2. Market Share Analysis, 2021

            14.14.2.1. By Purity

            14.14.2.2. By Product Type

            14.14.2.3. By Application

    14.15. China

        14.15.1. Pricing Analysis

        14.15.2. Market Share Analysis, 2021

            14.15.2.1. By Purity

            14.15.2.2. By Product Type

            14.15.2.3. By Application

    14.16. Japan

        14.16.1. Pricing Analysis

        14.16.2. Market Share Analysis, 2021

            14.16.2.1. By Purity

            14.16.2.2. By Product Type

            14.16.2.3. By Application

    14.17. South Korea

        14.17.1. Pricing Analysis

        14.17.2. Market Share Analysis, 2021

            14.17.2.1. By Purity

            14.17.2.2. By Product Type

            14.17.2.3. By Application

    14.18. GCC Countries

        14.18.1. Pricing Analysis

        14.18.2. Market Share Analysis, 2021

            14.18.2.1. By Purity

            14.18.2.2. By Product Type

            14.18.2.3. By Application

    14.19. South Africa

        14.19.1. Pricing Analysis

        14.19.2. Market Share Analysis, 2021

            14.19.2.1. By Purity

            14.19.2.2. By Product Type

            14.19.2.3. By Application

    14.20. Turkey

        14.20.1. Pricing Analysis

        14.20.2. Market Share Analysis, 2021

            14.20.2.1. By Purity

            14.20.2.2. By Product Type

            14.20.2.3. By Application

15. Market Structure Analysis

    15.1. Competition Dashboard

    15.2. Competition Benchmarking

    15.3. Market Share Analysis of Top Players

        15.3.1. By Regional

        15.3.2. By Purity

        15.3.3. By Product Type

        15.3.4. By Application

16. Competition Analysis

    16.1. Competition Deep Dive

        16.1.1. AnHui Estone Material Technology

            16.1.1.1. Overview

            16.1.1.2. Product Portfolio

            16.1.1.3. Profitability by Market Segments

            16.1.1.4. Sales Footprint

            16.1.1.5. Strategy Overview

                16.1.1.5.1. Marketing Strategy

                16.1.1.5.2. Product Strategy

                16.1.1.5.3. Channel Strategy

        16.1.2. Sasol

            16.1.2.1. Overview

            16.1.2.2. Product Portfolio

            16.1.2.3. Profitability by Market Segments

            16.1.2.4. Sales Footprint

            16.1.2.5. Strategy Overview

                16.1.2.5.1. Marketing Strategy

                16.1.2.5.2. Product Strategy

                16.1.2.5.3. Channel Strategy

        16.1.3. Nabaltec

            16.1.3.1. Overview

            16.1.3.2. Product Portfolio

            16.1.3.3. Profitability by Market Segments

            16.1.3.4. Sales Footprint

            16.1.3.5. Strategy Overview

                16.1.3.5.1. Marketing Strategy

                16.1.3.5.2. Product Strategy

                16.1.3.5.3. Channel Strategy

        16.1.4. TOR Minerals

            16.1.4.1. Overview

            16.1.4.2. Product Portfolio

            16.1.4.3. Profitability by Market Segments

            16.1.4.4. Sales Footprint

            16.1.4.5. Strategy Overview

                16.1.4.5.1. Marketing Strategy

                16.1.4.5.2. Product Strategy

                16.1.4.5.3. Channel Strategy

        16.1.5. Kawai Lime Industry

            16.1.5.1. Overview

            16.1.5.2. Product Portfolio

            16.1.5.3. Profitability by Market Segments

            16.1.5.4. Sales Footprint

            16.1.5.5. Strategy Overview

                16.1.5.5.1. Marketing Strategy

                16.1.5.5.2. Product Strategy

                16.1.5.5.3. Channel Strategy

        16.1.6. TAIMEI Chemicals

            16.1.6.1. Overview

            16.1.6.2. Product Portfolio

            16.1.6.3. Profitability by Market Segments

            16.1.6.4. Sales Footprint

            16.1.6.5. Strategy Overview

                16.1.6.5.1. Marketing Strategy

                16.1.6.5.2. Product Strategy

                16.1.6.5.3. Channel Strategy

        16.1.7. Dequenne Chimie

            16.1.7.1. Overview

            16.1.7.2. Product Portfolio

            16.1.7.3. Profitability by Market Segments

            16.1.7.4. Sales Footprint

            16.1.7.5. Strategy Overview

                16.1.7.5.1. Marketing Strategy

                16.1.7.5.2. Product Strategy

                16.1.7.5.3. Channel Strategy

        16.1.8. Osang Group

            16.1.8.1. Overview

            16.1.8.2. Product Portfolio

            16.1.8.3. Profitability by Market Segments

            16.1.8.4. Sales Footprint

            16.1.8.5. Strategy Overview

                16.1.8.5.1. Marketing Strategy

                16.1.8.5.2. Product Strategy

                16.1.8.5.3. Channel Strategy

        16.1.9. Silkem

            16.1.9.1. Overview

            16.1.9.2. Product Portfolio

            16.1.9.3. Profitability by Market Segments

            16.1.9.4. Sales Footprint

            16.1.9.5. Strategy Overview

                16.1.9.5.1. Marketing Strategy

                16.1.9.5.2. Product Strategy

                16.1.9.5.3. Channel Strategy

        16.1.10. Xuancheng Jingrui New Materials

            16.1.10.1. Overview

            16.1.10.2. Product Portfolio

            16.1.10.3. Profitability by Market Segments

            16.1.10.4. Sales Footprint

            16.1.10.5. Strategy Overview

                16.1.10.5.1. Marketing Strategy

                16.1.10.5.2. Product Strategy

                16.1.10.5.3. Channel Strategy

        16.1.11. Tianjin Boyuan New Materials

            16.1.11.1. Overview

            16.1.11.2. Product Portfolio

            16.1.11.3. Profitability by Market Segments

            16.1.11.4. Sales Footprint

            16.1.11.5. Strategy Overview

                16.1.11.5.1. Marketing Strategy

                16.1.11.5.2. Product Strategy

                16.1.11.5.3. Channel Strategy

17. Assumptions & Acronyms Used

18. Research Methodology

List of Tables

Table 1: Global Market Value (US$ Mn) Forecast by Region, 2017-2032

Table 2: Global Market Volume (Tons) Forecast by Region, 2017-2032

Table 3: Global Market Value (US$ Mn) Forecast by Purity, 2017-2032

Table 4: Global Market Volume (Tons) Forecast by Purity, 2017-2032

Table 5: Global Market Value (US$ Mn) Forecast by Product Type, 2017-2032

Table 6: Global Market Volume (Tons) Forecast by Product Type, 2017-2032

Table 7: Global Market Value (US$ Mn) Forecast by Application, 2017-2032

Table 8: Global Market Volume (Tons) Forecast by Application, 2017-2032

Table 9: North America Market Value (US$ Mn) Forecast by Country, 2017-2032

Table 10: North America Market Volume (Tons) Forecast by Country, 2017-2032

Table 11: North America Market Value (US$ Mn) Forecast by Purity, 2017-2032

Table 12: North America Market Volume (Tons) Forecast by Purity, 2017-2032

Table 13: North America Market Value (US$ Mn) Forecast by Product Type, 2017-2032

Table 14: North America Market Volume (Tons) Forecast by Product Type, 2017-2032

Table 15: North America Market Value (US$ Mn) Forecast by Application, 2017-2032

Table 16: North America Market Volume (Tons) Forecast by Application, 2017-2032

Table 17: Latin America Market Value (US$ Mn) Forecast by Country, 2017-2032

Table 18: Latin America Market Volume (Tons) Forecast by Country, 2017-2032

Table 19: Latin America Market Value (US$ Mn) Forecast by Purity, 2017-2032

Table 20: Latin America Market Volume (Tons) Forecast by Purity, 2017-2032

Table 21: Latin America Market Value (US$ Mn) Forecast by Product Type, 2017-2032

Table 22: Latin America Market Volume (Tons) Forecast by Product Type, 2017-2032

Table 23: Latin America Market Value (US$ Mn) Forecast by Application, 2017-2032

Table 24: Latin America Market Volume (Tons) Forecast by Application, 2017-2032

Table 25: Europe Market Value (US$ Mn) Forecast by Country, 2017-2032

Table 26: Europe Market Volume (Tons) Forecast by Country, 2017-2032

Table 27: Europe Market Value (US$ Mn) Forecast by Purity, 2017-2032

Table 28: Europe Market Volume (Tons) Forecast by Purity, 2017-2032

Table 29: Europe Market Value (US$ Mn) Forecast by Product Type, 2017-2032

Table 30: Europe Market Volume (Tons) Forecast by Product Type, 2017-2032

Table 31: Europe Market Value (US$ Mn) Forecast by Application, 2017-2032

Table 32: Europe Market Volume (Tons) Forecast by Application, 2017-2032

Table 33: Asia Pacific Market Value (US$ Mn) Forecast by Country, 2017-2032

Table 34: Asia Pacific Market Volume (Tons) Forecast by Country, 2017-2032

Table 35: Asia Pacific Market Value (US$ Mn) Forecast by Purity, 2017-2032

Table 36: Asia Pacific Market Volume (Tons) Forecast by Purity, 2017-2032

Table 37: Asia Pacific Market Value (US$ Mn) Forecast by Product Type, 2017-2032

Table 38: Asia Pacific Market Volume (Tons) Forecast by Product Type, 2017-2032

Table 39: Asia Pacific Market Value (US$ Mn) Forecast by Application, 2017-2032

Table 40: Asia Pacific Market Volume (Tons) Forecast by Application, 2017-2032

Table 41: Middle East and Africa Market Value (US$ Mn) Forecast by Country, 2017-2032

Table 42: Middle East and Africa Market Volume (Tons) Forecast by Country, 2017-2032

Table 43: Middle East and Africa Market Value (US$ Mn) Forecast by Purity, 2017-2032

Table 44: Middle East and Africa Market Volume (Tons) Forecast by Purity, 2017-2032

Table 45: Middle East and Africa Market Value (US$ Mn) Forecast by Product Type, 2017-2032

Table 46: Middle East and Africa Market Volume (Tons) Forecast by Product Type, 2017-2032

Table 47: Middle East and Africa Market Value (US$ Mn) Forecast by Application, 2017-2032

Table 48: Middle East and Africa Market Volume (Tons) Forecast by Application, 2017-2032

List of Charts

Figure 1: Global Market Value (US$ Mn) by Purity, 2022-2032

Figure 2: Global Market Value (US$ Mn) by Product Type, 2022-2032

Figure 3: Global Market Value (US$ Mn) by Application, 2022-2032

Figure 4: Global Market Value (US$ Mn) by Region, 2022-2032

Figure 5: Global Market Value (US$ Mn) Analysis by Region, 2017-2032

Figure 6: Global Market Volume (Tons) Analysis by Region, 2017-2032

Figure 7: Global Market Value Share (%) and BPS Analysis by Region, 2022-2032

Figure 8: Global Market Y-o-Y Growth (%) Projections by Region, 2022-2032

Figure 9: Global Market Value (US$ Mn) Analysis by Purity, 2017-2032

Figure 10: Global Market Volume (Tons) Analysis by Purity, 2017-2032

Figure 11: Global Market Value Share (%) and BPS Analysis by Purity, 2022-2032

Figure 12: Global Market Y-o-Y Growth (%) Projections by Purity, 2022-2032

Figure 13: Global Market Value (US$ Mn) Analysis by Product Type, 2017-2032

Figure 14: Global Market Volume (Tons) Analysis by Product Type, 2017-2032

Figure 15: Global Market Value Share (%) and BPS Analysis by Product Type, 2022-2032

Figure 16: Global Market Y-o-Y Growth (%) Projections by Product Type, 2022-2032

Figure 17: Global Market Value (US$ Mn) Analysis by Application, 2017-2032

Figure 18: Global Market Volume (Tons) Analysis by Application, 2017-2032

Figure 19: Global Market Value Share (%) and BPS Analysis by Application, 2022-2032

Figure 20: Global Market Y-o-Y Growth (%) Projections by Application, 2022-2032

Figure 21: Global Market Attractiveness by Purity, 2022-2032

Figure 22: Global Market Attractiveness by Product Type, 2022-2032

Figure 23: Global Market Attractiveness by Application, 2022-2032

Figure 24: Global Market Attractiveness by Region, 2022-2032

Figure 25: North America Market Value (US$ Mn) by Purity, 2022-2032

Figure 26: North America Market Value (US$ Mn) by Product Type, 2022-2032

Figure 27: North America Market Value (US$ Mn) by Application, 2022-2032

Figure 28: North America Market Value (US$ Mn) by Country, 2022-2032

Figure 29: North America Market Value (US$ Mn) Analysis by Country, 2017-2032

Figure 30: North America Market Volume (Tons) Analysis by Country, 2017-2032

Figure 31: North America Market Value Share (%) and BPS Analysis by Country, 2022-2032

Figure 32: North America Market Y-o-Y Growth (%) Projections by Country, 2022-2032

Figure 33: North America Market Value (US$ Mn) Analysis by Purity, 2017-2032

Figure 34: North America Market Volume (Tons) Analysis by Purity, 2017-2032

Figure 35: North America Market Value Share (%) and BPS Analysis by Purity, 2022-2032

Figure 36: North America Market Y-o-Y Growth (%) Projections by Purity, 2022-2032

Figure 37: North America Market Value (US$ Mn) Analysis by Product Type, 2017-2032

Figure 38: North America Market Volume (Tons) Analysis by Product Type, 2017-2032

Figure 39: North America Market Value Share (%) and BPS Analysis by Product Type, 2022-2032

Figure 40: North America Market Y-o-Y Growth (%) Projections by Product Type, 2022-2032

Figure 41: North America Market Value (US$ Mn) Analysis by Application, 2017-2032

Figure 42: North America Market Volume (Tons) Analysis by Application, 2017-2032

Figure 43: North America Market Value Share (%) and BPS Analysis by Application, 2022-2032

Figure 44: North America Market Y-o-Y Growth (%) Projections by Application, 2022-2032

Figure 45: North America Market Attractiveness by Purity, 2022-2032

Figure 46: North America Market Attractiveness by Product Type, 2022-2032

Figure 47: North America Market Attractiveness by Application, 2022-2032

Figure 48: North America Market Attractiveness by Country, 2022-2032

Figure 49: Latin America Market Value (US$ Mn) by Purity, 2022-2032

Figure 50: Latin America Market Value (US$ Mn) by Product Type, 2022-2032

Figure 51: Latin America Market Value (US$ Mn) by Application, 2022-2032

Figure 52: Latin America Market Value (US$ Mn) by Country, 2022-2032

Figure 53: Latin America Market Value (US$ Mn) Analysis by Country, 2017-2032

Figure 54: Latin America Market Volume (Tons) Analysis by Country, 2017-2032

Figure 55: Latin America Market Value Share (%) and BPS Analysis by Country, 2022-2032

Figure 56: Latin America Market Y-o-Y Growth (%) Projections by Country, 2022-2032

Figure 57: Latin America Market Value (US$ Mn) Analysis by Purity, 2017-2032

Figure 58: Latin America Market Volume (Tons) Analysis by Purity, 2017-2032

Figure 59: Latin America Market Value Share (%) and BPS Analysis by Purity, 2022-2032

Figure 60: Latin America Market Y-o-Y Growth (%) Projections by Purity, 2022-2032

Figure 61: Latin America Market Value (US$ Mn) Analysis by Product Type, 2017-2032

Figure 62: Latin America Market Volume (Tons) Analysis by Product Type, 2017-2032

Figure 63: Latin America Market Value Share (%) and BPS Analysis by Product Type, 2022-2032

Figure 64: Latin America Market Y-o-Y Growth (%) Projections by Product Type, 2022-2032

Figure 65: Latin America Market Value (US$ Mn) Analysis by Application, 2017-2032

Figure 66: Latin America Market Volume (Tons) Analysis by Application, 2017-2032

Figure 67: Latin America Market Value Share (%) and BPS Analysis by Application, 2022-2032

Figure 68: Latin America Market Y-o-Y Growth (%) Projections by Application, 2022-2032

Figure 69: Latin America Market Attractiveness by Purity, 2022-2032

Figure 70: Latin America Market Attractiveness by Product Type, 2022-2032

Figure 71: Latin America Market Attractiveness by Application, 2022-2032

Figure 72: Latin America Market Attractiveness by Country, 2022-2032

Figure 73: Europe Market Value (US$ Mn) by Purity, 2022-2032

Figure 74: Europe Market Value (US$ Mn) by Product Type, 2022-2032

Figure 75: Europe Market Value (US$ Mn) by Application, 2022-2032

Figure 76: Europe Market Value (US$ Mn) by Country, 2022-2032

Figure 77: Europe Market Value (US$ Mn) Analysis by Country, 2017-2032

Figure 78: Europe Market Volume (Tons) Analysis by Country, 2017-2032

Figure 79: Europe Market Value Share (%) and BPS Analysis by Country, 2022-2032

Figure 80: Europe Market Y-o-Y Growth (%) Projections by Country, 2022-2032

Figure 81: Europe Market Value (US$ Mn) Analysis by Purity, 2017-2032

Figure 82: Europe Market Volume (Tons) Analysis by Purity, 2017-2032

Figure 83: Europe Market Value Share (%) and BPS Analysis by Purity, 2022-2032

Figure 84: Europe Market Y-o-Y Growth (%) Projections by Purity, 2022-2032

Figure 85: Europe Market Value (US$ Mn) Analysis by Product Type, 2017-2032

Figure 86: Europe Market Volume (Tons) Analysis by Product Type, 2017-2032

Figure 87: Europe Market Value Share (%) and BPS Analysis by Product Type, 2022-2032

Figure 88: Europe Market Y-o-Y Growth (%) Projections by Product Type, 2022-2032

Figure 89: Europe Market Value (US$ Mn) Analysis by Application, 2017-2032

Figure 90: Europe Market Volume (Tons) Analysis by Application, 2017-2032

Figure 91: Europe Market Value Share (%) and BPS Analysis by Application, 2022-2032

Figure 92: Europe Market Y-o-Y Growth (%) Projections by Application, 2022-2032

Figure 93: Europe Market Attractiveness by Purity, 2022-2032

Figure 94: Europe Market Attractiveness by Product Type, 2022-2032

Figure 95: Europe Market Attractiveness by Application, 2022-2032

Figure 96: Europe Market Attractiveness by Country, 2022-2032

Figure 97: Asia Pacific Market Value (US$ Mn) by Purity, 2022-2032

Figure 98: Asia Pacific Market Value (US$ Mn) by Product Type, 2022-2032

Figure 99: Asia Pacific Market Value (US$ Mn) by Application, 2022-2032

Figure 100: Asia Pacific Market Value (US$ Mn) by Country, 2022-2032

Figure 101: Asia Pacific Market Value (US$ Mn) Analysis by Country, 2017-2032

Figure 102: Asia Pacific Market Volume (Tons) Analysis by Country, 2017-2032

Figure 103: Asia Pacific Market Value Share (%) and BPS Analysis by Country, 2022-2032

Figure 104: Asia Pacific Market Y-o-Y Growth (%) Projections by Country, 2022-2032

Figure 105: Asia Pacific Market Value (US$ Mn) Analysis by Purity, 2017-2032

Figure 106: Asia Pacific Market Volume (Tons) Analysis by Purity, 2017-2032

Figure 107: Asia Pacific Market Value Share (%) and BPS Analysis by Purity, 2022-2032

Figure 108: Asia Pacific Market Y-o-Y Growth (%) Projections by Purity, 2022-2032

Figure 109: Asia Pacific Market Value (US$ Mn) Analysis by Product Type, 2017-2032

Figure 110: Asia Pacific Market Volume (Tons) Analysis by Product Type, 2017-2032

Figure 111: Asia Pacific Market Value Share (%) and BPS Analysis by Product Type, 2022-2032

Figure 112: Asia Pacific Market Y-o-Y Growth (%) Projections by Product Type, 2022-2032

Figure 113: Asia Pacific Market Value (US$ Mn) Analysis by Application, 2017-2032

Figure 114: Asia Pacific Market Volume (Tons) Analysis by Application, 2017-2032

Figure 115: Asia Pacific Market Value Share (%) and BPS Analysis by Application, 2022-2032

Figure 116: Asia Pacific Market Y-o-Y Growth (%) Projections by Application, 2022-2032

Figure 117: Asia Pacific Market Attractiveness by Purity, 2022-2032

Figure 118: Asia Pacific Market Attractiveness by Product Type, 2022-2032

Figure 119: Asia Pacific Market Attractiveness by Application, 2022-2032

Figure 120: Asia Pacific Market Attractiveness by Country, 2022-2032

Figure 121: Middle East and Africa Market Value (US$ Mn) by Purity, 2022-2032

Figure 122: Middle East and Africa Market Value (US$ Mn) by Product Type, 2022-2032

Figure 123: Middle East and Africa Market Value (US$ Mn) by Application, 2022-2032

Figure 124: Middle East and Africa Market Value (US$ Mn) by Country, 2022-2032

Figure 125: Middle East and Africa Market Value (US$ Mn) Analysis by Country, 2017-2032

Figure 126: Middle East and Africa Market Volume (Tons) Analysis by Country, 2017-2032

Figure 127: Middle East and Africa Market Value Share (%) and BPS Analysis by Country, 2022-2032

Figure 128: Middle East and Africa Market Y-o-Y Growth (%) Projections by Country, 2022-2032

Figure 129: Middle East and Africa Market Value (US$ Mn) Analysis by Purity, 2017-2032

Figure 130: Middle East and Africa Market Volume (Tons) Analysis by Purity, 2017-2032

Figure 131: Middle East and Africa Market Value Share (%) and BPS Analysis by Purity, 2022-2032

Figure 132: Middle East and Africa Market Y-o-Y Growth (%) Projections by Purity, 2022-2032

Figure 133: Middle East and Africa Market Value (US$ Mn) Analysis by Product Type, 2017-2032

Figure 134: Middle East and Africa Market Volume (Tons) Analysis by Product Type, 2017-2032

Figure 135: Middle East and Africa Market Value Share (%) and BPS Analysis by Product Type, 2022-2032

Figure 136: Middle East and Africa Market Y-o-Y Growth (%) Projections by Product Type, 2022-2032

Figure 137: Middle East and Africa Market Value (US$ Mn) Analysis by Application, 2017-2032

Figure 138: Middle East and Africa Market Volume (Tons) Analysis by Application, 2017-2032

Figure 139: Middle East and Africa Market Value Share (%) and BPS Analysis by Application, 2022-2032

Figure 140: Middle East and Africa Market Y-o-Y Growth (%) Projections by Application, 2022-2032

Figure 141: Middle East and Africa Market Attractiveness by Purity, 2022-2032

Figure 142: Middle East and Africa Market Attractiveness by Product Type, 2022-2032

Figure 143: Middle East and Africa Market Attractiveness by Application, 2022-2032

Figure 144: Middle East and Africa Market Attractiveness by Country, 2022-2032

Recommendations

Chemicals & Materials

High Purity Solvents Market

Published : March 2023

Explore Chemicals & Materials Insights

View Reports

High Purity Boehmite Market