Reports

- Global Locations -

Headquarters

Future Market Insights, Inc.

Christiana Corporate, 200
Continental Drive, Suite 401,
Newark, Delaware - 19713,
United States

T: +1-845-579-5705

Americas

Future Market Insights, Inc.

616 Corporate Way, Suite 2-9018,
Valley Cottage, NY 10989, United States

T: +1-347-918-3531

MEA

Future Market Insights

1602-6 Jumeirah Bay X2 Tower, Plot No: JLT-PH2-X2A,
Jumeirah Lakes Towers, Dubai,
United Arab Emirates

Europe

Future Market Insights

3rd Floor, 207 Regent Street,
W1B 3HH London
United Kingdom

T: + 44 (0) 20 8123 9659
D: +44 (0) 20 3287 4268

Asia Pacific

Future Market Insights

IndiaLand Global Tech Park, Unit UG-1, Behind Grand HighStreet, Phase 1, Hinjawadi, MH, Pune – 411057, India

High Performance Composites Market Outlook from 2024 to 2034

The high performance composites market is expected to be valued at US$ 13.9 billion in 2024. The high performance composites are predicted to rise at a promising CAGR of 10.3% from 2024 to 2034. The global market is anticipated to reach US$ 36.8 billion by 2034.

Attributes Key Insights
Estimated Market Size in 2024 US$ 13.9 billion
Projected Market Value in 2034 US$ 36.8 billion
Value-based CAGR from 2024 to 2034 10.3%

Don't pay for what you don't need

Customize your report by selecting specific countries or regions and save 30%!

Key Trends and Highlights

  • Growing demand in aerospace and automotive sectors.
  • Increasing use of sports equipment and consumer goods.
  • Advancements in manufacturing technologies.
  • Rising investments in research and development.
  • Shift towards sustainable and eco-friendly composites.
  • Expanding applications in construction and infrastructure.
  • Focus on lightweight materials to enhance fuel efficiency.

2019 to 2023 Historical Analysis vs. 2024 to 2034 Market Forecast Projections

From 2019 to 2023, the high performance composites market demonstrated robust growth with a historical CAGR of 12.7%. This period saw significant demand from the aerospace, automotive, and construction industries, driven by the need for lightweight and durable materials. Technological advancements and increasing environmental concerns also contributed to the market expansion during this timeframe.

Looking ahead to the forecasted period from 2024 to 2034, the market is expected to maintain a strong growth trajectory, albeit at a slightly moderated pace with a projected CAGR of 10.3%. Factors such as continued innovation in composite materials, expanding applications in emerging sectors, and growing emphasis on sustainability are expected to sustain the market growth.

Increasing investments in infrastructure projects and rising demand for high performance composites in developing economies are anticipated to drive market expansion over the forecasted period.

Historical CAGR from 2019 to 2023 12.7%
Forecast CAGR from 2024 to 2034 10.3%
Nikhil Kaitwade
Nikhil Kaitwade

Principal Consultant

Talk to Analyst

Find your sweet spots for generating winning opportunities in this market.

High Performance Composites Market Drivers

  • Resistance to corrosion, chemicals, and extreme temperatures.
  • Versatility and flexibility in design and manufacturing processes.
  • Growing demand for sustainable and eco-friendly materials.
  • Expanding applications in construction, wind energy, and sporting goods industries.
  • Versatility and flexibility in design and manufacturing processes.
  • Growing demand for sustainable and eco-friendly materials.
  • Expanding applications in construction, wind energy, and sporting goods industries.

High Performance Composites Market Challenges

  • High initial costs of materials and manufacturing processes.
  • Complexity of manufacturing and processing high performance composites.
  • Limited recycling and disposal options, leading to environmental concerns.
  • Potential for delamination, defects, and quality control issues.
  • Regulatory compliance and standards adherence in various industries.

Get the data you need at a Fraction of the cost

Personalize your report by choosing insights you need
and save 40%!

Comparative View of Adjacent Markets

Future Market Insights has compared three markets, namely the composite tooling market and the resin capsule market are below. Composite materials, such as carbon fiber reinforced polymers (CFRP), offer advantages over traditional metallic tooling materials, including reduced weight, improved dimensional stability, and enhanced durability.

With increasing urbanization, infrastructure development, and mining activities worldwide, there is a growing demand for resin capsules to ensure the safety, durability, and integrity of various construction and mining applications.

High Performance Composites Market:

Attributes High Performance Composites Market
CAGR from 2024 to 2034 10.3%
Key Trends Growing demand for sustainable and eco-friendly Composites solutions.
Growth Factor Investment in research and development to enhance performance and reduce costs.

Composite Tooling Market:

Attributes Composite Tooling Market
CAGR from 2023 to 2033 4.9%
Key Trends Rising demand for high-precision and durable tooling solutions.
Growth Factor Advancements in additive manufacturing and 3D printing technologies.

Resin Capsule Market:

Attributes Resin Capsule Market
CAGR from 2024 to 2034 5.2%
Key Trends Increasing use of resin capsules in construction, mining, and infrastructure projects.
Growth Factor Need for reliable and cost-effective anchoring solutions in challenging environments.

Country-wise Analysis

The provided table illustrates the top five countries in terms of revenue, with China leading the list.

China leads the high performance composites market with its robust manufacturing infrastructure and capabilities, allowing for large-scale production of composite materials at competitive prices.

The focus on innovation, investment in research and development, and growing demand across various industries contribute to its leadership in the global high performance composites market.

Countries Forecast CAGRs from 2024 to 2034
The United States 10.6%
South Korea 10.8%
Japan 11%
China 11.1%
The United Kingdom 10.9%

Aerospace and Automotive Innovation to Generate Demand in the United States

The United States, being a global leader in aerospace and automotive industries, extensively uses high performance composites to reduce the weight of aircraft, spacecraft, and vehicles. This enables enhanced fuel efficiency, lower emissions, and improved overall performance, driving the demand for composites in the country.
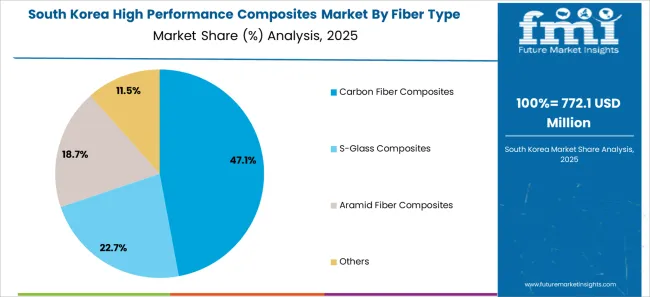
Advanced Electronics and Automotive Sectors Raise the Market in South Korea

The advanced electronics and automotive sectors rely on high performance composites to develop lightweight components for consumer electronics, electric vehicles, and mobile devices. Using composites helps companies stay competitive by offering innovative and technologically advanced products to global markets.
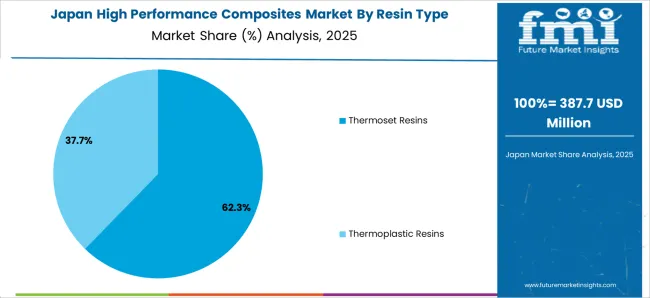
Automotive Manufacturing and Aerospace Excellence Boosts the Market Growth in Japan

In Japan, high performance composites are widely utilized in automotive manufacturing to produce lightweight and fuel-efficient vehicles.

The strong presence in the aerospace and robotics industries further drives the demand for composites, as they offer superior strength-to-weight ratios and design flexibility.

Automotive Industry Growth and Infrastructure Development Impresses the Market in China

The booming automotive industry is a major driver for adopting high performance composites as manufacturers seek to meet stringent fuel efficiency standards and consumer demands for lightweight vehicles.

The focus on infrastructure development and renewable energy projects further fuels the demand for composites in construction, wind energy, and other sectors.

Aerospace Advancements and Sustainable Infrastructure Booms the United Kingdom Market

The aerospace and automotive sectors are key users of high performance composites, leveraging their lightweight and durable properties to enhance aircraft and vehicle performance.

The investments in renewable energy and sustainable infrastructure projects drive the demand for composites in wind turbines, marine applications, and construction materials.

Category-wise Insights

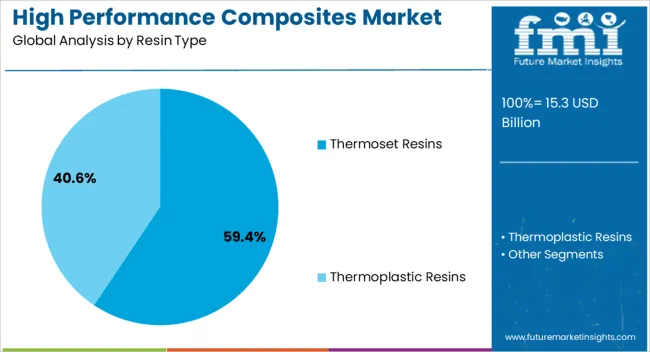
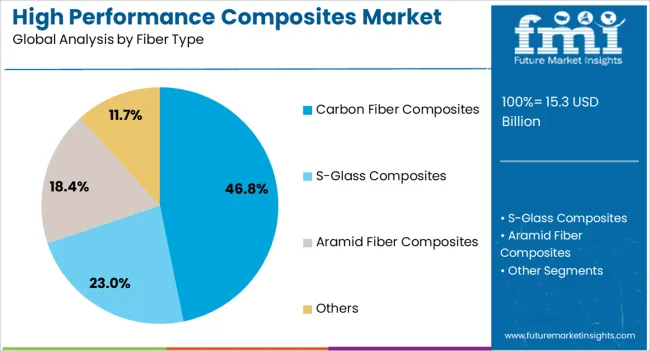
The below section shows the leading segment. Based on resin type, the thermoset resins segment registers at 10.2% CAGR by 2034. Based on fiber type, the carbon fiber composites segment is anticipated to expand at 10.1% CAGR by 2034.

Thermoset resins, such as epoxy and polyester, offer excellent properties like high strength, durability, and resistance to heat and chemicals. Carbon fiber composites are renowned for their exceptional strength-to-weight ratio, stiffness, and corrosion resistance.

Category CAGR from 2024 to 2034
Thermoset Resins 10.2%
Carbon Fiber Composites 10.1%

Thermoset Resins Segment to Hold a Significant Share in the Market

The thermoset resins segment is projected to achieve a CAGR of 10.2% by 2034, driven by several factors. Thermoset resins, such as epoxy and polyester, offer excellent properties such as high strength, durability, and resistance to heat and chemicals, making them suitable for various applications in aerospace, automotive, and construction industries.

The increasing demand for lightweight and high performance materials and advancements in manufacturing processes contribute to the growth of thermoset resins in the Composites market.

Carbon Fiber Composites Segment to Hold a Dominant Share in the Market

The carbon fiber composite segment is expected to witness a CAGR of 10.1% by 2034. Carbon fiber composites are renowned for their exceptional strength-to-weight ratio, stiffness, and corrosion resistance, making them ideal for applications requiring lightweight and high performance materials.

Industries such as aerospace, automotive, sports and leisure, and wind energy extensively use carbon fiber composites for structural components, body panels, and sporting goods.

The increasing adoption of carbon fiber composites in emerging sectors, along with ongoing research and development efforts to enhance their properties and reduce manufacturing costs, further drive the growth of this segment in the Composites market.

Competitive Landscape

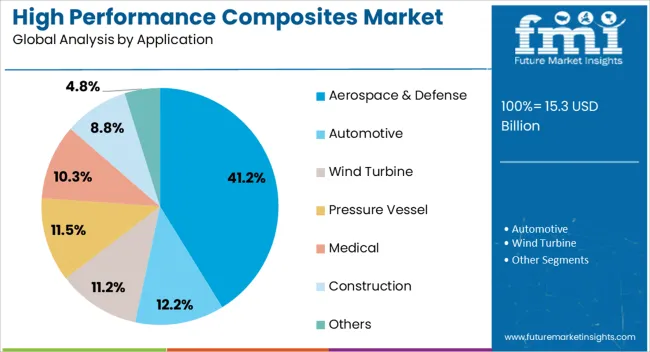
The landscape of the high performance composites market is characterized by a competitive environment with key players where the companies offer a wide range of high performance Composites materials and solutions tailored to various industries such as aerospace, automotive, sports, and leisure.

Numerous smaller players and niche providers specialize in specific composite formulations and applications, contributing to the diverse and dynamic nature of the market. Competition is driven by factors such as product innovation, technological advancements, and customer service. Some of the key developments are:

  • In December 2021, MBCC Group completed the acquisition of the Nautec Group, a prominent manufacturer specializing in ultra-high performance concrete and cement composites. This strategic move allowed MBCC Group to expand its portfolio and offer effective repair, marine, and wind turbine application solutions, enhancing customer satisfaction and market competitiveness.
  • In November 2021, Hexcel Corporation partnered with Fairmat to establish recycled carbon fiber prepreg Composites capability within Hexcel's European operations. This collaboration aimed to leverage recycled carbon fiber materials to produce composite panels, emphasizing sustainability and circular economy principles in manufacturing.

Key Coverage of High performance Composites Market Report

  • Adjacent Study on High performance Composites Market,
  • High performance Composites Market Size, Current Insights, and Demographic Trends
  • Opportunities of High performance Composites Market
  • Reasons for Expanding High performance Composites Market
  • United States High performance Composites Market

Report Scope

Attributes Details
Estimated Market Size in 2024 US$ 13.9 billion
Projected Market Valuation in 2034 US$ 36.8 billion
Value-based CAGR 2024 to 2034 10.3%
Forecast Period 2024 to 2034
Historical Data Available for 2019 to 2023
Market Analysis Value in US$ billion
Key Regions Covered
  • North America
  • Latin America
  • Western Europe
  • Eastern Europe
  • South Asia and Pacific
  • East Asia
  • Middle East and Africa
Key Market Segments Covered
  • Resin Type
  • Fiber Type
  • Application
  • Region
Key Countries Profiled
  • The United States
  • Canada
  • Brazil
  • Mexico
  • Germany
  • The United Kingdom
  • France
  • Spain
  • Italy
  • Russia
  • Poland
  • Czech Republic
  • Romania
  • India
  • Bangladesh
  • Australia
  • New Zealand
  • China
  • Japan
  • South Korea
  • GCC countries
  • South Africa
  • Israel
Key Companies Profiled
  • Toray Industries Inc.
  • Solvay S.A.
  • Hexcel Corporation
  • SGL Group-The Carbon Company
  • TPI Composites
  • Koninklijke TenCate NV
  • Owens Corning Corporation
  • BASF SE
  • Teijin Limited
  • Albany International Corporation

High performance Composites Market - Key Segments

By Resin Type:

  • Thermoset Resins
  • Thermoplastic Resins

By Fiber Type:

  • Carbon Fiber Composites
  • S-glass Composites
  • Aramid Fiber Composites
  • Others

By Application:

  • Aerospace & Defense
  • Automotive
  • Wind Turbine
  • Pressure Vessel
  • Medical
  • Construction
  • Others

By Region:

  • North America
  • Latin America
  • Western Europe
  • Eastern Europe
  • South Asia and Pacific
  • East Asia
  • The Middle East and Africa

Frequently Asked Questions

What is the expected worth of the high performance composites market in 2024?

As of 2024, the market for high performance composites is expected to be valued at US$ 13.9 billion.

What is the anticipated market value for the high performance composites in 2034?

By 2034, the market value of the high performance composites is expected to reach US$ 36.8 billion.

What is the projected forecast CAGR for the high performance composites market from 2024 to 2034?

From 2024 to 2034, the high performance composites market is expected to flourish at a CAGR of 10.3%.

Based on resin type, which segment dominates the high performance composites market?

The thermoset resins segment is expected to expand at 10.2% CAGR by 2034.

Which country is likely to dominate the high performance composites market?

China is likely the top-performing market, with a CAGR of 11.1%.

Table of Content

1. Executive Summary

    1.1. Global Market Outlook

    1.2. Demand-side Trends

    1.3. Supply-side Trends

    1.4. Technology Roadmap Analysis

    1.5. Analysis and Recommendations

2. Market Overview

    2.1. Market Coverage / Taxonomy

    2.2. Market Definition / Scope / Limitations

3. Market Background

    3.1. Market Dynamics

        3.1.1. Drivers

        3.1.2. Restraints

        3.1.3. Opportunity

        3.1.4. Trends

    3.2. Scenario Forecast

        3.2.1. Demand in Optimistic Scenario

        3.2.2. Demand in Likely Scenario

        3.2.3. Demand in Conservative Scenario

    3.3. Opportunity Map Analysis

    3.4. Product Life Cycle Analysis

    3.5. Supply Chain Analysis

        3.5.1. Supply Side Participants and their Roles

            3.5.1.1. Producers

            3.5.1.2. Mid-Level Participants (Traders/ Agents/ Brokers)

            3.5.1.3. Wholesalers and Distributors

        3.5.2. Value Added and Value Created at Node in the Supply Chain

        3.5.3. List of Raw Material Suppliers

        3.5.4. List of Existing and Potential Buyer’s

    3.6. Investment Feasibility Matrix

    3.7. Value Chain Analysis

        3.7.1. Profit Margin Analysis

        3.7.2. Wholesalers and Distributors

        3.7.3. Retailers

    3.8. PESTLE and Porter’s Analysis

    3.9. Regulatory Landscape

        3.9.1. By Key Regions

        3.9.2. By Key Countries

    3.10. Regional Parent Market Outlook

    3.11. Production and Consumption Statistics

    3.12. Import and Export Statistics

4. Global Market Analysis 2019 to 2023 and Forecast, 2024 to 2034

    4.1. Historical Market Size Value (US$ Million) & Volume (Tons) Analysis, 2019 to 2023

    4.2. Current and Future Market Size Value (US$ Million) & Volume (Tons) Projections, 2024 to 2034

        4.2.1. Y-o-Y Growth Trend Analysis

        4.2.2. Absolute $ Opportunity Analysis

5. Global Market Analysis 2019 to 2023 and Forecast 2024 to 2034, By Resin Type

    5.1. Introduction / Key Findings

    5.2. Historical Market Size Value (US$ Million) & Volume (Tons) Analysis By Resin Type, 2019 to 2023

    5.3. Current and Future Market Size Value (US$ Million) & Volume (Tons) Analysis and Forecast By Resin Type, 2024 to 2034

        5.3.1. Thermoset Resins

        5.3.2. Thermoplastic Resins

    5.4. Y-o-Y Growth Trend Analysis By Resin Type, 2019 to 2023

    5.5. Absolute $ Opportunity Analysis By Resin Type, 2024 to 2034

6. Global Market Analysis 2019 to 2023 and Forecast 2024 to 2034, By Fiber Type

    6.1. Introduction / Key Findings

    6.2. Historical Market Size Value (US$ Million) & Volume (Tons) Analysis By Fiber Type, 2019 to 2023

    6.3. Current and Future Market Size Value (US$ Million) & Volume (Tons) Analysis and Forecast By Fiber Type, 2024 to 2034

        6.3.1. Carbon Fiber Composites

        6.3.2. S-glass Composites

        6.3.3. Aramid Fiber Composites

        6.3.4. Others

    6.4. Y-o-Y Growth Trend Analysis By Fiber Type, 2019 to 2023

    6.5. Absolute $ Opportunity Analysis By Fiber Type, 2024 to 2034

7. Global Market Analysis 2019 to 2023 and Forecast 2024 to 2034, By Application

    7.1. Introduction / Key Findings

    7.2. Historical Market Size Value (US$ Million) & Volume (Tons) Analysis By Application, 2019 to 2023

    7.3. Current and Future Market Size Value (US$ Million) & Volume (Tons) Analysis and Forecast By Application, 2024 to 2034

        7.3.1. Aerospace & Defense

        7.3.2. Automotive

        7.3.3. Wind Turbine

        7.3.4. Pressure Vessel

        7.3.5. Medical

        7.3.6. Construction

        7.3.7. Others

    7.4. Y-o-Y Growth Trend Analysis By Application, 2019 to 2023

    7.5. Absolute $ Opportunity Analysis By Application, 2024 to 2034

8. Global Market Analysis 2019 to 2023 and Forecast 2024 to 2034, By Region

    8.1. Introduction

    8.2. Historical Market Size Value (US$ Million) & Volume (Tons) Analysis By Region, 2019 to 2023

    8.3. Current Market Size Value (US$ Million) & Volume (Tons) Analysis and Forecast By Region, 2024 to 2034

        8.3.1. North America

        8.3.2. Latin America

        8.3.3. Western Europe

        8.3.4. Eastern Europe

        8.3.5. South Asia and Pacific

        8.3.6. East Asia

        8.3.7. Middle East and Africa

    8.4. Market Attractiveness Analysis By Region

9. North America Market Analysis 2019 to 2023 and Forecast 2024 to 2034, By Country

    9.1. Historical Market Size Value (US$ Million) & Volume (Tons) Trend Analysis By Market Taxonomy, 2019 to 2023

    9.2. Market Size Value (US$ Million) & Volume (Tons) Forecast By Market Taxonomy, 2024 to 2034

        9.2.1. By Country

            9.2.1.1. USA

            9.2.1.2. Canada

        9.2.2. By Resin Type

        9.2.3. By Fiber Type

        9.2.4. By Application

    9.3. Market Attractiveness Analysis

        9.3.1. By Country

        9.3.2. By Resin Type

        9.3.3. By Fiber Type

        9.3.4. By Application

    9.4. Key Takeaways

10. Latin America Market Analysis 2019 to 2023 and Forecast 2024 to 2034, By Country

    10.1. Historical Market Size Value (US$ Million) & Volume (Tons) Trend Analysis By Market Taxonomy, 2019 to 2023

    10.2. Market Size Value (US$ Million) & Volume (Tons) Forecast By Market Taxonomy, 2024 to 2034

        10.2.1. By Country

            10.2.1.1. Brazil

            10.2.1.2. Mexico

            10.2.1.3. Rest of Latin America

        10.2.2. By Resin Type

        10.2.3. By Fiber Type

        10.2.4. By Application

    10.3. Market Attractiveness Analysis

        10.3.1. By Country

        10.3.2. By Resin Type

        10.3.3. By Fiber Type

        10.3.4. By Application

    10.4. Key Takeaways

11. Western Europe Market Analysis 2019 to 2023 and Forecast 2024 to 2034, By Country

    11.1. Historical Market Size Value (US$ Million) & Volume (Tons) Trend Analysis By Market Taxonomy, 2019 to 2023

    11.2. Market Size Value (US$ Million) & Volume (Tons) Forecast By Market Taxonomy, 2024 to 2034

        11.2.1. By Country

            11.2.1.1. Germany

            11.2.1.2. UK

            11.2.1.3. France

            11.2.1.4. Spain

            11.2.1.5. Italy

            11.2.1.6. Rest of Western Europe

        11.2.2. By Resin Type

        11.2.3. By Fiber Type

        11.2.4. By Application

    11.3. Market Attractiveness Analysis

        11.3.1. By Country

        11.3.2. By Resin Type

        11.3.3. By Fiber Type

        11.3.4. By Application

    11.4. Key Takeaways

12. Eastern Europe Market Analysis 2019 to 2023 and Forecast 2024 to 2034, By Country

    12.1. Historical Market Size Value (US$ Million) & Volume (Tons) Trend Analysis By Market Taxonomy, 2019 to 2023

    12.2. Market Size Value (US$ Million) & Volume (Tons) Forecast By Market Taxonomy, 2024 to 2034

        12.2.1. By Country

            12.2.1.1. Poland

            12.2.1.2. Russia

            12.2.1.3. Czech Republic

            12.2.1.4. Romania

            12.2.1.5. Rest of Eastern Europe

        12.2.2. By Resin Type

        12.2.3. By Fiber Type

        12.2.4. By Application

    12.3. Market Attractiveness Analysis

        12.3.1. By Country

        12.3.2. By Resin Type

        12.3.3. By Fiber Type

        12.3.4. By Application

    12.4. Key Takeaways

13. South Asia and Pacific Market Analysis 2019 to 2023 and Forecast 2024 to 2034, By Country

    13.1. Historical Market Size Value (US$ Million) & Volume (Tons) Trend Analysis By Market Taxonomy, 2019 to 2023

    13.2. Market Size Value (US$ Million) & Volume (Tons) Forecast By Market Taxonomy, 2024 to 2034

        13.2.1. By Country

            13.2.1.1. India

            13.2.1.2. Bangladesh

            13.2.1.3. Australia

            13.2.1.4. New Zealand

            13.2.1.5. Rest of South Asia and Pacific

        13.2.2. By Resin Type

        13.2.3. By Fiber Type

        13.2.4. By Application

    13.3. Market Attractiveness Analysis

        13.3.1. By Country

        13.3.2. By Resin Type

        13.3.3. By Fiber Type

        13.3.4. By Application

    13.4. Key Takeaways

14. East Asia Market Analysis 2019 to 2023 and Forecast 2024 to 2034, By Country

    14.1. Historical Market Size Value (US$ Million) & Volume (Tons) Trend Analysis By Market Taxonomy, 2019 to 2023

    14.2. Market Size Value (US$ Million) & Volume (Tons) Forecast By Market Taxonomy, 2024 to 2034

        14.2.1. By Country

            14.2.1.1. China

            14.2.1.2. Japan

            14.2.1.3. South Korea

        14.2.2. By Resin Type

        14.2.3. By Fiber Type

        14.2.4. By Application

    14.3. Market Attractiveness Analysis

        14.3.1. By Country

        14.3.2. By Resin Type

        14.3.3. By Fiber Type

        14.3.4. By Application

    14.4. Key Takeaways

15. Middle East and Africa Market Analysis 2019 to 2023 and Forecast 2024 to 2034, By Country

    15.1. Historical Market Size Value (US$ Million) & Volume (Tons) Trend Analysis By Market Taxonomy, 2019 to 2023

    15.2. Market Size Value (US$ Million) & Volume (Tons) Forecast By Market Taxonomy, 2024 to 2034

        15.2.1. By Country

            15.2.1.1. GCC Countries

            15.2.1.2. South Africa

            15.2.1.3. Israel

            15.2.1.4. Rest of MEA

        15.2.2. By Resin Type

        15.2.3. By Fiber Type

        15.2.4. By Application

    15.3. Market Attractiveness Analysis

        15.3.1. By Country

        15.3.2. By Resin Type

        15.3.3. By Fiber Type

        15.3.4. By Application

    15.4. Key Takeaways

16. Key Countries Market Analysis

    16.1. USA

        16.1.1. Pricing Analysis

        16.1.2. Market Share Analysis, 2023

            16.1.2.1. By Resin Type

            16.1.2.2. By Fiber Type

            16.1.2.3. By Application

    16.2. Canada

        16.2.1. Pricing Analysis

        16.2.2. Market Share Analysis, 2023

            16.2.2.1. By Resin Type

            16.2.2.2. By Fiber Type

            16.2.2.3. By Application

    16.3. Brazil

        16.3.1. Pricing Analysis

        16.3.2. Market Share Analysis, 2023

            16.3.2.1. By Resin Type

            16.3.2.2. By Fiber Type

            16.3.2.3. By Application

    16.4. Mexico

        16.4.1. Pricing Analysis

        16.4.2. Market Share Analysis, 2023

            16.4.2.1. By Resin Type

            16.4.2.2. By Fiber Type

            16.4.2.3. By Application

    16.5. Germany

        16.5.1. Pricing Analysis

        16.5.2. Market Share Analysis, 2023

            16.5.2.1. By Resin Type

            16.5.2.2. By Fiber Type

            16.5.2.3. By Application

    16.6. UK

        16.6.1. Pricing Analysis

        16.6.2. Market Share Analysis, 2023

            16.6.2.1. By Resin Type

            16.6.2.2. By Fiber Type

            16.6.2.3. By Application

    16.7. France

        16.7.1. Pricing Analysis

        16.7.2. Market Share Analysis, 2023

            16.7.2.1. By Resin Type

            16.7.2.2. By Fiber Type

            16.7.2.3. By Application

    16.8. Spain

        16.8.1. Pricing Analysis

        16.8.2. Market Share Analysis, 2023

            16.8.2.1. By Resin Type

            16.8.2.2. By Fiber Type

            16.8.2.3. By Application

    16.9. Italy

        16.9.1. Pricing Analysis

        16.9.2. Market Share Analysis, 2023

            16.9.2.1. By Resin Type

            16.9.2.2. By Fiber Type

            16.9.2.3. By Application

    16.10. Poland

        16.10.1. Pricing Analysis

        16.10.2. Market Share Analysis, 2023

            16.10.2.1. By Resin Type

            16.10.2.2. By Fiber Type

            16.10.2.3. By Application

    16.11. Russia

        16.11.1. Pricing Analysis

        16.11.2. Market Share Analysis, 2023

            16.11.2.1. By Resin Type

            16.11.2.2. By Fiber Type

            16.11.2.3. By Application

    16.12. Czech Republic

        16.12.1. Pricing Analysis

        16.12.2. Market Share Analysis, 2023

            16.12.2.1. By Resin Type

            16.12.2.2. By Fiber Type

            16.12.2.3. By Application

    16.13. Romania

        16.13.1. Pricing Analysis

        16.13.2. Market Share Analysis, 2023

            16.13.2.1. By Resin Type

            16.13.2.2. By Fiber Type

            16.13.2.3. By Application

    16.14. India

        16.14.1. Pricing Analysis

        16.14.2. Market Share Analysis, 2023

            16.14.2.1. By Resin Type

            16.14.2.2. By Fiber Type

            16.14.2.3. By Application

    16.15. Bangladesh

        16.15.1. Pricing Analysis

        16.15.2. Market Share Analysis, 2023

            16.15.2.1. By Resin Type

            16.15.2.2. By Fiber Type

            16.15.2.3. By Application

    16.16. Australia

        16.16.1. Pricing Analysis

        16.16.2. Market Share Analysis, 2023

            16.16.2.1. By Resin Type

            16.16.2.2. By Fiber Type

            16.16.2.3. By Application

    16.17. New Zealand

        16.17.1. Pricing Analysis

        16.17.2. Market Share Analysis, 2023

            16.17.2.1. By Resin Type

            16.17.2.2. By Fiber Type

            16.17.2.3. By Application

    16.18. China

        16.18.1. Pricing Analysis

        16.18.2. Market Share Analysis, 2023

            16.18.2.1. By Resin Type

            16.18.2.2. By Fiber Type

            16.18.2.3. By Application

    16.19. Japan

        16.19.1. Pricing Analysis

        16.19.2. Market Share Analysis, 2023

            16.19.2.1. By Resin Type

            16.19.2.2. By Fiber Type

            16.19.2.3. By Application

    16.20. South Korea

        16.20.1. Pricing Analysis

        16.20.2. Market Share Analysis, 2023

            16.20.2.1. By Resin Type

            16.20.2.2. By Fiber Type

            16.20.2.3. By Application

    16.21. GCC Countries

        16.21.1. Pricing Analysis

        16.21.2. Market Share Analysis, 2023

            16.21.2.1. By Resin Type

            16.21.2.2. By Fiber Type

            16.21.2.3. By Application

    16.22. South Africa

        16.22.1. Pricing Analysis

        16.22.2. Market Share Analysis, 2023

            16.22.2.1. By Resin Type

            16.22.2.2. By Fiber Type

            16.22.2.3. By Application

    16.23. Israel

        16.23.1. Pricing Analysis

        16.23.2. Market Share Analysis, 2023

            16.23.2.1. By Resin Type

            16.23.2.2. By Fiber Type

            16.23.2.3. By Application

17. Market Structure Analysis

    17.1. Competition Dashboard

    17.2. Competition Benchmarking

    17.3. Market Share Analysis of Top Players

        17.3.1. By Regional

        17.3.2. By Resin Type

        17.3.3. By Fiber Type

        17.3.4. By Application

18. Competition Analysis

    18.1. Competition Deep Dive

        18.1.1. Toray Industries Inc.

            18.1.1.1. Overview

            18.1.1.2. Product Portfolio

            18.1.1.3. Profitability by Market Segments

            18.1.1.4. Sales Footprint

            18.1.1.5. Strategy Overview

                18.1.1.5.1. Marketing Strategy

                18.1.1.5.2. Product Strategy

                18.1.1.5.3. Channel Strategy

        18.1.2. Solvay S.A.

            18.1.2.1. Overview

            18.1.2.2. Product Portfolio

            18.1.2.3. Profitability by Market Segments

            18.1.2.4. Sales Footprint

            18.1.2.5. Strategy Overview

                18.1.2.5.1. Marketing Strategy

                18.1.2.5.2. Product Strategy

                18.1.2.5.3. Channel Strategy

        18.1.3. Hexcel Corporation

            18.1.3.1. Overview

            18.1.3.2. Product Portfolio

            18.1.3.3. Profitability by Market Segments

            18.1.3.4. Sales Footprint

            18.1.3.5. Strategy Overview

                18.1.3.5.1. Marketing Strategy

                18.1.3.5.2. Product Strategy

                18.1.3.5.3. Channel Strategy

        18.1.4. SGL Group-The Carbon Company

            18.1.4.1. Overview

            18.1.4.2. Product Portfolio

            18.1.4.3. Profitability by Market Segments

            18.1.4.4. Sales Footprint

            18.1.4.5. Strategy Overview

                18.1.4.5.1. Marketing Strategy

                18.1.4.5.2. Product Strategy

                18.1.4.5.3. Channel Strategy

        18.1.5. TPI Composites

            18.1.5.1. Overview

            18.1.5.2. Product Portfolio

            18.1.5.3. Profitability by Market Segments

            18.1.5.4. Sales Footprint

            18.1.5.5. Strategy Overview

                18.1.5.5.1. Marketing Strategy

                18.1.5.5.2. Product Strategy

                18.1.5.5.3. Channel Strategy

        18.1.6. Koninklijke TenCate NV

            18.1.6.1. Overview

            18.1.6.2. Product Portfolio

            18.1.6.3. Profitability by Market Segments

            18.1.6.4. Sales Footprint

            18.1.6.5. Strategy Overview

                18.1.6.5.1. Marketing Strategy

                18.1.6.5.2. Product Strategy

                18.1.6.5.3. Channel Strategy

        18.1.7. Owens Corning Corporation

            18.1.7.1. Overview

            18.1.7.2. Product Portfolio

            18.1.7.3. Profitability by Market Segments

            18.1.7.4. Sales Footprint

            18.1.7.5. Strategy Overview

                18.1.7.5.1. Marketing Strategy

                18.1.7.5.2. Product Strategy

                18.1.7.5.3. Channel Strategy

        18.1.8. BASF SE

            18.1.8.1. Overview

            18.1.8.2. Product Portfolio

            18.1.8.3. Profitability by Market Segments

            18.1.8.4. Sales Footprint

            18.1.8.5. Strategy Overview

                18.1.8.5.1. Marketing Strategy

                18.1.8.5.2. Product Strategy

                18.1.8.5.3. Channel Strategy

        18.1.9. Teijin Limited

            18.1.9.1. Overview

            18.1.9.2. Product Portfolio

            18.1.9.3. Profitability by Market Segments

            18.1.9.4. Sales Footprint

            18.1.9.5. Strategy Overview

                18.1.9.5.1. Marketing Strategy

                18.1.9.5.2. Product Strategy

                18.1.9.5.3. Channel Strategy

        18.1.10. Albany International Corporation

            18.1.10.1. Overview

            18.1.10.2. Product Portfolio

            18.1.10.3. Profitability by Market Segments

            18.1.10.4. Sales Footprint

            18.1.10.5. Strategy Overview

                18.1.10.5.1. Marketing Strategy

                18.1.10.5.2. Product Strategy

                18.1.10.5.3. Channel Strategy

19. Assumptions & Acronyms Used

20. Research Methodology

List of Tables

Table 1: Global Market Value (US$ Million) Forecast by Region, 2019 to 2034

Table 2: Global Market Volume (Tons) Forecast by Region, 2019 to 2034

Table 3: Global Market Value (US$ Million) Forecast by Resin Type, 2019 to 2034

Table 4: Global Market Volume (Tons) Forecast by Resin Type, 2019 to 2034

Table 5: Global Market Value (US$ Million) Forecast by Fiber Type, 2019 to 2034

Table 6: Global Market Volume (Tons) Forecast by Fiber Type, 2019 to 2034

Table 7: Global Market Value (US$ Million) Forecast by Application, 2019 to 2034

Table 8: Global Market Volume (Tons) Forecast by Application, 2019 to 2034

Table 9: North America Market Value (US$ Million) Forecast by Country, 2019 to 2034

Table 10: North America Market Volume (Tons) Forecast by Country, 2019 to 2034

Table 11: North America Market Value (US$ Million) Forecast by Resin Type, 2019 to 2034

Table 12: North America Market Volume (Tons) Forecast by Resin Type, 2019 to 2034

Table 13: North America Market Value (US$ Million) Forecast by Fiber Type, 2019 to 2034

Table 14: North America Market Volume (Tons) Forecast by Fiber Type, 2019 to 2034

Table 15: North America Market Value (US$ Million) Forecast by Application, 2019 to 2034

Table 16: North America Market Volume (Tons) Forecast by Application, 2019 to 2034

Table 17: Latin America Market Value (US$ Million) Forecast by Country, 2019 to 2034

Table 18: Latin America Market Volume (Tons) Forecast by Country, 2019 to 2034

Table 19: Latin America Market Value (US$ Million) Forecast by Resin Type, 2019 to 2034

Table 20: Latin America Market Volume (Tons) Forecast by Resin Type, 2019 to 2034

Table 21: Latin America Market Value (US$ Million) Forecast by Fiber Type, 2019 to 2034

Table 22: Latin America Market Volume (Tons) Forecast by Fiber Type, 2019 to 2034

Table 23: Latin America Market Value (US$ Million) Forecast by Application, 2019 to 2034

Table 24: Latin America Market Volume (Tons) Forecast by Application, 2019 to 2034

Table 25: Western Europe Market Value (US$ Million) Forecast by Country, 2019 to 2034

Table 26: Western Europe Market Volume (Tons) Forecast by Country, 2019 to 2034

Table 27: Western Europe Market Value (US$ Million) Forecast by Resin Type, 2019 to 2034

Table 28: Western Europe Market Volume (Tons) Forecast by Resin Type, 2019 to 2034

Table 29: Western Europe Market Value (US$ Million) Forecast by Fiber Type, 2019 to 2034

Table 30: Western Europe Market Volume (Tons) Forecast by Fiber Type, 2019 to 2034

Table 31: Western Europe Market Value (US$ Million) Forecast by Application, 2019 to 2034

Table 32: Western Europe Market Volume (Tons) Forecast by Application, 2019 to 2034

Table 33: Eastern Europe Market Value (US$ Million) Forecast by Country, 2019 to 2034

Table 34: Eastern Europe Market Volume (Tons) Forecast by Country, 2019 to 2034

Table 35: Eastern Europe Market Value (US$ Million) Forecast by Resin Type, 2019 to 2034

Table 36: Eastern Europe Market Volume (Tons) Forecast by Resin Type, 2019 to 2034

Table 37: Eastern Europe Market Value (US$ Million) Forecast by Fiber Type, 2019 to 2034

Table 38: Eastern Europe Market Volume (Tons) Forecast by Fiber Type, 2019 to 2034

Table 39: Eastern Europe Market Value (US$ Million) Forecast by Application, 2019 to 2034

Table 40: Eastern Europe Market Volume (Tons) Forecast by Application, 2019 to 2034

Table 41: South Asia and Pacific Market Value (US$ Million) Forecast by Country, 2019 to 2034

Table 42: South Asia and Pacific Market Volume (Tons) Forecast by Country, 2019 to 2034

Table 43: South Asia and Pacific Market Value (US$ Million) Forecast by Resin Type, 2019 to 2034

Table 44: South Asia and Pacific Market Volume (Tons) Forecast by Resin Type, 2019 to 2034

Table 45: South Asia and Pacific Market Value (US$ Million) Forecast by Fiber Type, 2019 to 2034

Table 46: South Asia and Pacific Market Volume (Tons) Forecast by Fiber Type, 2019 to 2034

Table 47: South Asia and Pacific Market Value (US$ Million) Forecast by Application, 2019 to 2034

Table 48: South Asia and Pacific Market Volume (Tons) Forecast by Application, 2019 to 2034

Table 49: East Asia Market Value (US$ Million) Forecast by Country, 2019 to 2034

Table 50: East Asia Market Volume (Tons) Forecast by Country, 2019 to 2034

Table 51: East Asia Market Value (US$ Million) Forecast by Resin Type, 2019 to 2034

Table 52: East Asia Market Volume (Tons) Forecast by Resin Type, 2019 to 2034

Table 53: East Asia Market Value (US$ Million) Forecast by Fiber Type, 2019 to 2034

Table 54: East Asia Market Volume (Tons) Forecast by Fiber Type, 2019 to 2034

Table 55: East Asia Market Value (US$ Million) Forecast by Application, 2019 to 2034

Table 56: East Asia Market Volume (Tons) Forecast by Application, 2019 to 2034

Table 57: Middle East and Africa Market Value (US$ Million) Forecast by Country, 2019 to 2034

Table 58: Middle East and Africa Market Volume (Tons) Forecast by Country, 2019 to 2034

Table 59: Middle East and Africa Market Value (US$ Million) Forecast by Resin Type, 2019 to 2034

Table 60: Middle East and Africa Market Volume (Tons) Forecast by Resin Type, 2019 to 2034

Table 61: Middle East and Africa Market Value (US$ Million) Forecast by Fiber Type, 2019 to 2034

Table 62: Middle East and Africa Market Volume (Tons) Forecast by Fiber Type, 2019 to 2034

Table 63: Middle East and Africa Market Value (US$ Million) Forecast by Application, 2019 to 2034

Table 64: Middle East and Africa Market Volume (Tons) Forecast by Application, 2019 to 2034

List of Charts

Figure 1: Global Market Value (US$ Million) by Resin Type, 2024 to 2034

Figure 2: Global Market Value (US$ Million) by Fiber Type, 2024 to 2034

Figure 3: Global Market Value (US$ Million) by Application, 2024 to 2034

Figure 4: Global Market Value (US$ Million) by Region, 2024 to 2034

Figure 5: Global Market Value (US$ Million) Analysis by Region, 2019 to 2034

Figure 6: Global Market Volume (Tons) Analysis by Region, 2019 to 2034

Figure 7: Global Market Value Share (%) and BPS Analysis by Region, 2024 to 2034

Figure 8: Global Market Y-o-Y Growth (%) Projections by Region, 2024 to 2034

Figure 9: Global Market Value (US$ Million) Analysis by Resin Type, 2019 to 2034

Figure 10: Global Market Volume (Tons) Analysis by Resin Type, 2019 to 2034

Figure 11: Global Market Value Share (%) and BPS Analysis by Resin Type, 2024 to 2034

Figure 12: Global Market Y-o-Y Growth (%) Projections by Resin Type, 2024 to 2034

Figure 13: Global Market Value (US$ Million) Analysis by Fiber Type, 2019 to 2034

Figure 14: Global Market Volume (Tons) Analysis by Fiber Type, 2019 to 2034

Figure 15: Global Market Value Share (%) and BPS Analysis by Fiber Type, 2024 to 2034

Figure 16: Global Market Y-o-Y Growth (%) Projections by Fiber Type, 2024 to 2034

Figure 17: Global Market Value (US$ Million) Analysis by Application, 2019 to 2034

Figure 18: Global Market Volume (Tons) Analysis by Application, 2019 to 2034

Figure 19: Global Market Value Share (%) and BPS Analysis by Application, 2024 to 2034

Figure 20: Global Market Y-o-Y Growth (%) Projections by Application, 2024 to 2034

Figure 21: Global Market Attractiveness by Resin Type, 2024 to 2034

Figure 22: Global Market Attractiveness by Fiber Type, 2024 to 2034

Figure 23: Global Market Attractiveness by Application, 2024 to 2034

Figure 24: Global Market Attractiveness by Region, 2024 to 2034

Figure 25: North America Market Value (US$ Million) by Resin Type, 2024 to 2034

Figure 26: North America Market Value (US$ Million) by Fiber Type, 2024 to 2034

Figure 27: North America Market Value (US$ Million) by Application, 2024 to 2034

Figure 28: North America Market Value (US$ Million) by Country, 2024 to 2034

Figure 29: North America Market Value (US$ Million) Analysis by Country, 2019 to 2034

Figure 30: North America Market Volume (Tons) Analysis by Country, 2019 to 2034

Figure 31: North America Market Value Share (%) and BPS Analysis by Country, 2024 to 2034

Figure 32: North America Market Y-o-Y Growth (%) Projections by Country, 2024 to 2034

Figure 33: North America Market Value (US$ Million) Analysis by Resin Type, 2019 to 2034

Figure 34: North America Market Volume (Tons) Analysis by Resin Type, 2019 to 2034

Figure 35: North America Market Value Share (%) and BPS Analysis by Resin Type, 2024 to 2034

Figure 36: North America Market Y-o-Y Growth (%) Projections by Resin Type, 2024 to 2034

Figure 37: North America Market Value (US$ Million) Analysis by Fiber Type, 2019 to 2034

Figure 38: North America Market Volume (Tons) Analysis by Fiber Type, 2019 to 2034

Figure 39: North America Market Value Share (%) and BPS Analysis by Fiber Type, 2024 to 2034

Figure 40: North America Market Y-o-Y Growth (%) Projections by Fiber Type, 2024 to 2034

Figure 41: North America Market Value (US$ Million) Analysis by Application, 2019 to 2034

Figure 42: North America Market Volume (Tons) Analysis by Application, 2019 to 2034

Figure 43: North America Market Value Share (%) and BPS Analysis by Application, 2024 to 2034

Figure 44: North America Market Y-o-Y Growth (%) Projections by Application, 2024 to 2034

Figure 45: North America Market Attractiveness by Resin Type, 2024 to 2034

Figure 46: North America Market Attractiveness by Fiber Type, 2024 to 2034

Figure 47: North America Market Attractiveness by Application, 2024 to 2034

Figure 48: North America Market Attractiveness by Country, 2024 to 2034

Figure 49: Latin America Market Value (US$ Million) by Resin Type, 2024 to 2034

Figure 50: Latin America Market Value (US$ Million) by Fiber Type, 2024 to 2034

Figure 51: Latin America Market Value (US$ Million) by Application, 2024 to 2034

Figure 52: Latin America Market Value (US$ Million) by Country, 2024 to 2034

Figure 53: Latin America Market Value (US$ Million) Analysis by Country, 2019 to 2034

Figure 54: Latin America Market Volume (Tons) Analysis by Country, 2019 to 2034

Figure 55: Latin America Market Value Share (%) and BPS Analysis by Country, 2024 to 2034

Figure 56: Latin America Market Y-o-Y Growth (%) Projections by Country, 2024 to 2034

Figure 57: Latin America Market Value (US$ Million) Analysis by Resin Type, 2019 to 2034

Figure 58: Latin America Market Volume (Tons) Analysis by Resin Type, 2019 to 2034

Figure 59: Latin America Market Value Share (%) and BPS Analysis by Resin Type, 2024 to 2034

Figure 60: Latin America Market Y-o-Y Growth (%) Projections by Resin Type, 2024 to 2034

Figure 61: Latin America Market Value (US$ Million) Analysis by Fiber Type, 2019 to 2034

Figure 62: Latin America Market Volume (Tons) Analysis by Fiber Type, 2019 to 2034

Figure 63: Latin America Market Value Share (%) and BPS Analysis by Fiber Type, 2024 to 2034

Figure 64: Latin America Market Y-o-Y Growth (%) Projections by Fiber Type, 2024 to 2034

Figure 65: Latin America Market Value (US$ Million) Analysis by Application, 2019 to 2034

Figure 66: Latin America Market Volume (Tons) Analysis by Application, 2019 to 2034

Figure 67: Latin America Market Value Share (%) and BPS Analysis by Application, 2024 to 2034

Figure 68: Latin America Market Y-o-Y Growth (%) Projections by Application, 2024 to 2034

Figure 69: Latin America Market Attractiveness by Resin Type, 2024 to 2034

Figure 70: Latin America Market Attractiveness by Fiber Type, 2024 to 2034

Figure 71: Latin America Market Attractiveness by Application, 2024 to 2034

Figure 72: Latin America Market Attractiveness by Country, 2024 to 2034

Figure 73: Western Europe Market Value (US$ Million) by Resin Type, 2024 to 2034

Figure 74: Western Europe Market Value (US$ Million) by Fiber Type, 2024 to 2034

Figure 75: Western Europe Market Value (US$ Million) by Application, 2024 to 2034

Figure 76: Western Europe Market Value (US$ Million) by Country, 2024 to 2034

Figure 77: Western Europe Market Value (US$ Million) Analysis by Country, 2019 to 2034

Figure 78: Western Europe Market Volume (Tons) Analysis by Country, 2019 to 2034

Figure 79: Western Europe Market Value Share (%) and BPS Analysis by Country, 2024 to 2034

Figure 80: Western Europe Market Y-o-Y Growth (%) Projections by Country, 2024 to 2034

Figure 81: Western Europe Market Value (US$ Million) Analysis by Resin Type, 2019 to 2034

Figure 82: Western Europe Market Volume (Tons) Analysis by Resin Type, 2019 to 2034

Figure 83: Western Europe Market Value Share (%) and BPS Analysis by Resin Type, 2024 to 2034

Figure 84: Western Europe Market Y-o-Y Growth (%) Projections by Resin Type, 2024 to 2034

Figure 85: Western Europe Market Value (US$ Million) Analysis by Fiber Type, 2019 to 2034

Figure 86: Western Europe Market Volume (Tons) Analysis by Fiber Type, 2019 to 2034

Figure 87: Western Europe Market Value Share (%) and BPS Analysis by Fiber Type, 2024 to 2034

Figure 88: Western Europe Market Y-o-Y Growth (%) Projections by Fiber Type, 2024 to 2034

Figure 89: Western Europe Market Value (US$ Million) Analysis by Application, 2019 to 2034

Figure 90: Western Europe Market Volume (Tons) Analysis by Application, 2019 to 2034

Figure 91: Western Europe Market Value Share (%) and BPS Analysis by Application, 2024 to 2034

Figure 92: Western Europe Market Y-o-Y Growth (%) Projections by Application, 2024 to 2034

Figure 93: Western Europe Market Attractiveness by Resin Type, 2024 to 2034

Figure 94: Western Europe Market Attractiveness by Fiber Type, 2024 to 2034

Figure 95: Western Europe Market Attractiveness by Application, 2024 to 2034

Figure 96: Western Europe Market Attractiveness by Country, 2024 to 2034

Figure 97: Eastern Europe Market Value (US$ Million) by Resin Type, 2024 to 2034

Figure 98: Eastern Europe Market Value (US$ Million) by Fiber Type, 2024 to 2034

Figure 99: Eastern Europe Market Value (US$ Million) by Application, 2024 to 2034

Figure 100: Eastern Europe Market Value (US$ Million) by Country, 2024 to 2034

Figure 101: Eastern Europe Market Value (US$ Million) Analysis by Country, 2019 to 2034

Figure 102: Eastern Europe Market Volume (Tons) Analysis by Country, 2019 to 2034

Figure 103: Eastern Europe Market Value Share (%) and BPS Analysis by Country, 2024 to 2034

Figure 104: Eastern Europe Market Y-o-Y Growth (%) Projections by Country, 2024 to 2034

Figure 105: Eastern Europe Market Value (US$ Million) Analysis by Resin Type, 2019 to 2034

Figure 106: Eastern Europe Market Volume (Tons) Analysis by Resin Type, 2019 to 2034

Figure 107: Eastern Europe Market Value Share (%) and BPS Analysis by Resin Type, 2024 to 2034

Figure 108: Eastern Europe Market Y-o-Y Growth (%) Projections by Resin Type, 2024 to 2034

Figure 109: Eastern Europe Market Value (US$ Million) Analysis by Fiber Type, 2019 to 2034

Figure 110: Eastern Europe Market Volume (Tons) Analysis by Fiber Type, 2019 to 2034

Figure 111: Eastern Europe Market Value Share (%) and BPS Analysis by Fiber Type, 2024 to 2034

Figure 112: Eastern Europe Market Y-o-Y Growth (%) Projections by Fiber Type, 2024 to 2034

Figure 113: Eastern Europe Market Value (US$ Million) Analysis by Application, 2019 to 2034

Figure 114: Eastern Europe Market Volume (Tons) Analysis by Application, 2019 to 2034

Figure 115: Eastern Europe Market Value Share (%) and BPS Analysis by Application, 2024 to 2034

Figure 116: Eastern Europe Market Y-o-Y Growth (%) Projections by Application, 2024 to 2034

Figure 117: Eastern Europe Market Attractiveness by Resin Type, 2024 to 2034

Figure 118: Eastern Europe Market Attractiveness by Fiber Type, 2024 to 2034

Figure 119: Eastern Europe Market Attractiveness by Application, 2024 to 2034

Figure 120: Eastern Europe Market Attractiveness by Country, 2024 to 2034

Figure 121: South Asia and Pacific Market Value (US$ Million) by Resin Type, 2024 to 2034

Figure 122: South Asia and Pacific Market Value (US$ Million) by Fiber Type, 2024 to 2034

Figure 123: South Asia and Pacific Market Value (US$ Million) by Application, 2024 to 2034

Figure 124: South Asia and Pacific Market Value (US$ Million) by Country, 2024 to 2034

Figure 125: South Asia and Pacific Market Value (US$ Million) Analysis by Country, 2019 to 2034

Figure 126: South Asia and Pacific Market Volume (Tons) Analysis by Country, 2019 to 2034

Figure 127: South Asia and Pacific Market Value Share (%) and BPS Analysis by Country, 2024 to 2034

Figure 128: South Asia and Pacific Market Y-o-Y Growth (%) Projections by Country, 2024 to 2034

Figure 129: South Asia and Pacific Market Value (US$ Million) Analysis by Resin Type, 2019 to 2034

Figure 130: South Asia and Pacific Market Volume (Tons) Analysis by Resin Type, 2019 to 2034

Figure 131: South Asia and Pacific Market Value Share (%) and BPS Analysis by Resin Type, 2024 to 2034

Figure 132: South Asia and Pacific Market Y-o-Y Growth (%) Projections by Resin Type, 2024 to 2034

Figure 133: South Asia and Pacific Market Value (US$ Million) Analysis by Fiber Type, 2019 to 2034

Figure 134: South Asia and Pacific Market Volume (Tons) Analysis by Fiber Type, 2019 to 2034

Figure 135: South Asia and Pacific Market Value Share (%) and BPS Analysis by Fiber Type, 2024 to 2034

Figure 136: South Asia and Pacific Market Y-o-Y Growth (%) Projections by Fiber Type, 2024 to 2034

Figure 137: South Asia and Pacific Market Value (US$ Million) Analysis by Application, 2019 to 2034

Figure 138: South Asia and Pacific Market Volume (Tons) Analysis by Application, 2019 to 2034

Figure 139: South Asia and Pacific Market Value Share (%) and BPS Analysis by Application, 2024 to 2034

Figure 140: South Asia and Pacific Market Y-o-Y Growth (%) Projections by Application, 2024 to 2034

Figure 141: South Asia and Pacific Market Attractiveness by Resin Type, 2024 to 2034

Figure 142: South Asia and Pacific Market Attractiveness by Fiber Type, 2024 to 2034

Figure 143: South Asia and Pacific Market Attractiveness by Application, 2024 to 2034

Figure 144: South Asia and Pacific Market Attractiveness by Country, 2024 to 2034

Figure 145: East Asia Market Value (US$ Million) by Resin Type, 2024 to 2034

Figure 146: East Asia Market Value (US$ Million) by Fiber Type, 2024 to 2034

Figure 147: East Asia Market Value (US$ Million) by Application, 2024 to 2034

Figure 148: East Asia Market Value (US$ Million) by Country, 2024 to 2034

Figure 149: East Asia Market Value (US$ Million) Analysis by Country, 2019 to 2034

Figure 150: East Asia Market Volume (Tons) Analysis by Country, 2019 to 2034

Figure 151: East Asia Market Value Share (%) and BPS Analysis by Country, 2024 to 2034

Figure 152: East Asia Market Y-o-Y Growth (%) Projections by Country, 2024 to 2034

Figure 153: East Asia Market Value (US$ Million) Analysis by Resin Type, 2019 to 2034

Figure 154: East Asia Market Volume (Tons) Analysis by Resin Type, 2019 to 2034

Figure 155: East Asia Market Value Share (%) and BPS Analysis by Resin Type, 2024 to 2034

Figure 156: East Asia Market Y-o-Y Growth (%) Projections by Resin Type, 2024 to 2034

Figure 157: East Asia Market Value (US$ Million) Analysis by Fiber Type, 2019 to 2034

Figure 158: East Asia Market Volume (Tons) Analysis by Fiber Type, 2019 to 2034

Figure 159: East Asia Market Value Share (%) and BPS Analysis by Fiber Type, 2024 to 2034

Figure 160: East Asia Market Y-o-Y Growth (%) Projections by Fiber Type, 2024 to 2034

Figure 161: East Asia Market Value (US$ Million) Analysis by Application, 2019 to 2034

Figure 162: East Asia Market Volume (Tons) Analysis by Application, 2019 to 2034

Figure 163: East Asia Market Value Share (%) and BPS Analysis by Application, 2024 to 2034

Figure 164: East Asia Market Y-o-Y Growth (%) Projections by Application, 2024 to 2034

Figure 165: East Asia Market Attractiveness by Resin Type, 2024 to 2034

Figure 166: East Asia Market Attractiveness by Fiber Type, 2024 to 2034

Figure 167: East Asia Market Attractiveness by Application, 2024 to 2034

Figure 168: East Asia Market Attractiveness by Country, 2024 to 2034

Figure 169: Middle East and Africa Market Value (US$ Million) by Resin Type, 2024 to 2034

Figure 170: Middle East and Africa Market Value (US$ Million) by Fiber Type, 2024 to 2034

Figure 171: Middle East and Africa Market Value (US$ Million) by Application, 2024 to 2034

Figure 172: Middle East and Africa Market Value (US$ Million) by Country, 2024 to 2034

Figure 173: Middle East and Africa Market Value (US$ Million) Analysis by Country, 2019 to 2034

Figure 174: Middle East and Africa Market Volume (Tons) Analysis by Country, 2019 to 2034

Figure 175: Middle East and Africa Market Value Share (%) and BPS Analysis by Country, 2024 to 2034

Figure 176: Middle East and Africa Market Y-o-Y Growth (%) Projections by Country, 2024 to 2034

Figure 177: Middle East and Africa Market Value (US$ Million) Analysis by Resin Type, 2019 to 2034

Figure 178: Middle East and Africa Market Volume (Tons) Analysis by Resin Type, 2019 to 2034

Figure 179: Middle East and Africa Market Value Share (%) and BPS Analysis by Resin Type, 2024 to 2034

Figure 180: Middle East and Africa Market Y-o-Y Growth (%) Projections by Resin Type, 2024 to 2034

Figure 181: Middle East and Africa Market Value (US$ Million) Analysis by Fiber Type, 2019 to 2034

Figure 182: Middle East and Africa Market Volume (Tons) Analysis by Fiber Type, 2019 to 2034

Figure 183: Middle East and Africa Market Value Share (%) and BPS Analysis by Fiber Type, 2024 to 2034

Figure 184: Middle East and Africa Market Y-o-Y Growth (%) Projections by Fiber Type, 2024 to 2034

Figure 185: Middle East and Africa Market Value (US$ Million) Analysis by Application, 2019 to 2034

Figure 186: Middle East and Africa Market Volume (Tons) Analysis by Application, 2019 to 2034

Figure 187: Middle East and Africa Market Value Share (%) and BPS Analysis by Application, 2024 to 2034

Figure 188: Middle East and Africa Market Y-o-Y Growth (%) Projections by Application, 2024 to 2034

Figure 189: Middle East and Africa Market Attractiveness by Resin Type, 2024 to 2034

Figure 190: Middle East and Africa Market Attractiveness by Fiber Type, 2024 to 2034

Figure 191: Middle East and Africa Market Attractiveness by Application, 2024 to 2034

Figure 192: Middle East and Africa Market Attractiveness by Country, 2024 to 2034

Recommendations

Chemicals & Materials

Resin Capsule Market

Published : February 2024

Chemicals & Materials

Composite Tooling Market

Published : August 2023

Automotive

Automotive Composites Market

Published : June 2023

Chemicals & Materials

Graphene Nanocomposites Market

Published : July 2022

Explore Chemicals & Materials Insights

View Reports

High Performance Composites Market